. 2023 May 12;380(6645):eadd5327.
doi: 10.1126/science.add5327. Epub 2023 May 12.

Epigenetic plasticity cooperates with cell-cell interactions to direct pancreatic tumorigenesis

Affiliations

Epigenetic plasticity cooperates with cell-cell interactions to direct pancreatic tumorigenesis

Cassandra Burdziak et al. Science. .

Abstract

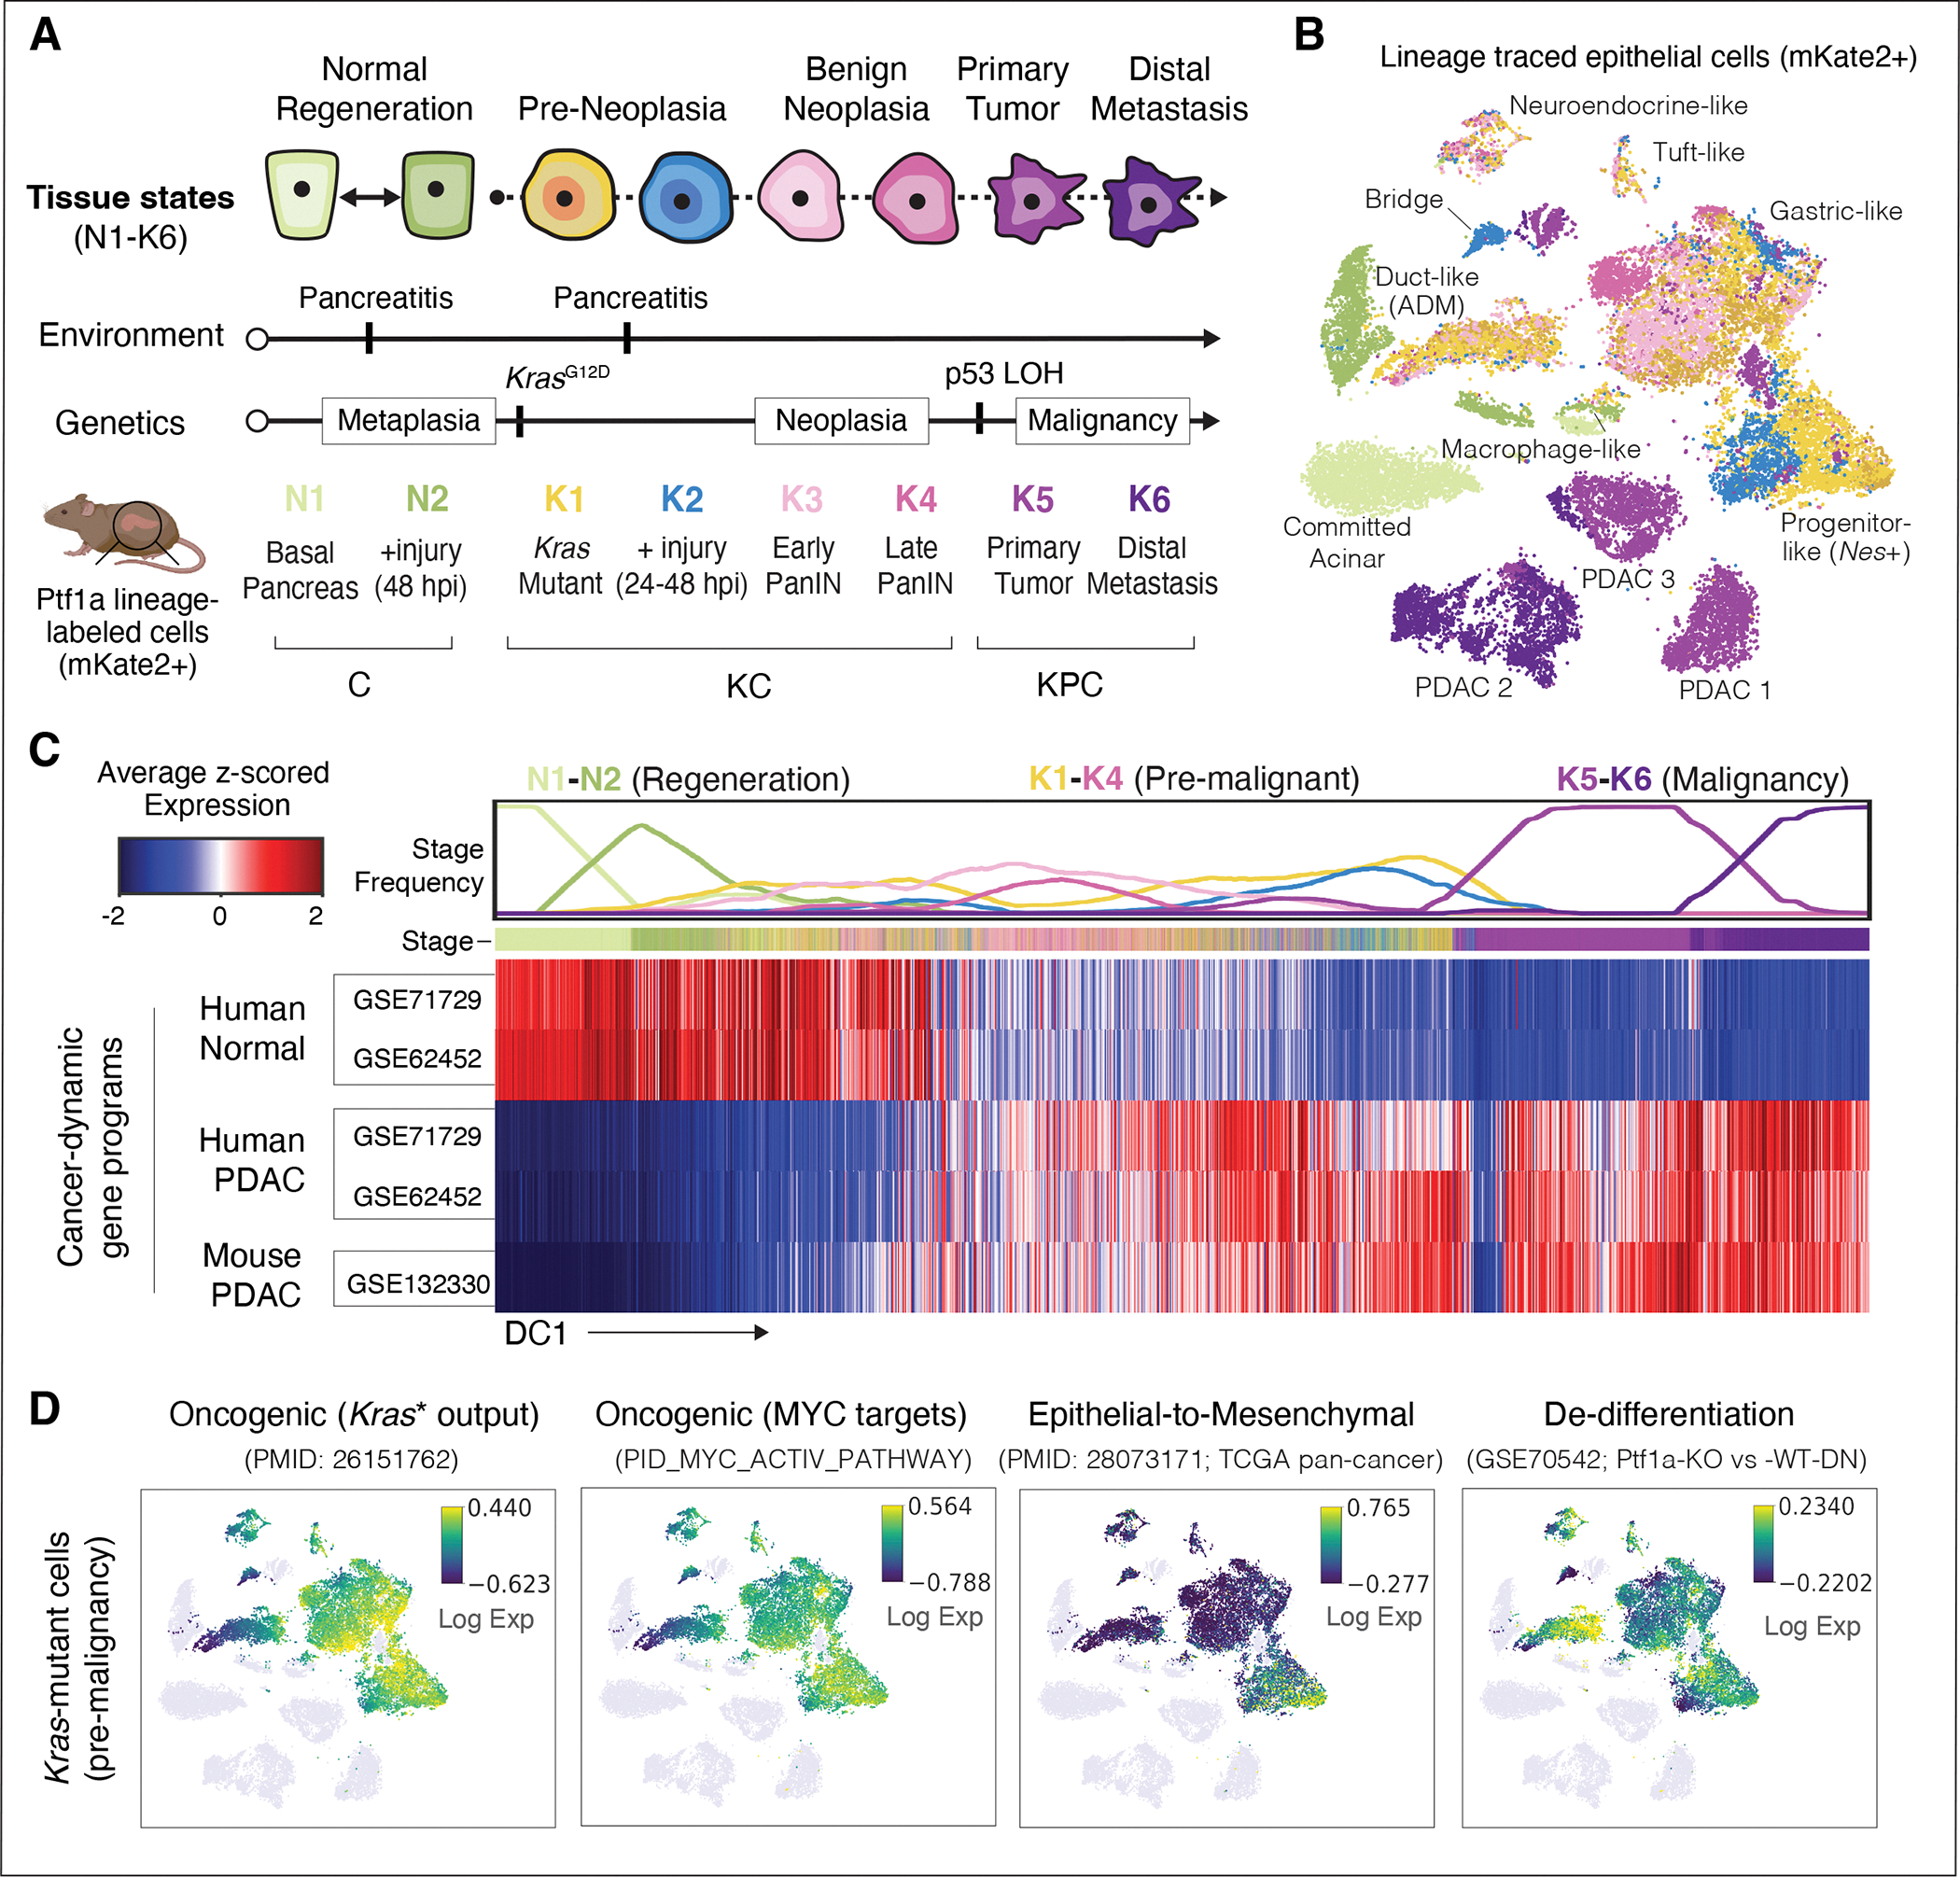
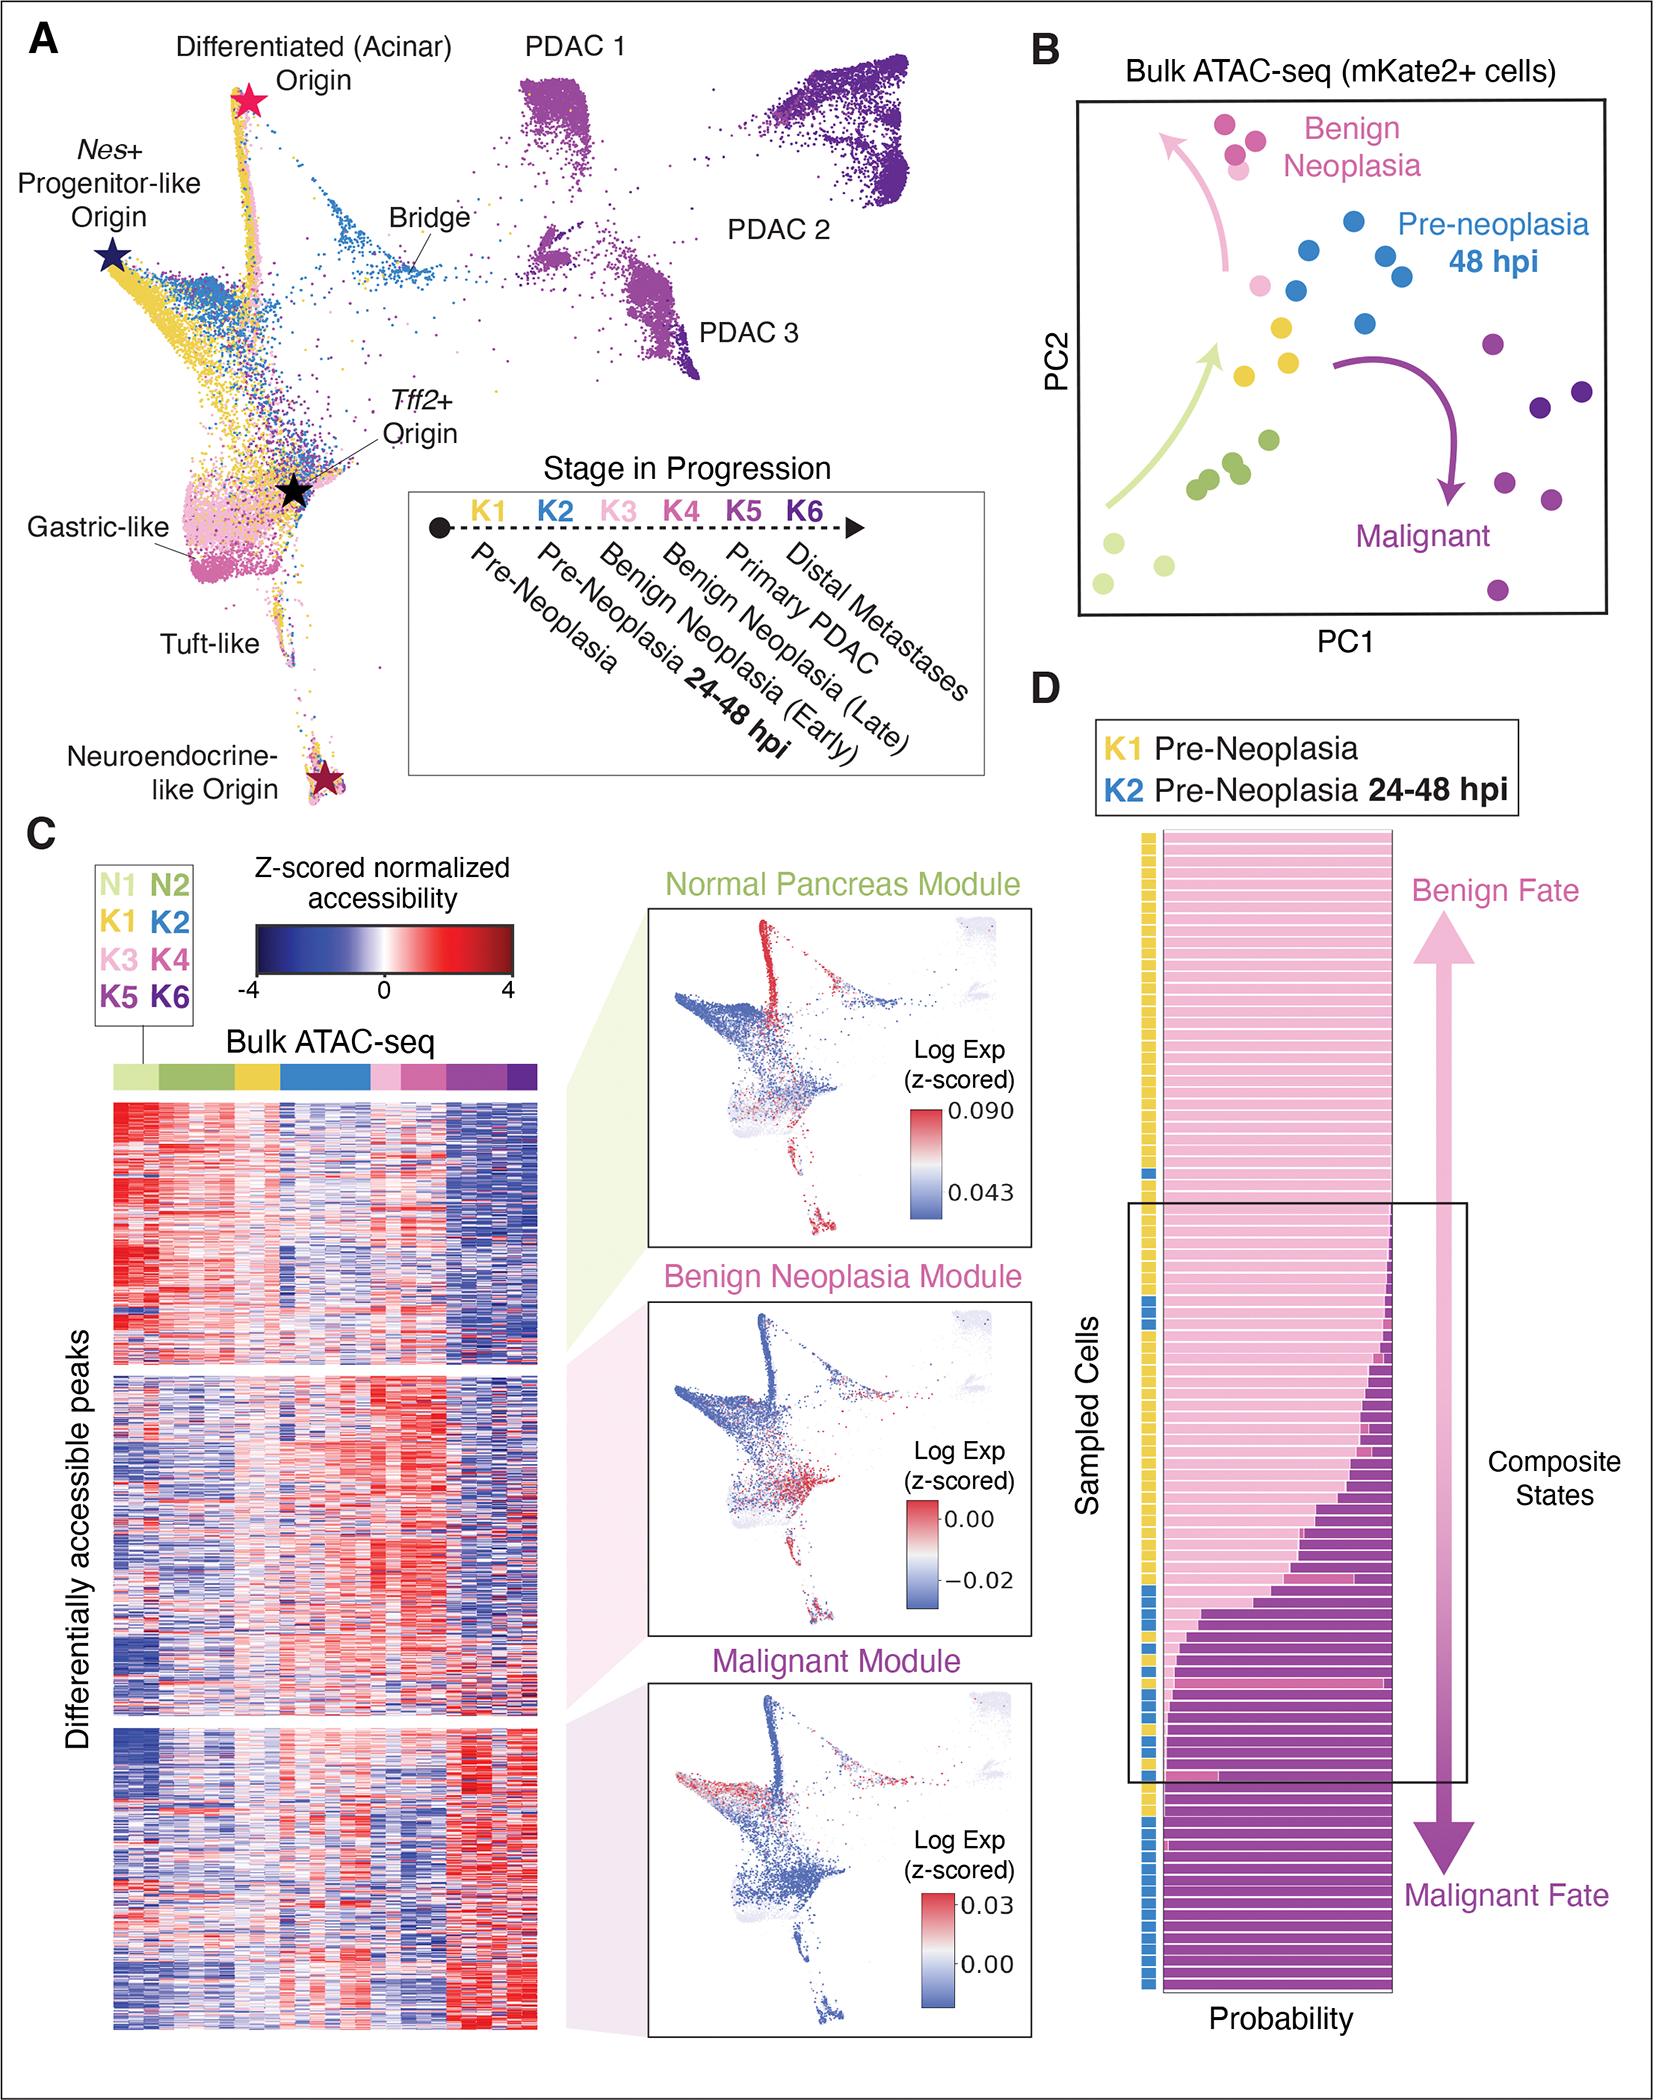
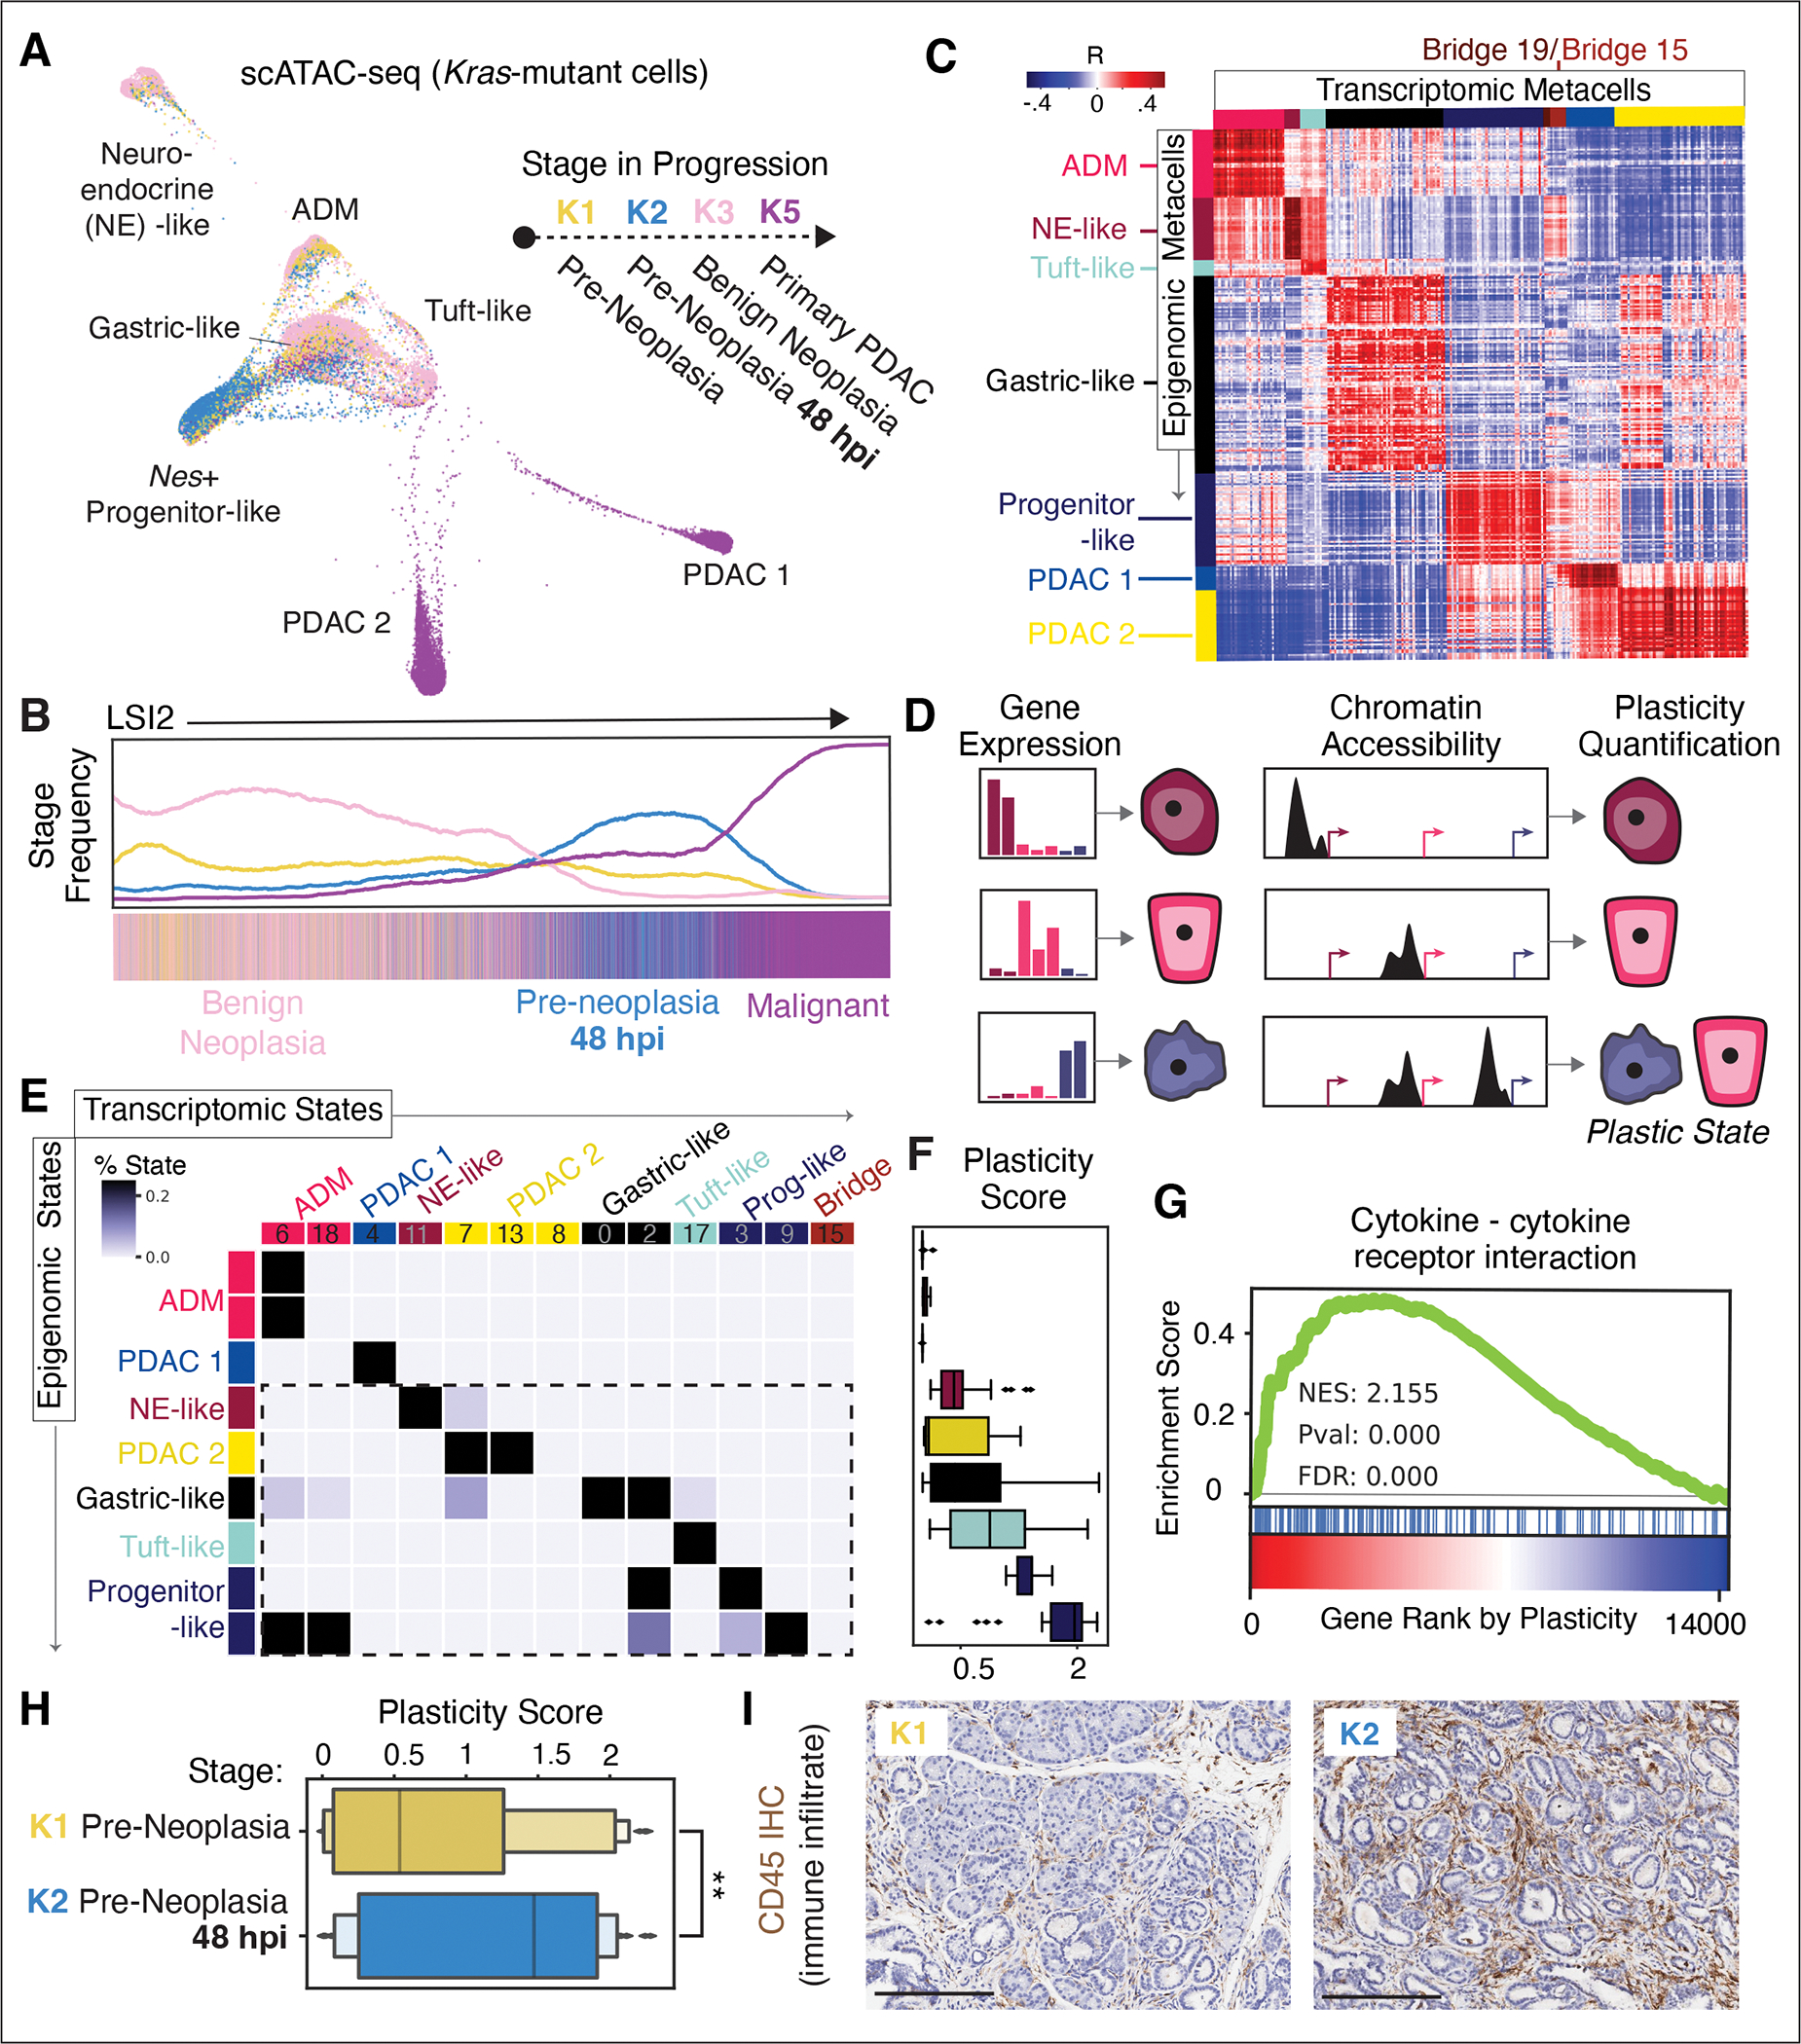
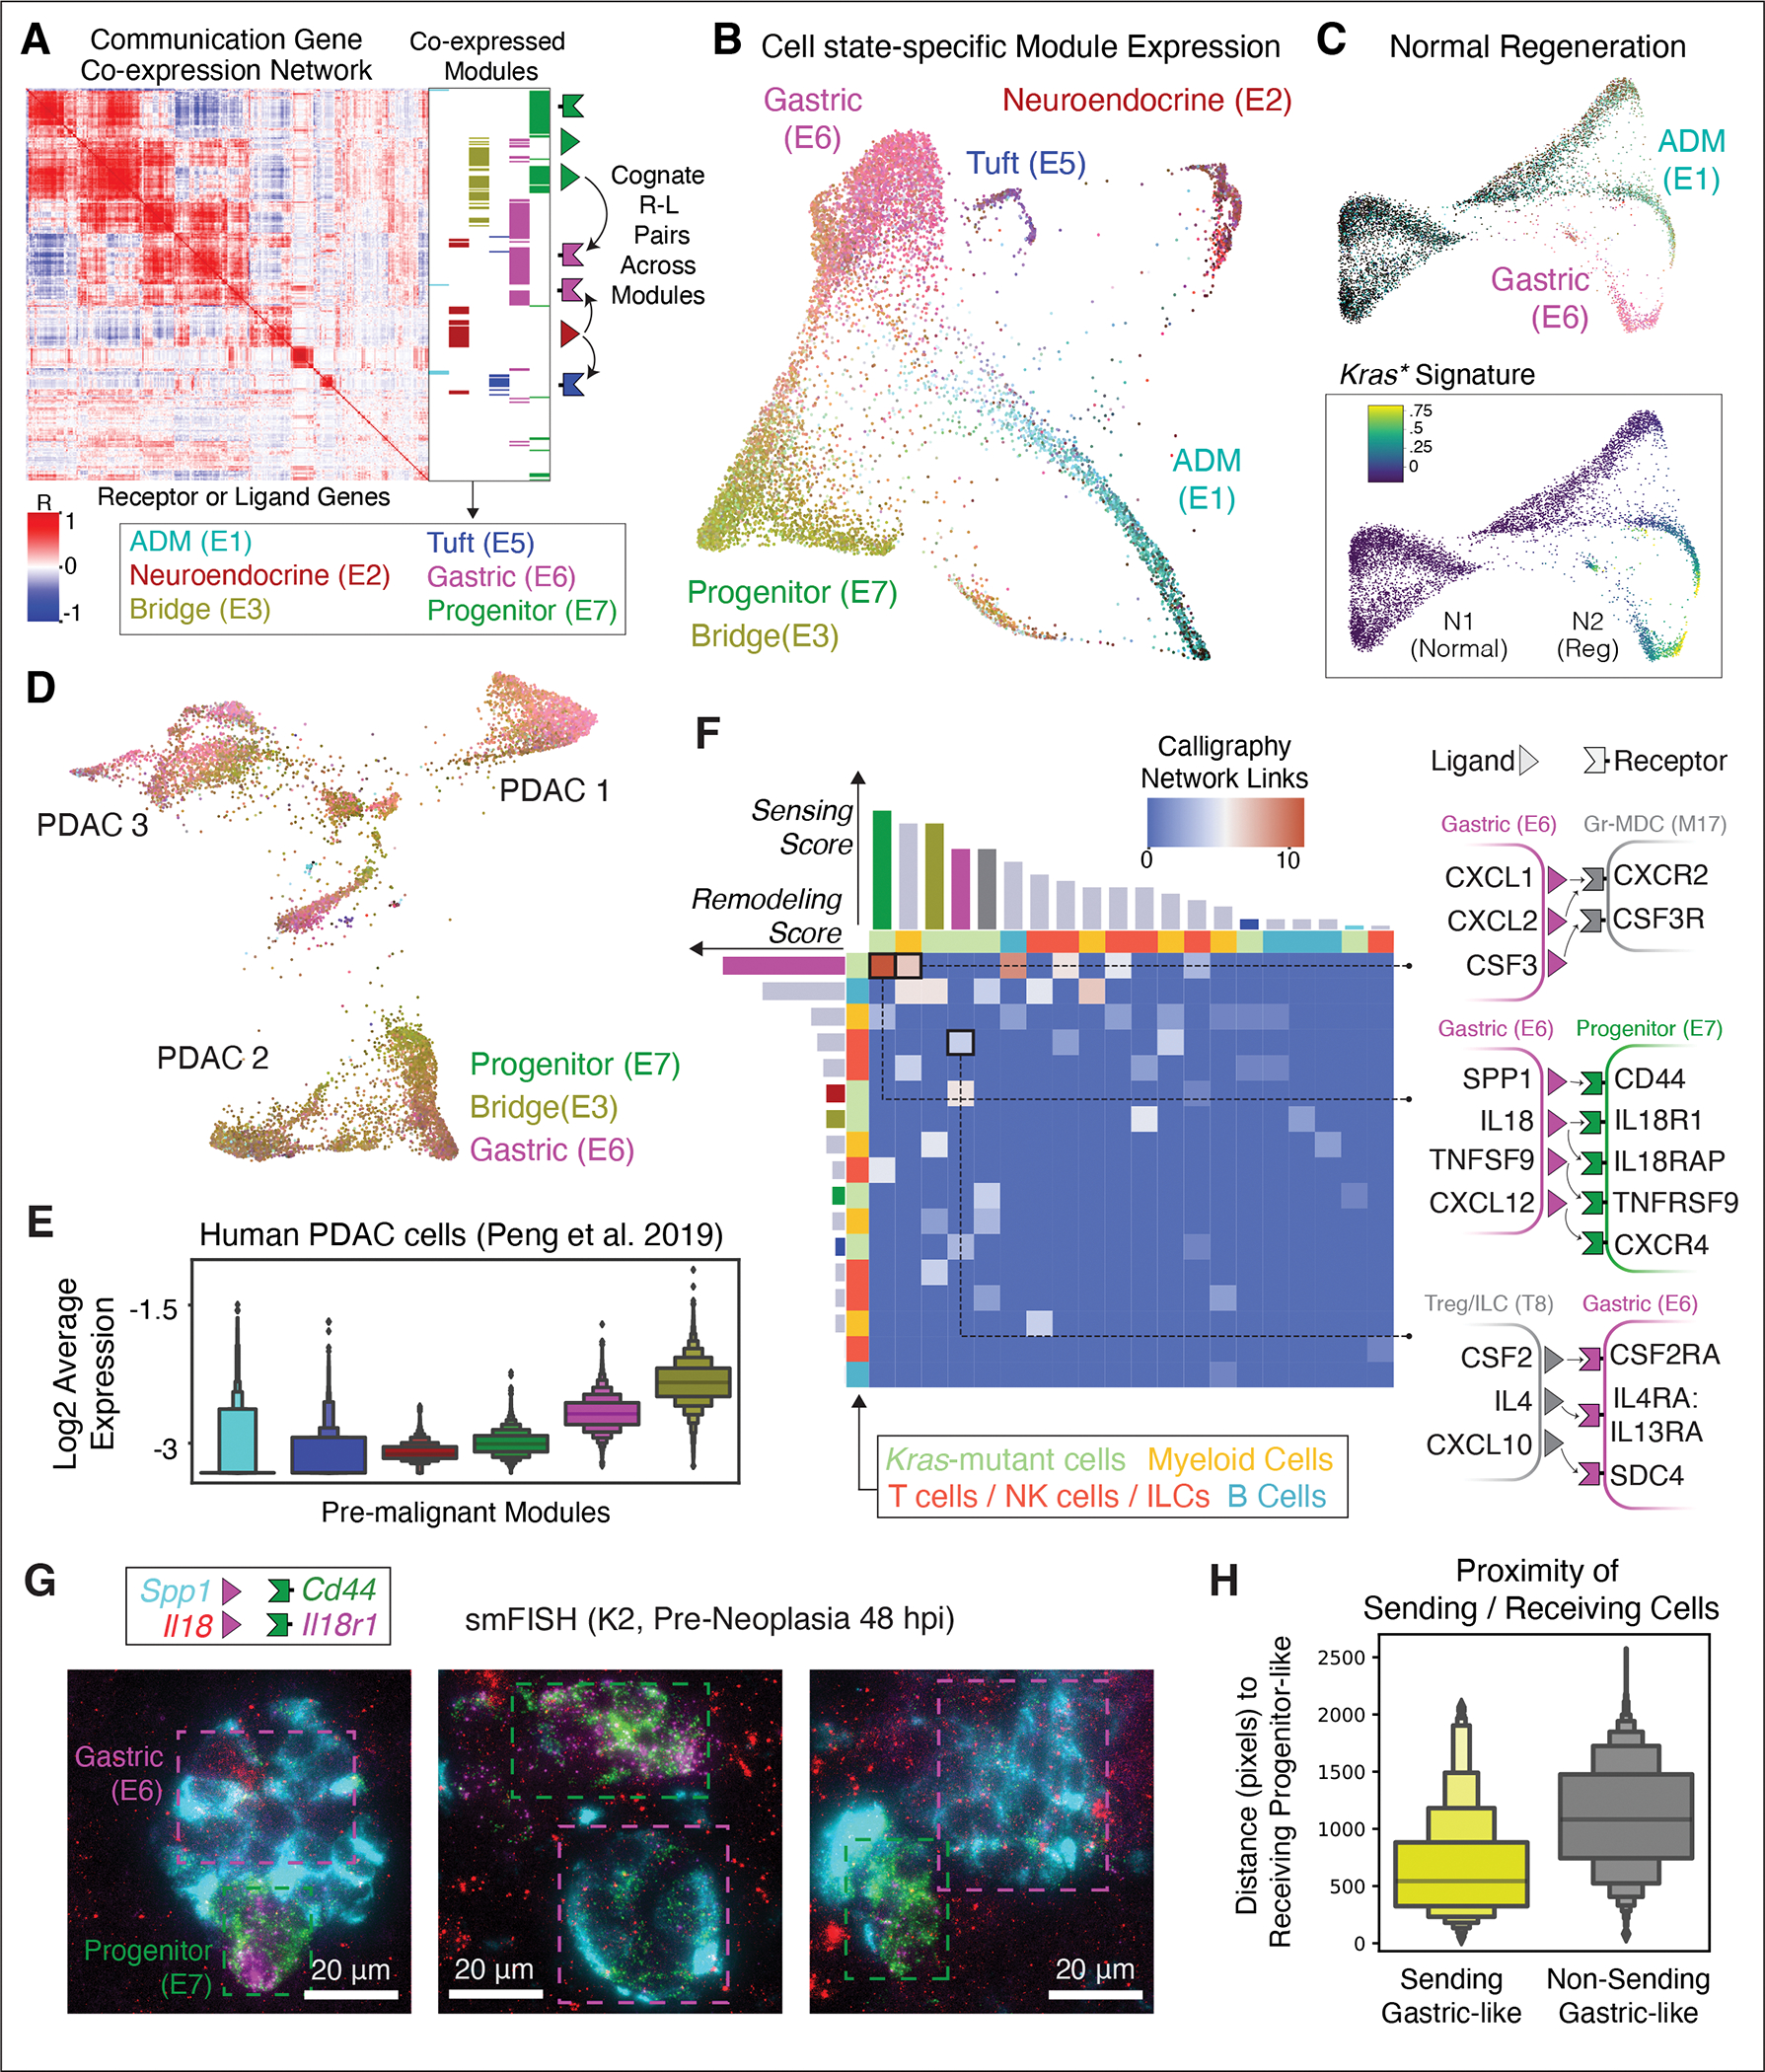
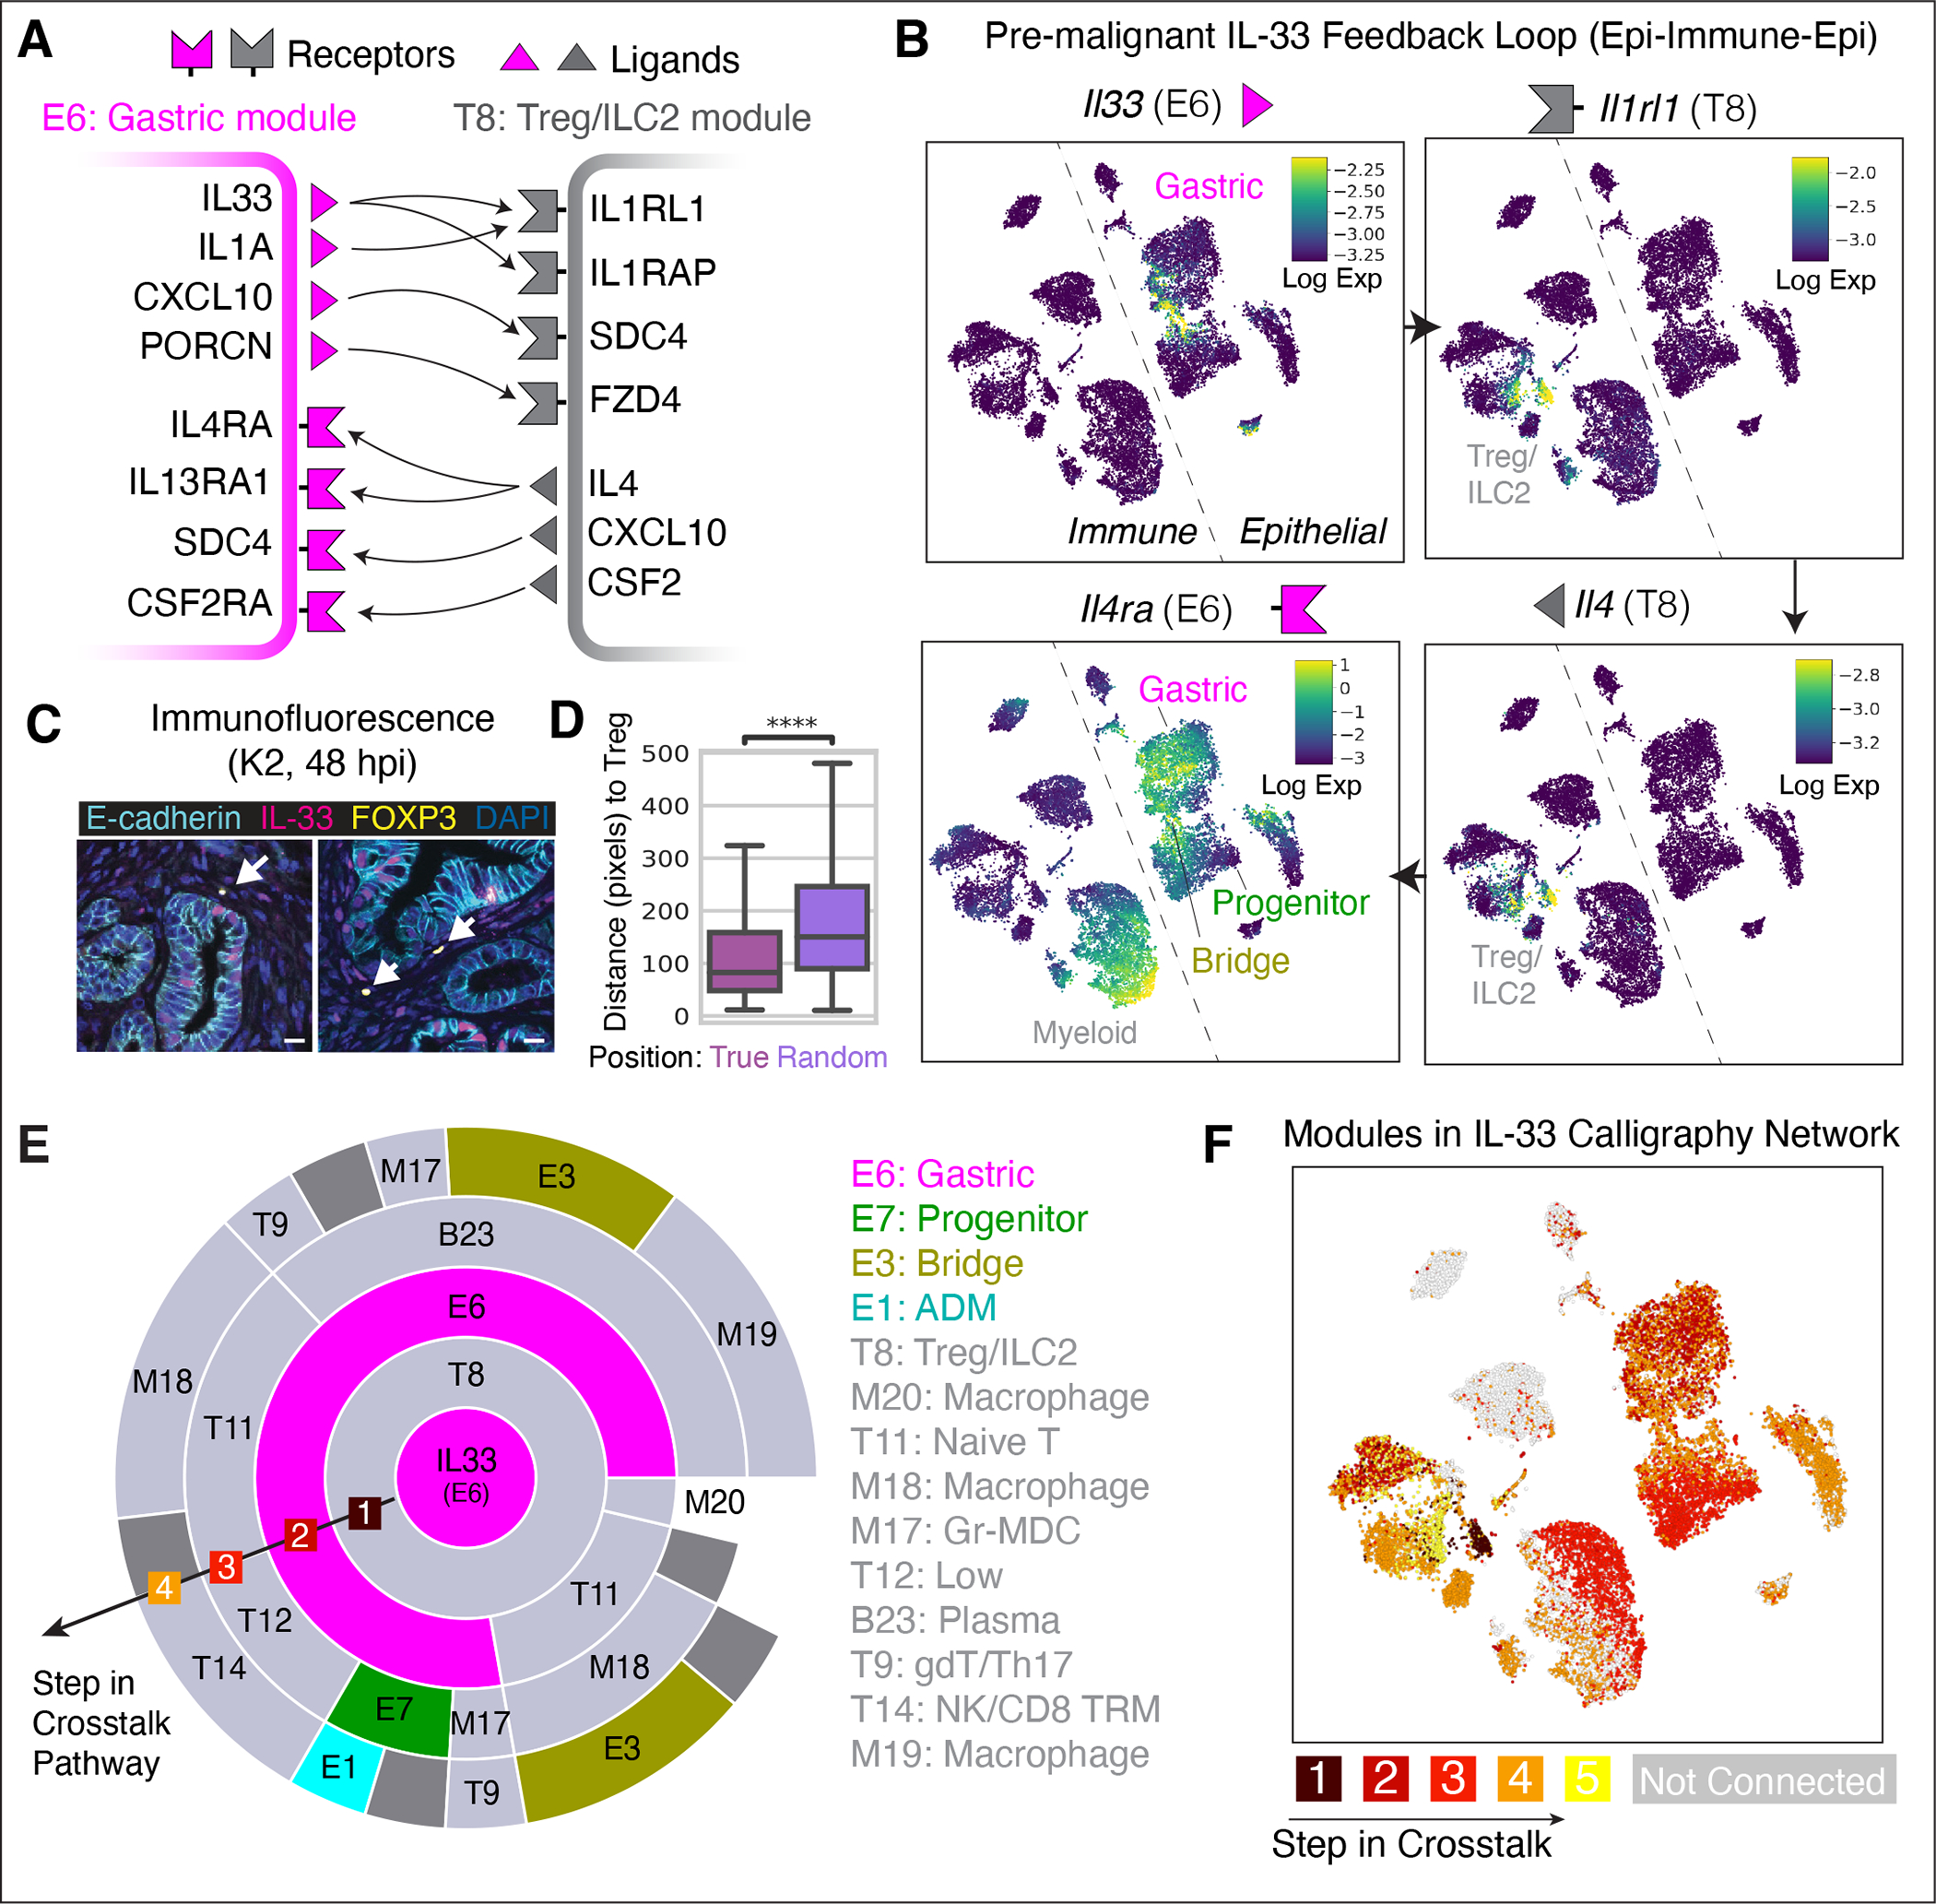
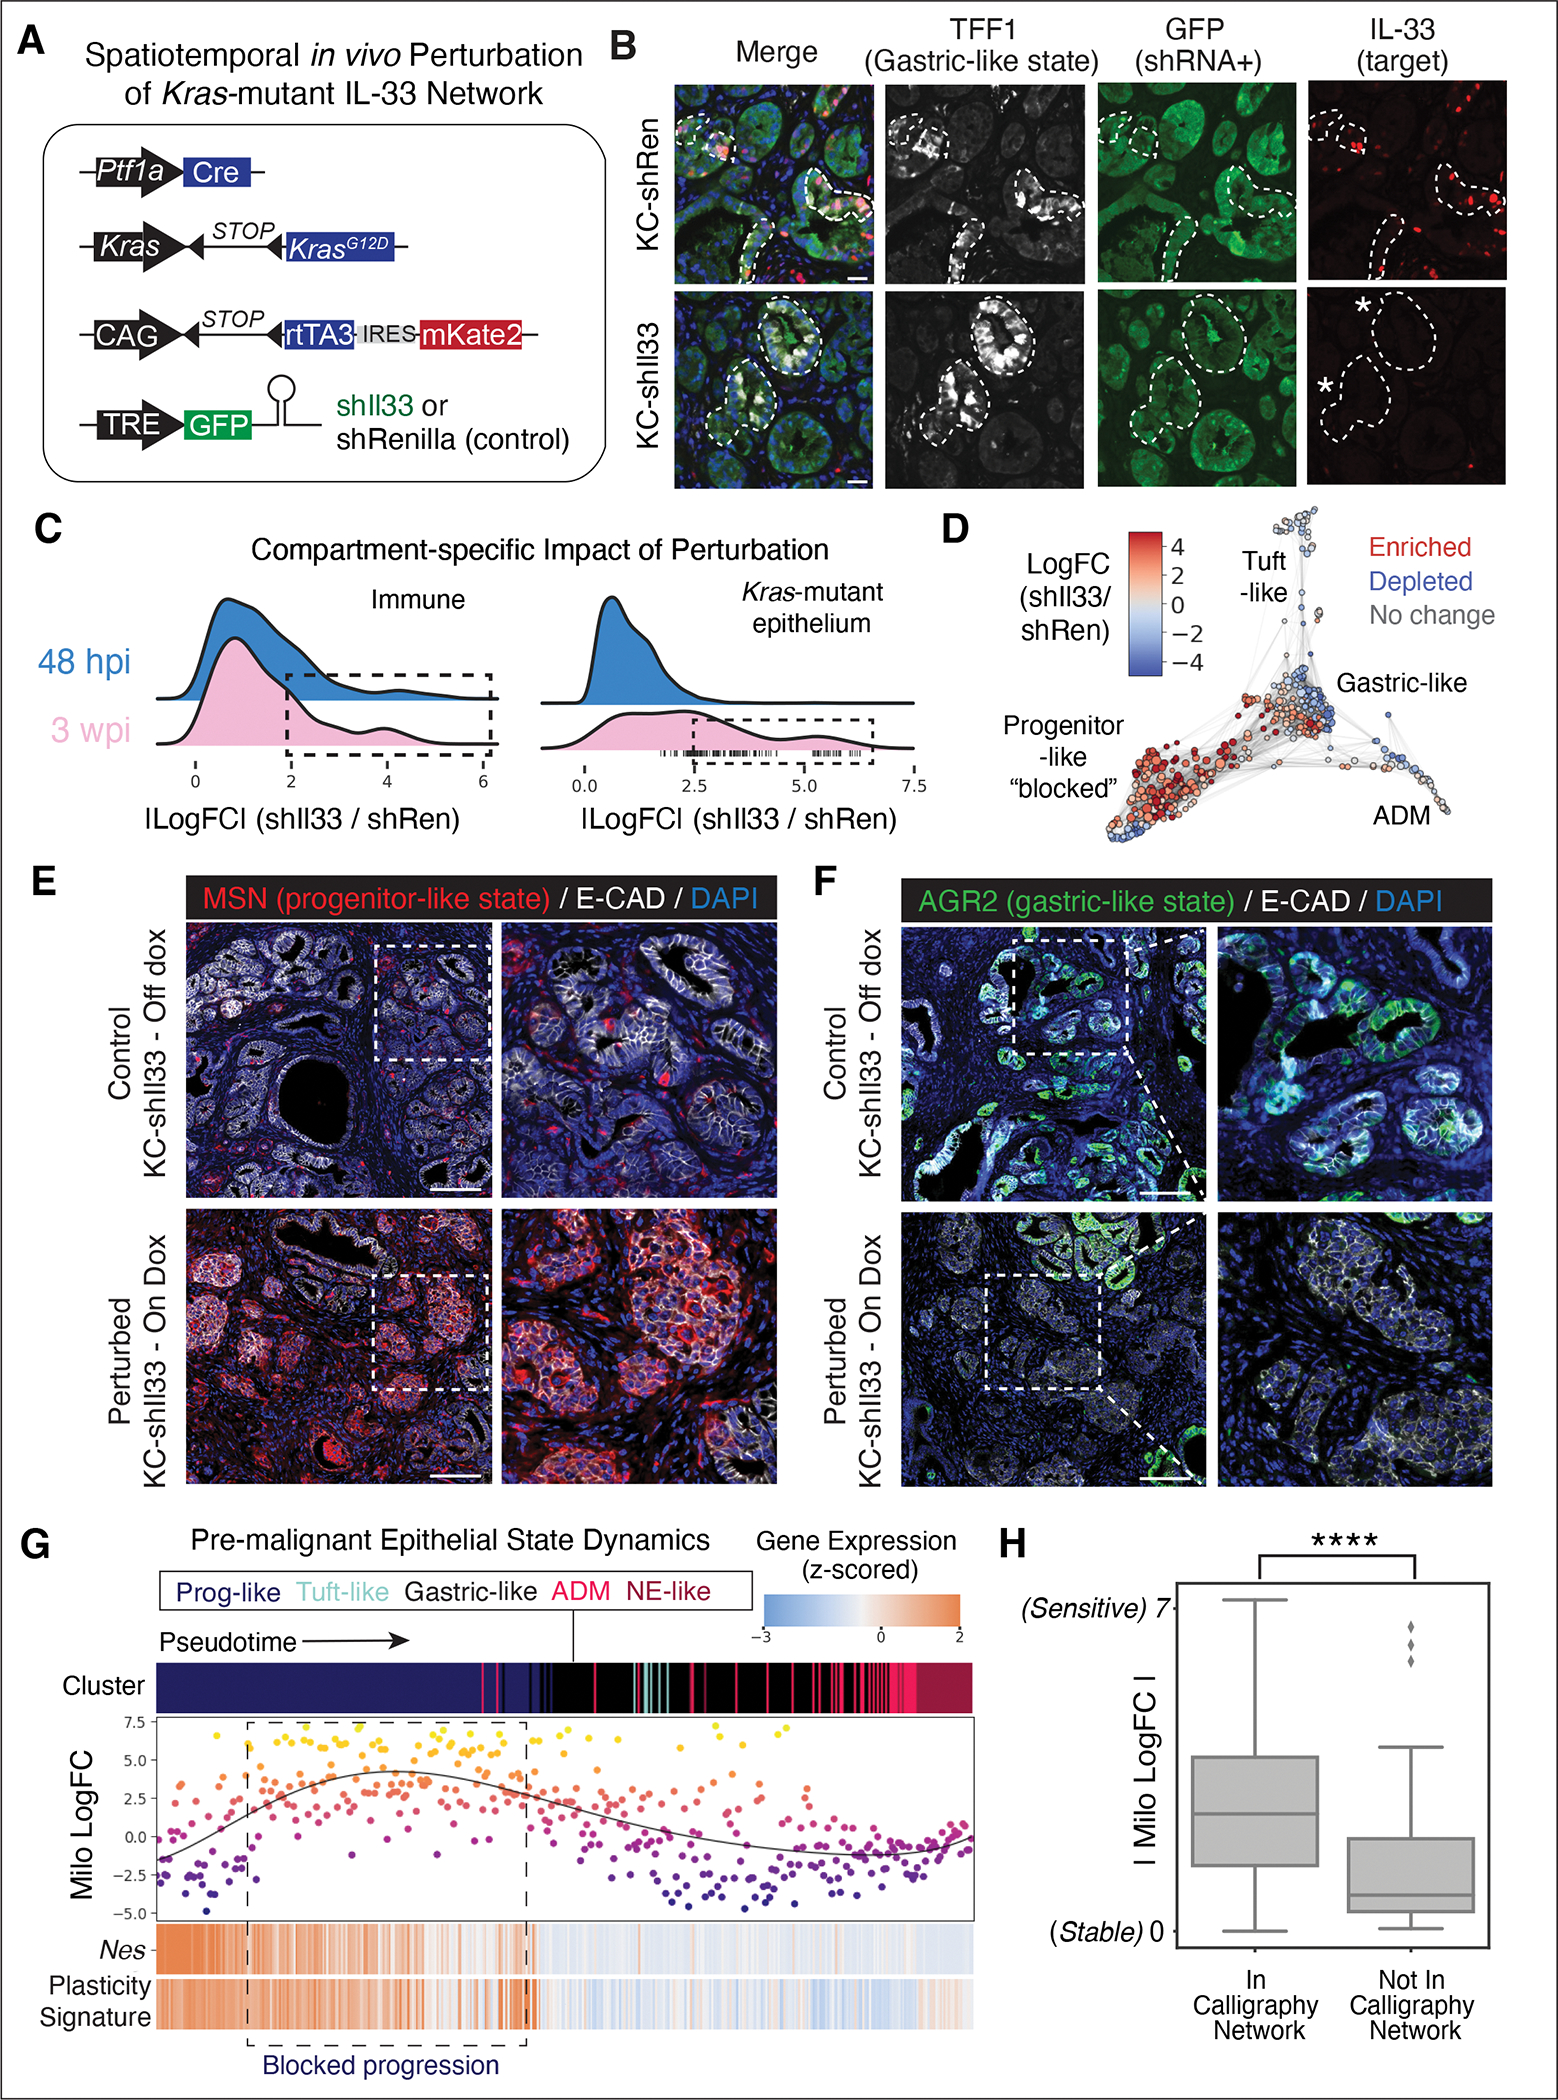
The response to tumor-initiating inflammatory and genetic insults can vary among morphologically indistinguishable cells, suggesting as yet uncharacterized roles for epigenetic plasticity during early neoplasia. To investigate the origins and impact of such plasticity, we performed single-cell analyses on normal, inflamed, premalignant, and malignant tissues in autochthonous models of pancreatic cancer. We reproducibly identified heterogeneous cell states that are primed for diverse, late-emerging neoplastic fates and linked these to chromatin remodeling at cell-cell communication loci. Using an inference approach, we revealed signaling gene modules and tissue-level cross-talk, including a neoplasia-driving feedback loop between discrete epithelial and immune cell populations that was functionally validated in mice. Our results uncover a neoplasia-specific tissue-remodeling program that may be exploited for pancreatic cancer interception.


Conflict of interest statement

Competing interests: Scott W. Lowe is a consultant and holds equity in Blueprint Medicines, ORIC Pharmaceuticals, Mirimus Inc., PMV Pharmaceuticals, Faeth Therapeutics, and Constellation Pharmaceuticals. A patent application (PTC/US2019/041670, internationally filing date 12 July 2019) has been submitted covering methods for preventing or treating KRAS mutant pancreas cancer with inhibitors of Type 2 cytokine signaling. Direna Alonso-Curbelo and Scott W. Lowe are listed as the inventors. Dana Pe’er is on the scientific advisory board of Insitro. Thomas Walle reports stock ownership for Roche, Bayer, Innate Pharma, Illumina and 10x Genomics as well as research funding (not related to this study) from CanVirex AG, Basel Switzerland and Institut für Klinische Krebsforschung GmbH, Frankfurt, Germany. Cassandra Burdziak, Direna Alonso-Curbelo, Scott W. Lowe, and Dana Pe’er are listed as inventors on a provisional patent application (63/390,075) related to aspects of this work, where Memorial Sloan Kettering Cancer Center is the applicant.

Figures

Figure 1.
Figure 1.. A single-cell transcriptomic atlas of pancreatic regeneration and tumorigenesis.
(A) Experimental design for tissue collection. GEMMs expressing Ptf1a-Cre enable FACS-based enrichment of mKate2-labeled exocrine pancreas epithelial cells (23). mKate2+ cells were isolated from wild-type Kras mice before injury with caerulein (N1) or 48 hours post-injury (N2); and from KrasG12D mice (KC genotype) before injury (K1), and 24–48 hours (K2) or 3 weeks after caerulein (K3, PanIN stage), as well as uninjured older KC mice (K4). PDAC primary tumors (K5) and liver and lung metastases (K6) were harvested from KC mice with a p53 floxed (p53fl/+) or mutant (p53R172H/+) allele (KPC genotype). Mouse illustration was created with BioRender (https://biorender.com/). (B) tSNE visualization of pancreatic epithelial scRNA-seq profiles from all collected stages (n = 17 mice), colored as in (A) and labeled by cell-state (27). ADM denotes cells undergoing acinar-to-ductal metaplasia (31), and ‘Bridge’ denotes cells between acinar-like and malignant programs, which express genes from both. (C) Expression of PDAC-associated gene sets (rows) across all pancreatic epithelial cells (columns) (34, 35). Cells are ordered by the first diffusion component (DC1), representing the major axis of progression from normal (N1) to metastatic (K6) states. Plot at top displays frequency (from 0 to 1) of cells per stage, in bins of n = 2000 cells. Gene set score for each cell is computed as the average of log-normalized expression, z-scored for each gene to obtain a comparable scale. Heatmap is standardized to compare cells within each gene set. (D) tSNE plots as in (B), with pre-malignant (K1–K4) Kras-mutant cells colored by the expression of genes (from left to right) upregulated in bulk RNA-seq of Kras-mutant (Kras*) pancreas relative to normal (67), associated with Myc activity (68), EMT (36), or down-regulated upon Ptf1a knockout (67). Colors are scaled from 5th to 95th percentile of expression.
Figure 2.
Figure 2.. Differential epigenetic priming of Kras-mutant cells.
(A) Force-directed layout (FDL) of all Kras-mutant scRNA-seq profiles (K1–K6, n = 11 mice). Cells colored by stage as in Fig. 1A. Stars highlight ‘apex’ states inferred by CellRank (39) (see Fig. S3B). (B) Principal component analysis (PCA) of bulk ATAC-seq profiles from pancreatic epithelial cells. Each point shows the position of a single biological replicate (individual mouse), colored by stage as in (A). Arrows indicate a transition upon injury and Kras mutation (N1-N2, K1-K2; green arrow) and a divergence between benign neoplastic (K3-K4; pink arrow) and malignant (K5-K6; purple arrow) stages. (C) Left: Chromatin accessibility along progression. Subsets of differentially accessible ATAC-seq peaks (rows) are organized into three modules by clustering (27); bulk ATAC-seq replicates (columns) are ordered and colored by stage as in (A). Peaks organize into distinct accessibility patterns, denoted as chromatin modules (27). Right: Expression of genes corresponding to chromatin accessibility modules in pre-neoplastic cells (K1, K2). FDL map as in (A), colored by module expression score computed by z-scoring each cell to emphasize dominant gene programs per cell, and averaging genes nearest to module peaks. Color (expression scores) are scaled between the 40th and 90th percentiles. (D) Probability of classifying pre-neoplastic cells (K1, K2) as more similar to benign neoplastic (K3-K4) or malignant (K5-K6) scRNA-seq profiles, based on expression similarity. Sampled cells (rows) are ordered from highest benign fate probability (top) to highest malignant fate probability (bottom); bars represent probability of classification from 0 to 1 to K3, K4, K5, or K6 labels, colored as in (A). A fraction of cells exhibit composite states with probability for both fates.
Figure 3.
Figure 3.. Kras-mutant cells display elevated epigenetic plasticity, which is associated with cell-cell communication propensity.
(A) FDL of scATAC-seq profiles from Kras-mutant epithelial cells from pre-malignant (K1–K3) and malignant (K5) stages (n = 9 mice), colored by stage. (B) Frequency of cells from each stage along second high-variance component from latent semantic indexing (LSI) of scATAC-seq profiles (65). (C) Pairwise Pearson correlation coefficients of metacells from scATAC-seq ArchR gene accessibility scores (rows) and scRNA-seq expression values (columns). Annotated cell-states, determined by refined PhenoGraph clustering of scRNA-seq (Fig. S1C) and scATAC-seq (Fig. S5A), are colored according to their annotation as in labels from (A). Blocks of positive correlation along diagonal represent similar cell-states across the two modalities, whereas off-diagonal correlations indicate similarity across distinct cell-states. (D) Cartoon of classifier-based approach to quantify plasticity (27). (E) Classifier confusion matrix based on procedure in (D). Cell-states, determined by scRNA-seq (Fig. S1C) and scATAC-seq (Fig. S5A) metacell clusters, are colored as in labels in (A). Values represent number of metacells from an epigenomic cluster that classify to a transcriptomic cluster, normalized within each row. Dashed box highlights high plasticity epigenomic states. (F) Plasticity scores for epigenomic clusters in (E). Boxes represent interquartile range (IQR) of plasticity scores for all epigenomic metacells assigned to that cluster, computed as per-cell Shannon entropy in the classifier’s predicted probability distribution across transcriptomic states. Lines represent medians and whiskers represent 1.5x IQR. (G) GSEA plot based on Spearman rank correlation between plasticity score and each gene’s accessibility score. (H) Plasticity scores for epigenomic metacells from K1 and K2, showing significant increase in plasticity in K2 (one-tailed t-test; t = 2.5511, p value = 0.006). (I) Immunohistochemistry of CD45 (brown) marking immune cells in K1 and K2 tissue, showing increase in immune infiltrate in response to injury. Scale bar, 200 μm.
Figure 4.
Figure 4.. Inferred epithelial-immune crosstalk in plastic neoplastic states.
(A) Calligraphy-inferred ‘communication modules’ in pre-malignant Kras-mutant epithelial cells (K1-K3, n = 6 mice). Each row or column represents one receptor or ligand; value at intersection indicates correlation in expression (Pearson r) of that gene pair across pre-malignant cells. Blocks of highly correlated genes denote partially overlapping modules (annotated at right) that tend to co-express in the same cell-states. Schematic (far right) describes the second step of Calligraphy (see Fig. S11A). (B) FDL of K1–K3 epithelial cells with color values based on relative communication module gene expression (27). (C) FDL of KrasWT pancreas cells before and after injury (N1-N2, n = 4 mice), colored by K1–K3 communication module expression as in (B) (top) or Kras mutant signature gene expression (bottom, (23)), scaled between 1st and 99th percentile. (D) FDL of malignant cells (K5-K6, n = 3 mice), colored as in (B). (E) Communication module expression in human pancreatic tumor scRNA-seq data (32), colored as in (B). (F) Pairwise crosstalk between communication modules inferred by Calligraphy from epithelial or immune scRNA-seq data (one module per row or column), colored gray for immune or as in (A) for epithelial modules. Heat values represent number of inferred cognate R-L pair interactions across each communicating module pair; some contributing receptors or ligands are shown at right. Bars quantify total inferred edge counts, representing remodeling (row) or sensing (column) interactions for that module. (G) Two smFISH fields of view reveal the spatial proximity of sending (magenta box) to receiving (green box) mKate2+ epithelial cells. The expression of two Gastric (E6) module ligands (cyan and red), as well as two Progenitor (E7) receptors (magenta and green) overlap spatially in these three examples. Scale bars, 20 μm. (H) Distance between each receiving progenitor cell (Il18r1hi Cd44hi) and double-positive sending gastric cell (Il18hi Spp1hi), versus randomly selected non-sending gastric cells (Il18lo Spp1lo).
Figure 5.
Figure 5.. Kras-mutant epithelial states participate in a feedback loop with immune populations.
(A) A feedback loop identified by Calligraphy in the pre-malignant pancreas. Arrows depict cognate R-L interactions. (B) tSNEs of immune and epithelial scRNA-seq data from pre-malignant stages (K1–K3, n = 6 mice), displaying imputed expression (69) of key genes from the loop in (A). Arrows between plots indicate sequential steps of the loop. (C) Co-immunofluorescence (co-IF) images showing co-expression of IL-33 and E-cadherin (epithelial marker), and apposition of FOXP3-expressing Tregs (arrows) and IL-33-expressing epithelial cells. Scale bar, 10 μm. (D) Distance in pixels (0.325 μm per pixel) of IL-33+ epithelial cells to Tregs against a null model of spatial distribution in co-IF data pooled across all biological replicates from K2 tissue. Distances are calculated between each IL-33+ epithelial (E-cadherin+) cell and its closest Treg (CD3+ FOXP3+). Asterisks, significant difference (one-tailed, un-paired t-test, p value < 0.0001) compared to random distances calculated by permuting epithelial cells. (E) IL-33-centric crosstalk paths originating from epithelial Gastric module E6 (central circle, magenta), with each outward concentric circle illustrating possible communication paths from inner to outer modules based on links inferred by Calligraphy. Arc length is proportional to the number of inner-module ligands that can bind to cognate receptors in the outer module. (F) tSNE as in (B), colored according to the step in which communication events from the IL-33-centric path in (E) reach the module expressed by that cell. Cells are assigned to their highest-expressed module, and each module is scored by the earliest step in which it appears along any paths through the Calligraphy network emanating from E6-derived IL-33. Cells expressing modules which are not downstream of IL-33 are colored in gray.
Figure 6.
Figure 6.. Spatiotemporal in vivo perturbation of Il33 impairs neoplastic progression.
(A) Mouse models for inducible repression of Il33 (KC-shIl33, 2 independent strains) or Renilla control (KC-shRen), restricted to Kras-mutant epithelial cells by Ptf1a-Cre expression. (B) Representative IF of pancreata from control (top) or KC-shIl33 (bottom) mice placed on dox at 5 weeks of age and analyzed 9 days later at the 48 hpi timepoint (K2). Kras-mutant epithelial cells, not surrounding stroma, express Il33 shRNA marked by GFP in KC-shIl33; TFF1 marks cell-state in which IL-33 is activated at 48 hpi in control but not shIl33 animals. Dashed lines demark epithelium-stroma boundary, asterisks highlight suppression of Il33 in TFF1+ metaplastic cells of KC-shIl33 mice. DAPI marks nuclei (blue). Scale bar, 20 μm. (C) Milo (60) log fold change (logFC) magnitudes across cell neighborhoods (n = 5 mice), with higher values indicating greater impact of IL-33 perturbation. Rightward distribution shifts (dotted lines) indicate a larger impact on particular cell-states; vertical dashed lines indicate neighborhoods with significant (adjusted p < 0.1) shifts according to Milo, appearing only in K3 epithelia. (D) FDL of Milo neighborhoods colored by logFC of abundance in shIl33 samples relative to controls, at the late (3 wpi) timepoint. (E,F) Representative IF in pancreata from KC-shIl33 mice placed on-dox (bottom) or off-dox (top) at 3 wpi (K3), showing (E) aberrant accumulation of progenitor-like state (MSN+) in epithelial cells (E-cadherin+) of IL-33-perturbed animals at 48 hpi and (F) depletion of gastric-like (AGR2+) states upon epithelial IL-33 suppression. DAPI marks nuclei (blue). Scale bar, 100 μm. (G) Impacts of Il33 perturbation across Kras-mutant epithelial neighborhoods at K3 (3 wpi). Top, pseudotime-ordered neighborhoods (columns) colored by cell-state. Middle, neighborhoods plotted and colored by Milo logFC; higher logFC denotes greater abundance in shIl33 relative to control. Bottom, Nes and plasticity-associated gene expression (Fig. 3F) (27); heatmap colors scaled to ±2 s.d. from mean. (H) Milo logFC of neighborhoods mapped to modules that are (left) or are not (right) downstream of Calligraphy’s IL-33-centric network; asterisks, indicate significance (unpaired, one-tailed t-test, p value = 1.24 X 10⁻⁷).

Comment in

References

    1. Vogelstein B, Papadopoulos N, Velculescu VE, Zhou S, Diaz LA Jr, Kinzler KW, Cancer genome landscapes. Science. 339, 1546–1558 (2013). - PMC - PubMed
    1. Martincorena I, Roshan A, Gerstung M, Ellis P, Van Loo P, McLaren S, Wedge DC, Fullam A, Alexandrov LB, Tubio JM, Stebbings L, Menzies A, Widaa S, Stratton MR, Jones PH, Campbell PJ, Tumor evolution. High burden and pervasive positive selection of somatic mutations in normal human skin. Science. 348, 880–886 (2015). - PMC - PubMed
    1. Wijewardhane N, Dressler L, Ciccarelli FD, Normal Somatic Mutations in Cancer Transformation. Cancer Cell. 39, 125–129 (2021). - PubMed
    1. Hanahan D, Hallmarks of Cancer: New Dimensions. Cancer Discov. 12, 31–46 (2022). - PubMed
    1. Nam AS, Chaligne R, Landau DA, Integrating genetic and non-genetic determinants of cancer evolution by single-cell multi-omics. Nat. Rev. Genet. 22, 3–18 (2021). - PMC - PubMed