. 2023 Jun 7;14(11):2123-2133.
doi: 10.1021/acschemneuro.3c00110. Epub 2023 May 11.

Cyanomethyl Vinyl Ethers Against Naegleria fowleri

Affiliations

Cyanomethyl Vinyl Ethers Against Naegleria fowleri

Javier Chao-Pellicer et al. ACS Chem Neurosci. .

Abstract

Naegleria fowleri is a pathogenic amoeba that causes a fulminant and rapidly progressive disease affecting the central nervous system called primary amoebic meningoencephalitis (PAM). Moreover, the disease is fatal in more than 97% of the reported cases, mostly affecting children and young people after practicing aquatic activities in nontreated fresh and warm water bodies contaminated with these amoebae. Currently, the treatment of primary amoebic meningoencephalitis is based on a combination of different antibiotics and antifungals, which are not entirely effective and lead to numerous side effects. In the recent years, research against PAM is focused on the search of novel, less toxic, and fully effective antiamoebic agents. Previous studies have reported the activity of cyano-substituted molecules in different protozoa. Therefore, the activity of 46 novel synthetic cyanomethyl vinyl ethers (QOET-51 to QOET-96) against two type strains of N. fowleri (ATCC 30808 and ATCC 30215) was determined. The data showed that QOET-51, QOET-59, QOET-64, QOET-67, QOET-72, QOET-77, and QOET-79 were the most active molecules. In fact, the selectivity index (CC50/IC50) was sixfold higher when compared to the activities of the drugs of reference. In addition, the mechanism of action of these compounds was studied, with the aim to demonstrate the induction of a programmed cell death process in N. fowleri.

Keywords: Naegleria fowleri; apoptosis; cyanomethyl vinyl ethers; cytotoxicity; primary amoebic meningoencephalitis; programmed cell death.


Conflict of interest statement

The authors declare no competing financial interest.

Figures
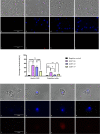
Figure 1
Figure 1
Chromatin condensation detection with a double-stain assay apoptosis detection kit (Hoechst 33342/PI). Naegleria fowleri trophozoites (ATCC 30808) incubated with IC90 of cyanomethyl vinyl ethers QOET-59 (B,F,J), QOET-72 (C,G,K), and QOET-77 (D,H,L) comparing with the negative control (A,E,I).Treated amoeba shows an intense blue stained nuclei (F–H) that correspond to the Hoechst fluorochrome whereas no fluorescence was observed in the control cells (E). Overlay channel (A–D); Hoechst channel (E–H) and propidium iodide channel (I–L). Images (1; ×40) (2; x100) are the representative of the cell population observed in the performed experiments. Images were obtained using a Discover Echo Inc. Revolution Microscope (Discover Echo, San Diego, CA).The bar graph includes the estimated percentage of stained cells. Differences between the values were assessed using an one-way analysis of variance (ANOVA). Data are presented as means ± SD (N = 3); ns: not significant, *p < 0.1; **p < 0.01; ***p < 0.001; ****p < 0.0001 significant differences when comparing treated cells to negative control. Mean percentage of stained cells for each assay was determined using the Discover Echo Inc. Revolution Microscope software. All the experiments were conducted in triplicate. (Images 1 scale bar: 75 μm and images 2 scale bar: 20 μm).
Figure 2
Figure 2
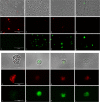
Analysis of mitochondrial membrane potential disruption in Naegleria fowleri (ATCC 30808). Trophozoites of N. fowleri (ATCC 30808) treated with QOET-59 (B,F,J), QOET-72 (C,G,K) and QOET-77 (D,H,L) using the reagent JC-1 Mitochondrial Membrane Potential Flow Cytometry Assay Kit and negative control (A,E,I). There was a disruption in the mitochondrial membrane potential of the treated cells (B–D, F–H, and J–L), which emit green fluorescence, while negative control (A,E,I) shows red fluorescence. Images (1; ×40) (2; ×100) are the representative of the cell population observed in the experiments and were captured using a Discover Echo Inc. Revolution Microscope (Discover Echo, San Diego, CA). (Images 1 scale bar: 75 μm and images 2 scale bar: 20 μm).
Figure 3
Figure 3
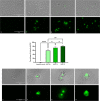
ATP production in percentages relative to the negative control (healthy trophozoites) after 24-h incubation of amoebae with IC90 of the molecules, using the CellTiter-Glo Luminescent Cell Viability Assay. Statistics show a decrease in ATP levels of 98.49% (QOET-59), 90.25% (QOET-72), and 86.28% (QOET-77) compared to the negative control. Differences between values were assessed by the one-way analysis of variance (ANOVA). Data are presented as mean ± SD (N = 3); ns: not significant, **p < 0.01 and ****p < 0.0001 are significant differences when comparing the different mean values.
Figure 4
Figure 4
Evaluation of the integrity of the plasma membrane with the SYTOX Green viability assay. Treated Naegleria fowleri (ATCC 30808) trophozoites with QOET-59 (B and F), QOET-72 (C and G), and QOET-77 (D and H) and negative control (A and E). Treated cells (B–D and F–H) show green fluorescence, and negative control (A and E) shows no fluorescence. Images (1; ×40) (2; x100) are the representative of the cell population observed in the experiments and were captured using a Discover Echo Inc. Revolution Microscope (Discover Echo, San Diego, CA). The bar graph includes the estimated percentage of stained cells. Differences between the values were assessed using the one-way analysis of variance (ANOVA). Data are presented as means ± SD (N = 3); ns: not significant, **p < 0.01; ****p < 0.0001 significant differences when comparing treated cells to negative control. Mean percentage of stained cells for each assays was determined using the Discover Echo Inc. Revolution Microscope software. All the experiments were conducted in triplicate. (Images 1 scale bar: 75 μm and images 2 scale bar: 20 μm).
Figure 5
Figure 5
ROS detection in treated amoebae using CellROX. Naegleria fowleri trophozoites treated with the IC90 of QOET-59 (B and F), QOET-72 (C and G), and QOET-77 (D and H) during 24 h show an intense red fluorescence due to the increase of the intracellular ROS generation. Negative control (A and B). Images (1; ×40) (2; ×100) are representative of the cell population observed in the experiments and were captured using a Discover Echo Inc. Revolution Microscope (Discover Echo, San Diego, CA). The bar graph includes the estimated percentage of stained cells. Differences between the values were assessed using the one-way analysis of variance (ANOVA). Data are presented as means ± SD (N = 3); ns: not significant, *p < 0.1; **p < 0.01; ***p < 0.001; ****p < 0.0001 significant differences when comparing treated cells to negative control. Mean percentage of stained cells for each assays was determined using the Discover Echo Inc. Revolution Microscope software. All the experiments were conducted in triplicate. (Images 1 scale bar: 75 μm and images 2 scale bar: 20 μm).
Figure 6
Figure 6
presence of actin filaments using phalloidin-TRITC. Z-stack imaging of treated amoebae with the IC90 of QOET-59 (B), QOET-72 (C), QOET-77 (D), and negative control (A) showing red (actin filaments) and blue fluorescence (condensed chromatin in the nucleus). Actin filaments (F-actin) in nontreated cells emitted red fluorescence and a normal conformation of the actin network. In treated cells, a decreased level of fluorescence was observed as well as a less organized actin network (B–D) when compared to the negative control (A). Images are representative of the cell population observed in the performed experiments. Images were obtained using a confocal microscope Leica DMI4000 B with LAS X software, a 405 nm laser and 532 nm laser, and Leica HCX PL Apo 63x Oil Objective were used (Scale bar: 20 μm).

References

    1. Visvesvara G. S.; Moura H.; Schuster F. L. Pathogenic and Opportunistic Free-Living Amoebae: Acanthamoeba Spp., Balamuthia mandrillaris, Naegleria fowleri, and Sappinia diploidea. FEMS Immunol. Med. Microbiol. 2007, 50, 1–26. 10.1111/j.1574-695X.2007.00232.x. - DOI - PubMed
    1. Shenoy S.; Wilson G.; Prashanth H. V.; Vidyalakshmi K.; Dhanashree B.; Bharath R. Primary Meningoencephalitis by Naegleria fowleri: First Reported Case from Mangalore, South India. J. Clin. Microbiol. 2002, 40, 309–310. 10.1128/JCM.40.1.309-310.2002. - DOI - PMC - PubMed
    1. Gogate A.; Deodhar L.. Isolation and Identification of Pathogenic Naegleria Fowleri (Aerobia) from a Swimming Pool in Bombay; Transactions of the Royal Society of Tropical Medicine and Hygiene: England, 1985, p 134. - PubMed
    1. Javanmard E.; Niyyati M.; Lorenzo-Morales J.; Lasjerdi Z.; Behniafar H.; Mirjalali H. Molecular Identification of Waterborne Free Living Amoebae (Acanthamoeba, Naegleria and Vermamoeba) Isolated from Municipal Drinking Water and Environmental Sources, Semnan Province, North Half of Iran. Exp Parasitol 2017, 183, 240–244. 10.1016/j.exppara.2017.09.016. - DOI - PubMed
    1. De Jonckheere J. F. Origin and Evolution of the Worldwide Distributed Pathogenic Amoeboflagellate Naegleria fowleri. Infection, Genetics and Evolution 2011, 11, 1520–1528. 10.1016/j.meegid.2011.07.023. - DOI - PubMed

Publication types