. 2023 May 25;186(11):2345-2360.e16.
doi: 10.1016/j.cell.2023.04.017. Epub 2023 May 10.

Mechanisms of skin vascular maturation and maintenance captured by longitudinal imaging of live mice

Affiliations

Mechanisms of skin vascular maturation and maintenance captured by longitudinal imaging of live mice

Chen Yuan Kam et al. Cell. .

Abstract

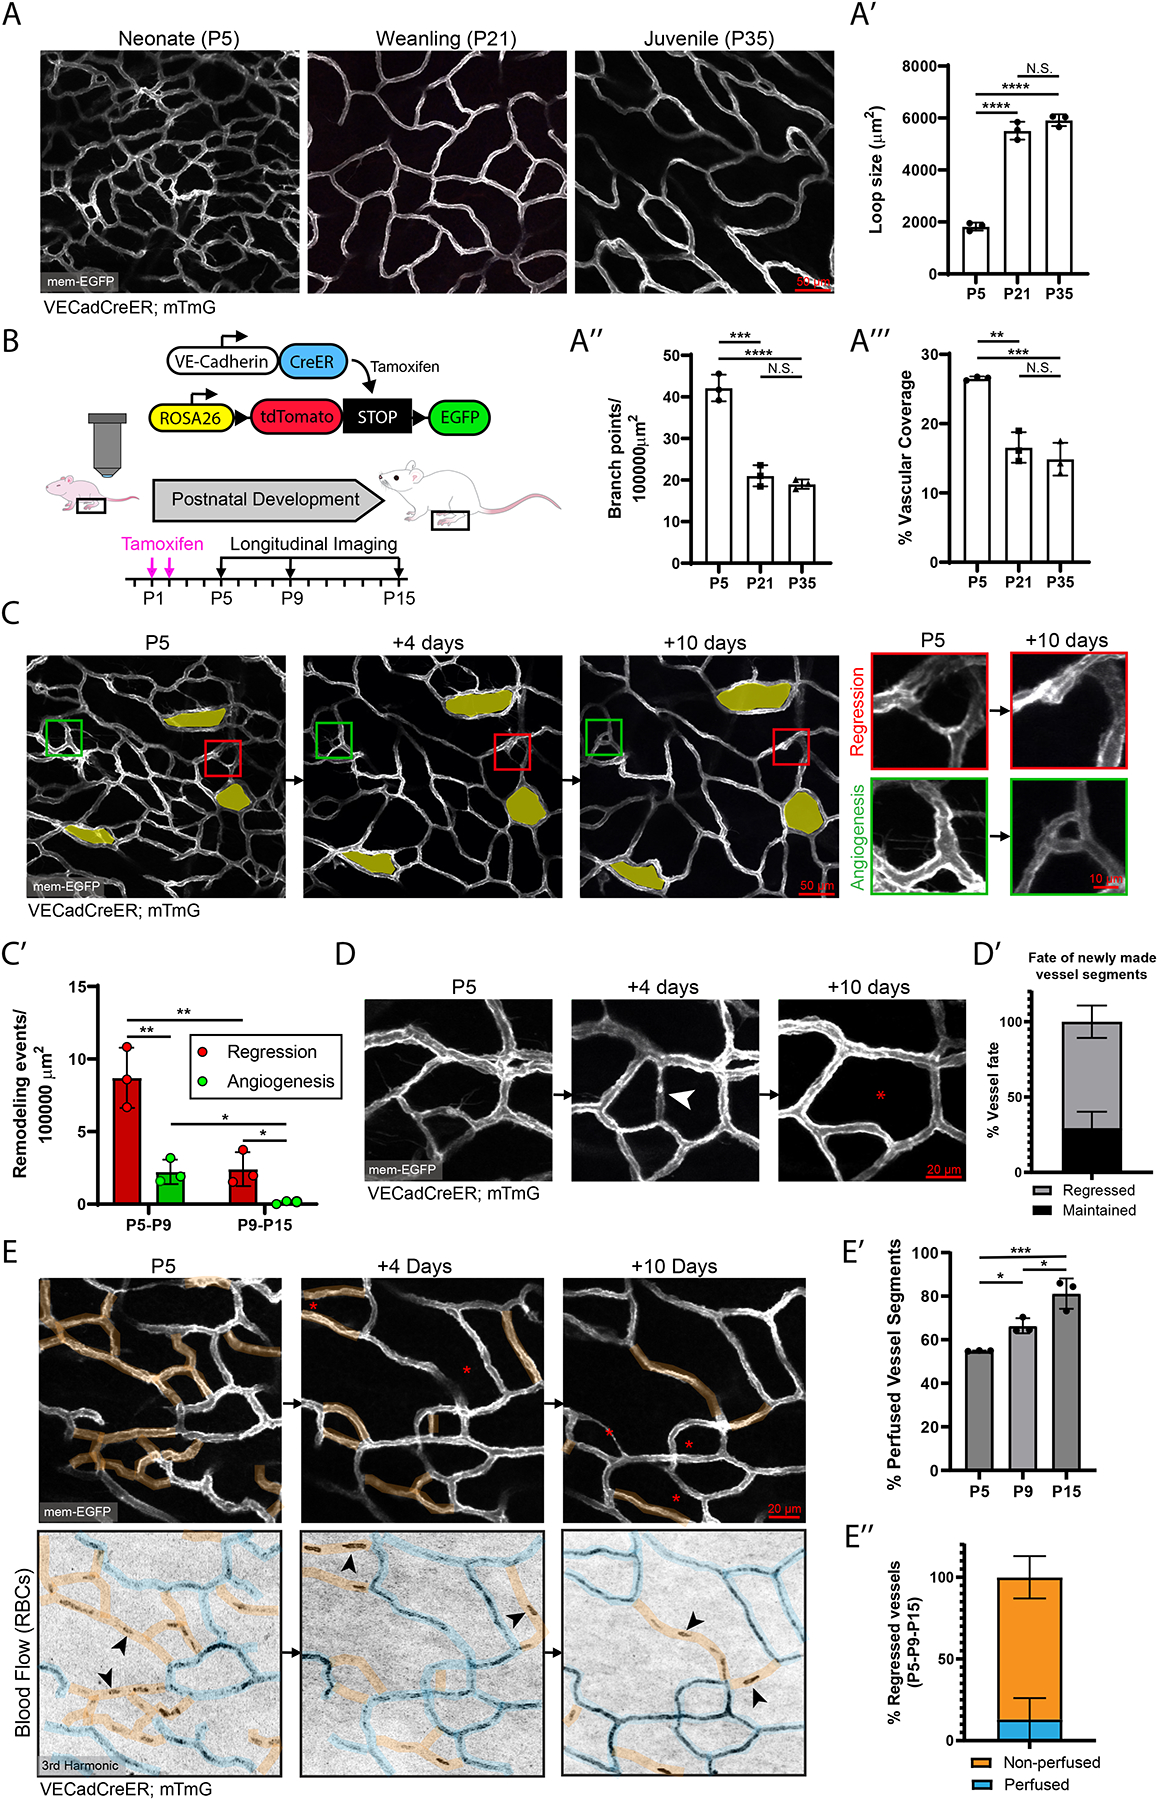
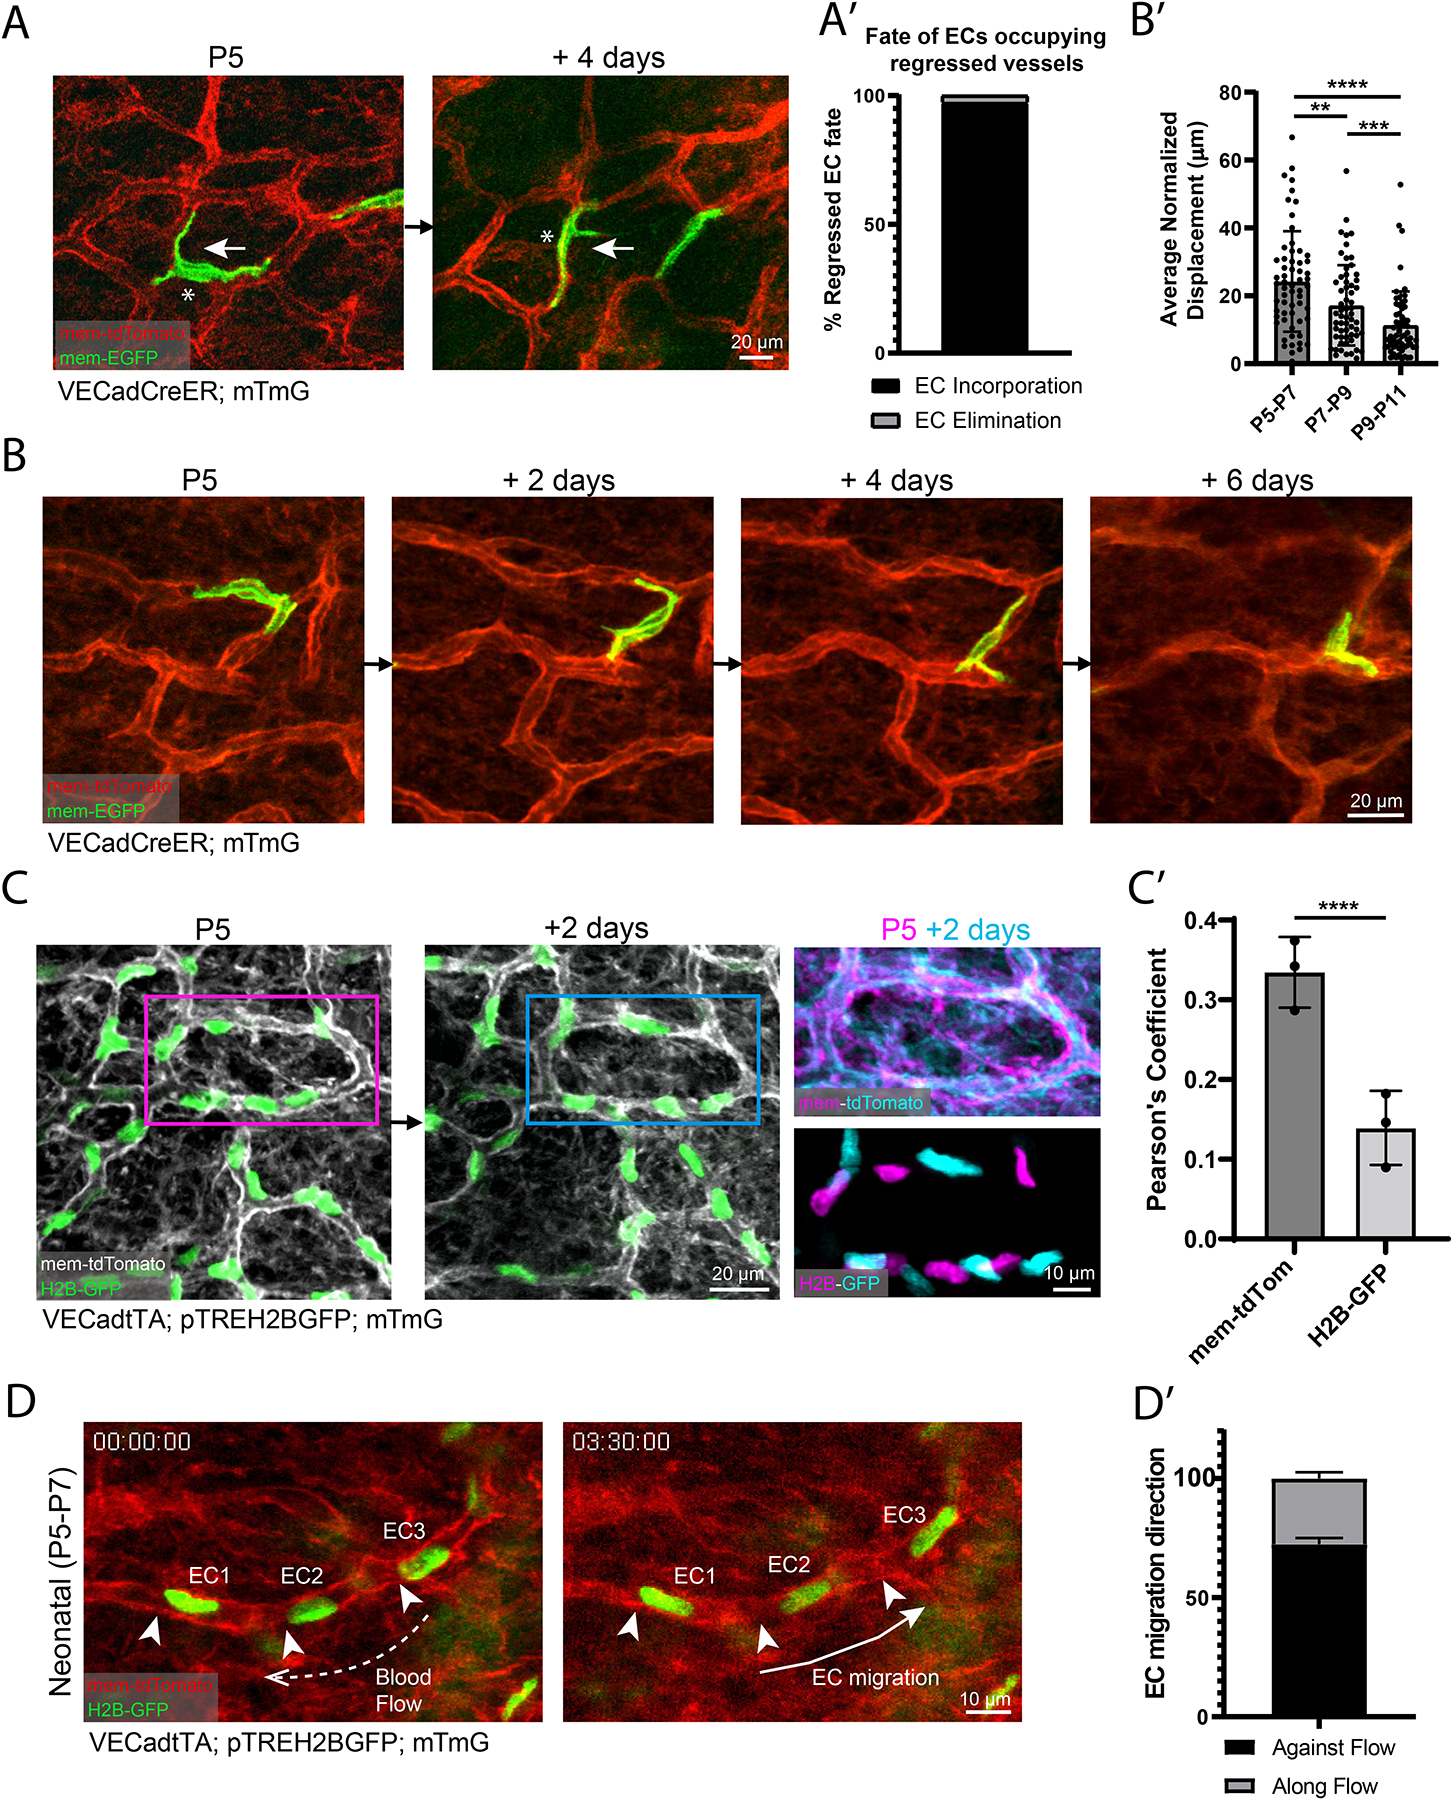
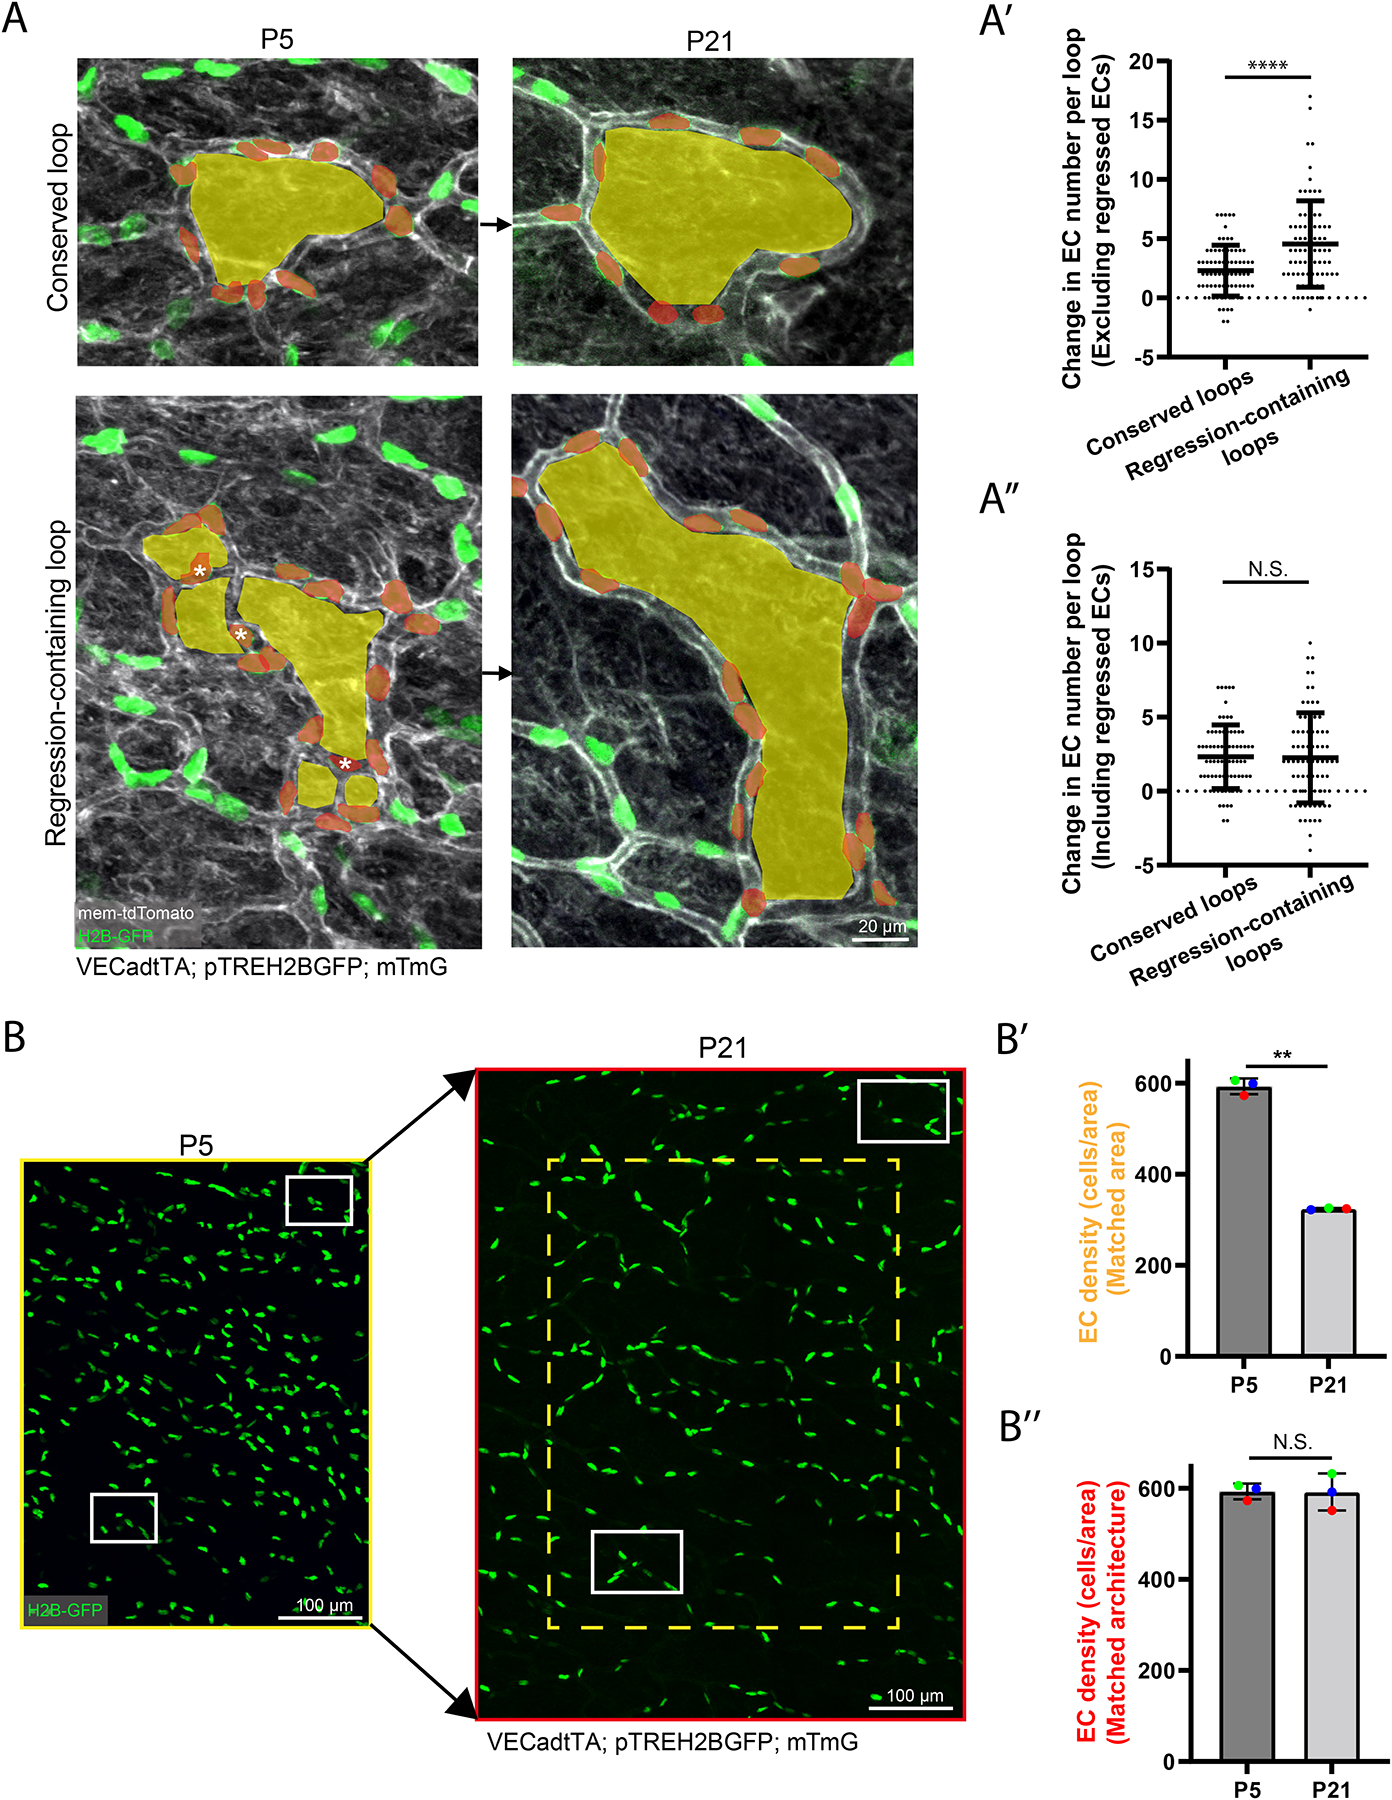
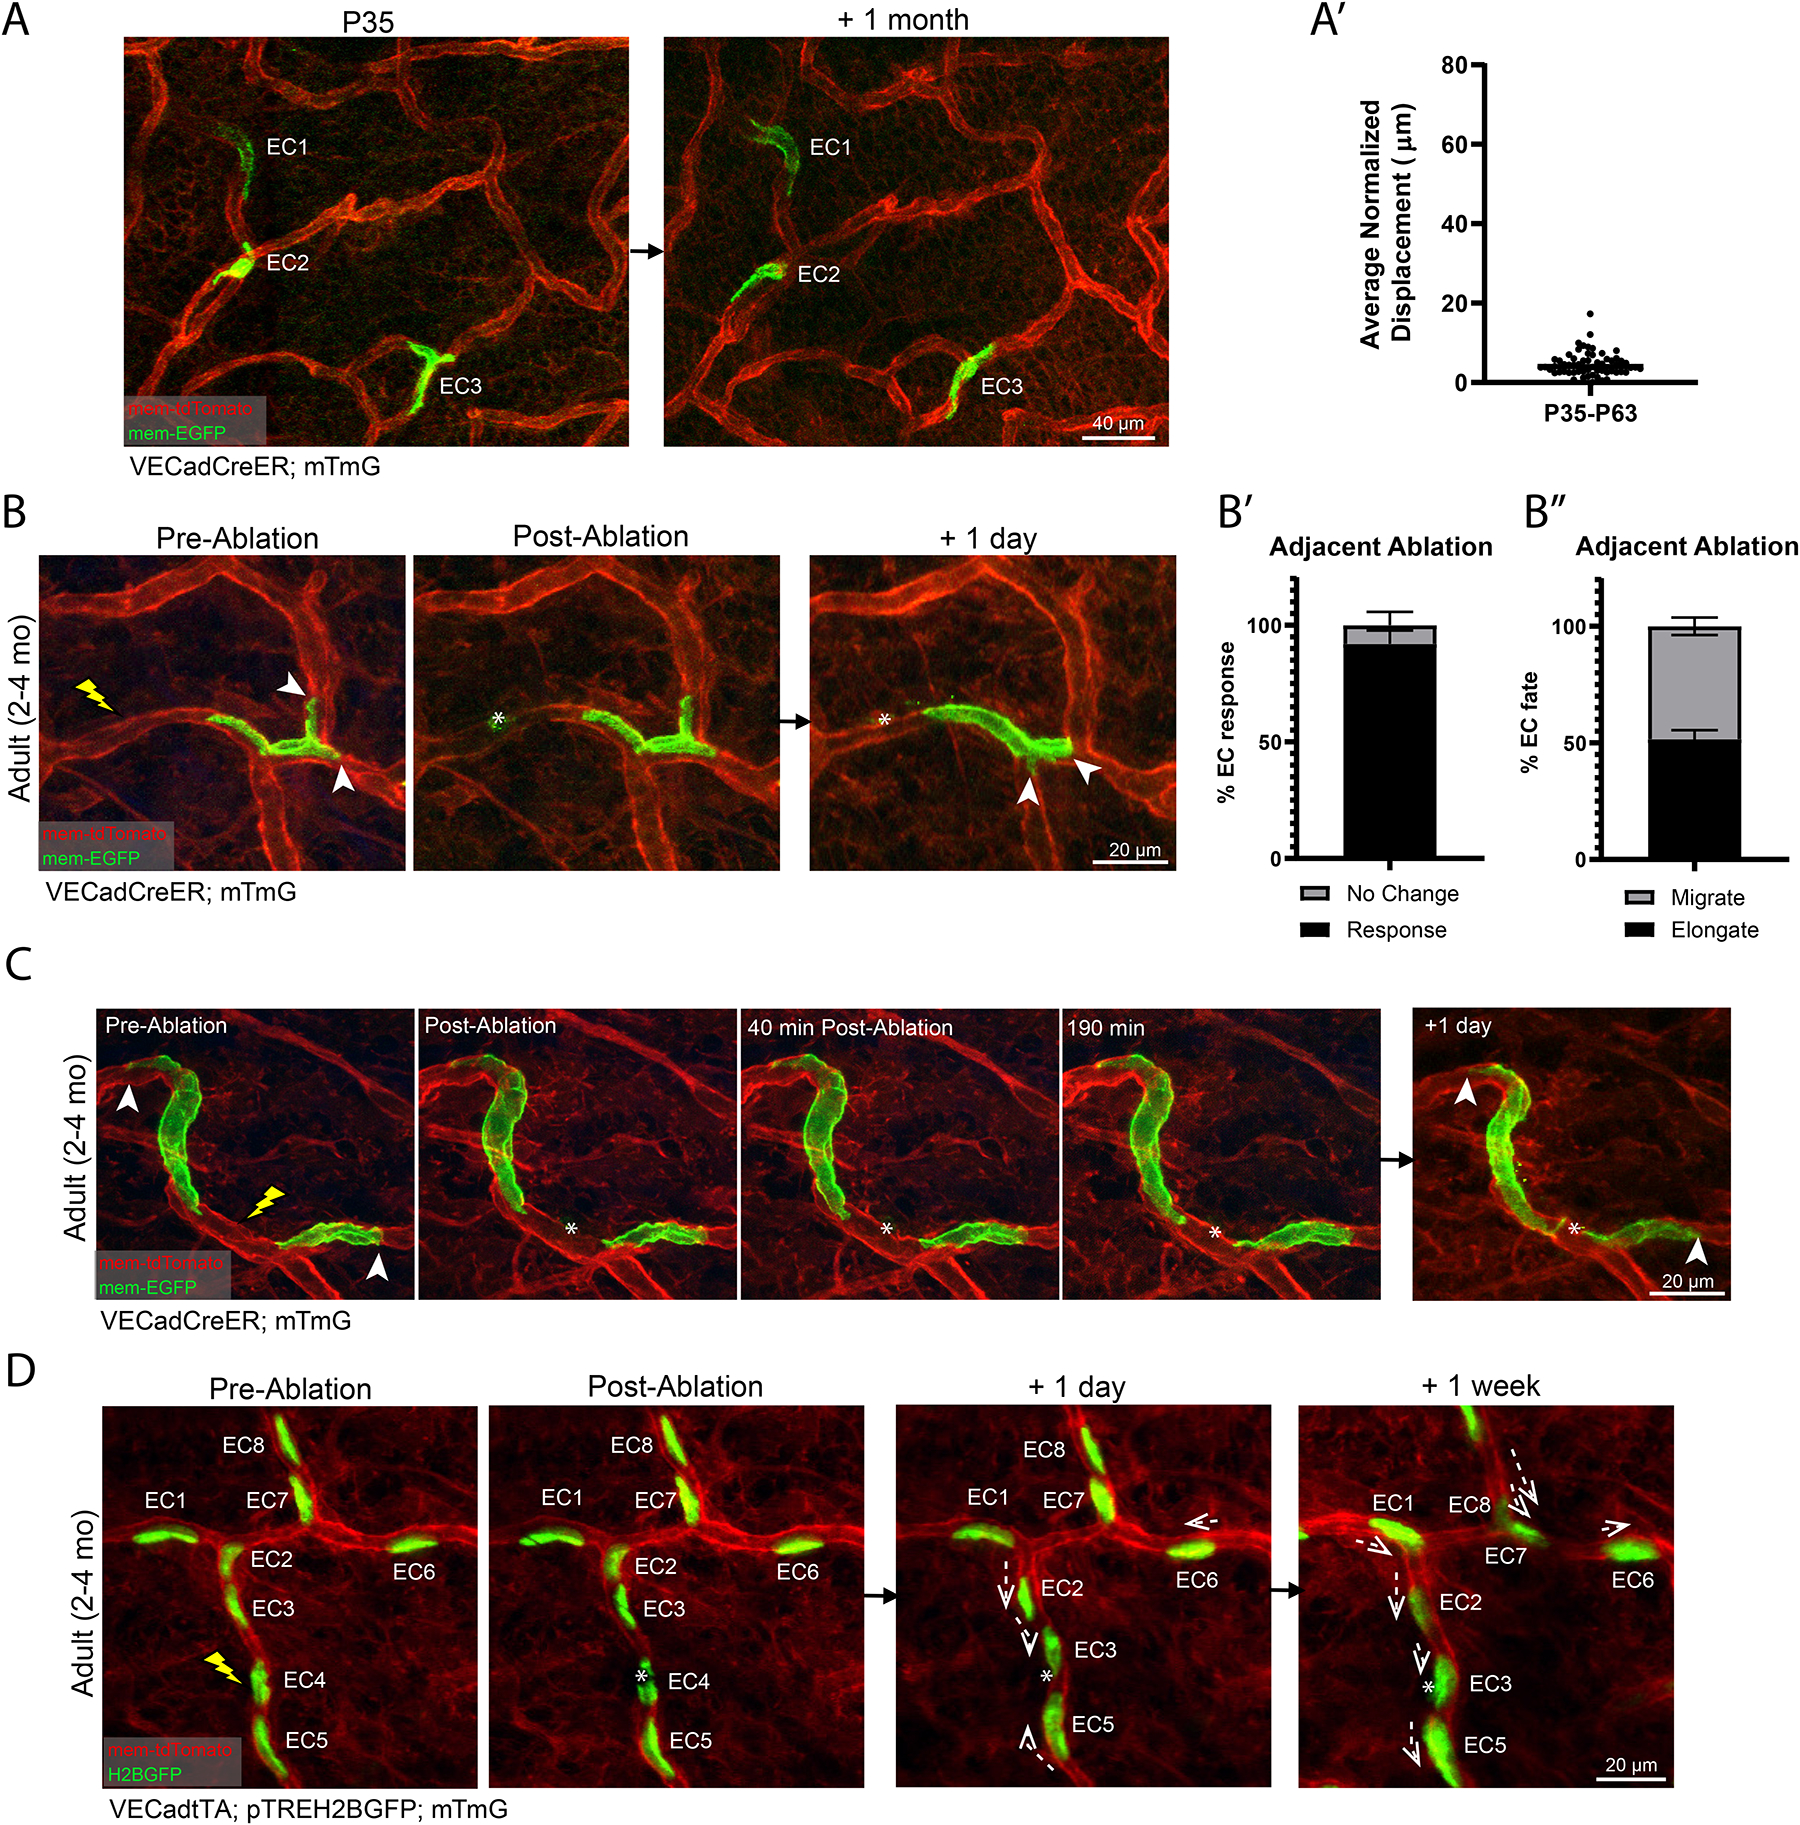
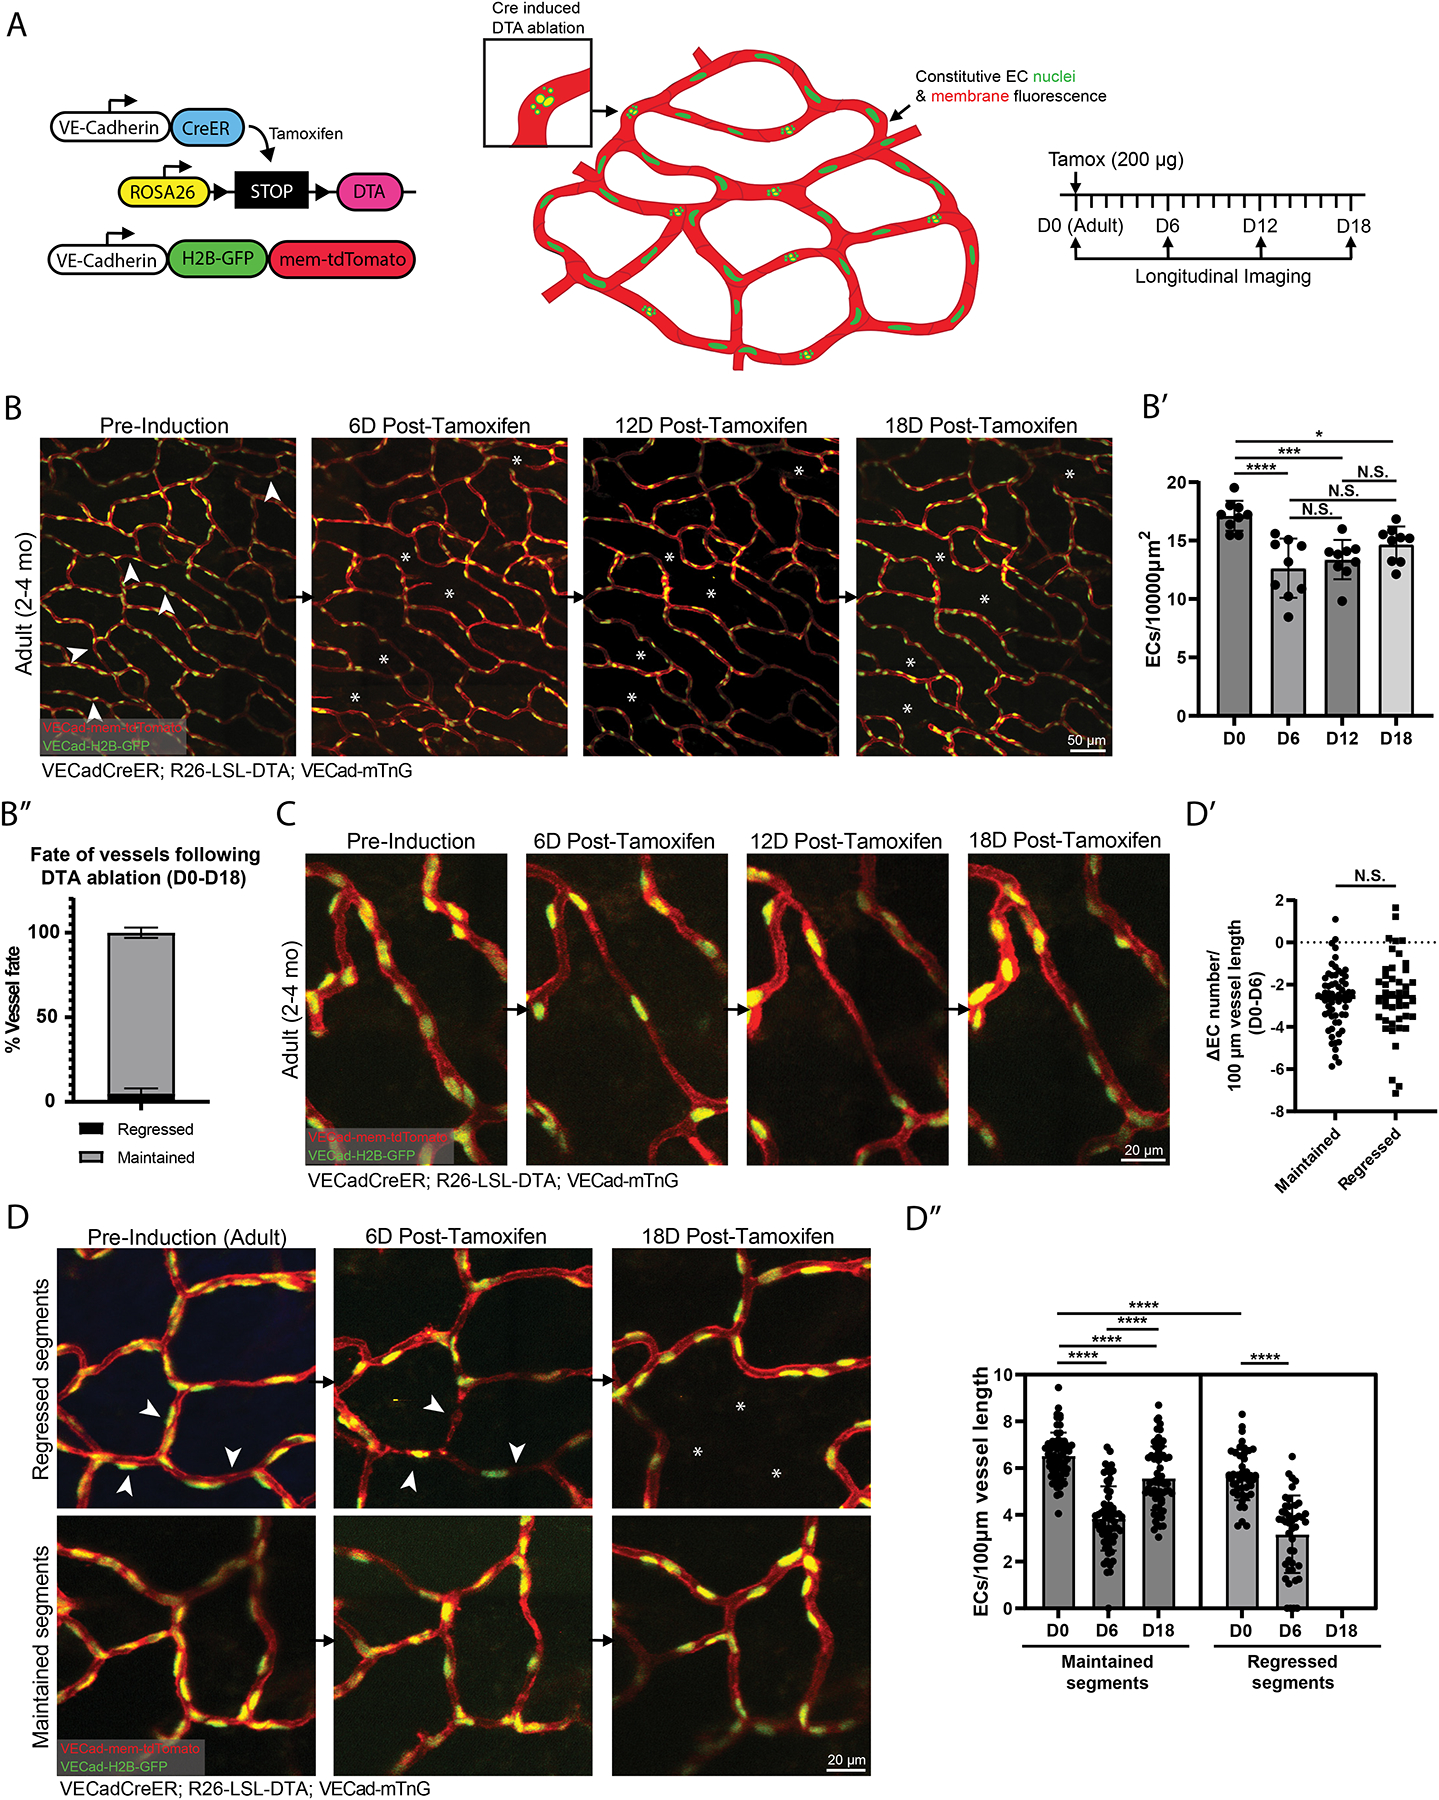
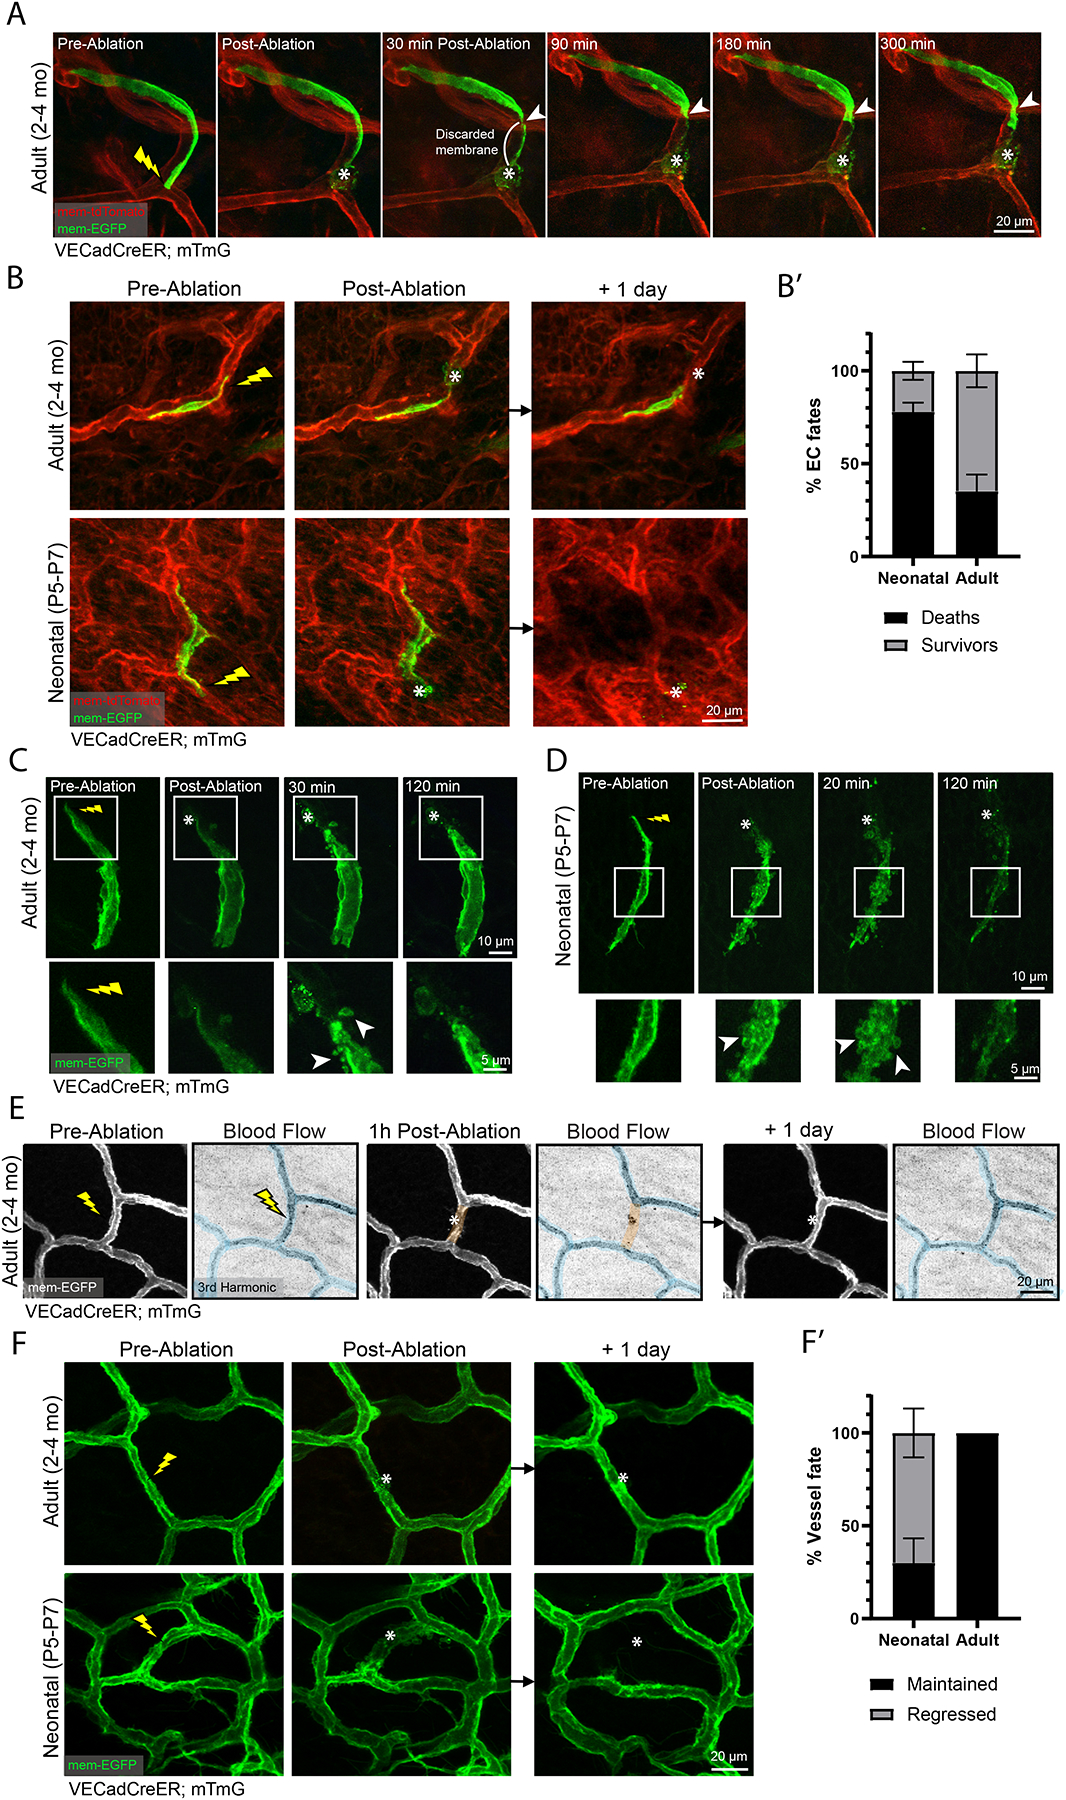
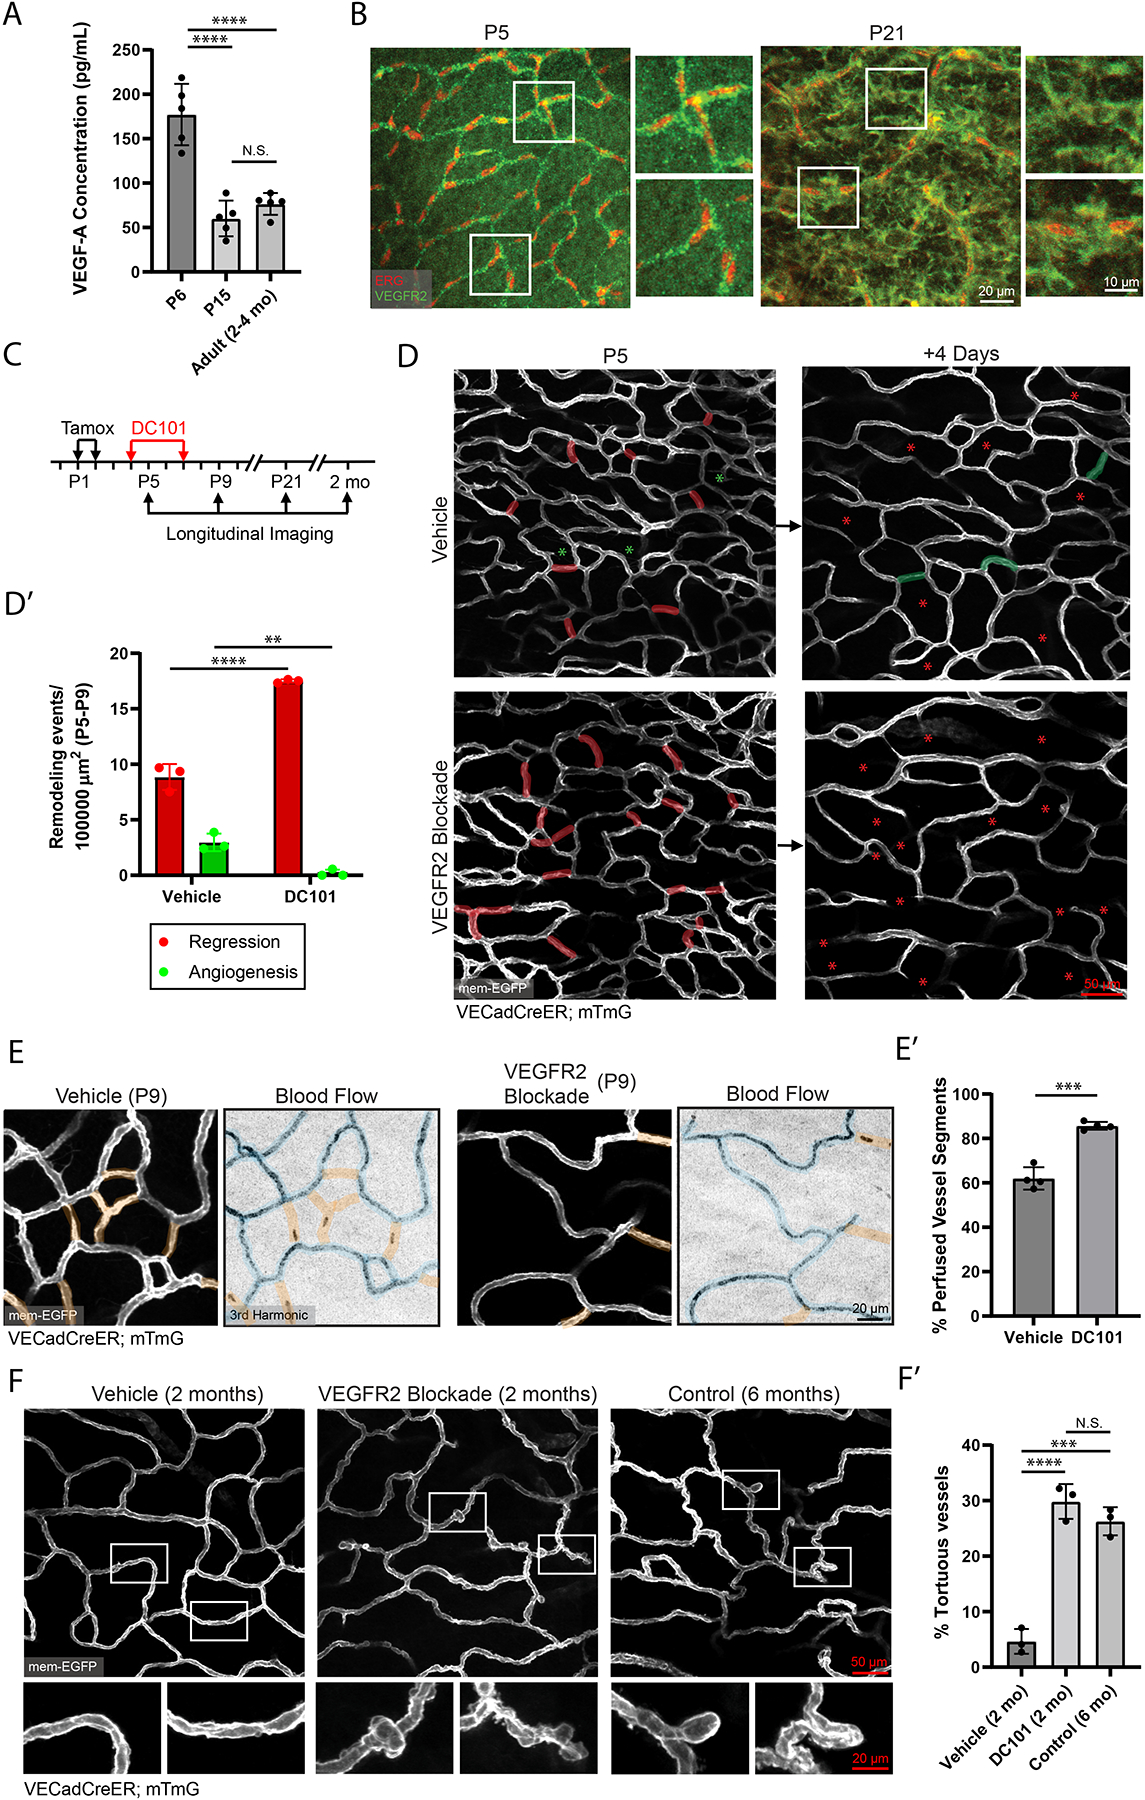
A functional network of blood vessels is essential for organ growth and homeostasis, yet how the vasculature matures and maintains homeostasis remains elusive in live mice. By longitudinally tracking the same neonatal endothelial cells (ECs) over days to weeks, we found that capillary plexus expansion is driven by vessel regression to optimize network perfusion. Neonatal ECs rearrange positions to evenly distribute throughout the developing plexus and become positionally stable in adulthood. Upon local ablation, adult ECs survive through a plasmalemmal self-repair response, while neonatal ECs are predisposed to die. Furthermore, adult ECs reactivate migration to assist vessel repair. Global ablation reveals coordinated maintenance of the adult vascular architecture that allows for eventual network recovery. Lastly, neonatal remodeling and adult maintenance of the skin vascular plexus are orchestrated by temporally restricted, neonatal VEGFR2 signaling. Our work sheds light on fundamental mechanisms that underlie both vascular maturation and adult homeostasis in vivo.

Keywords: angiogenesis; blood flow; capillary; endothelial cell; live imaging; neonatal development; skin; vascular homeostasis; vascular repair; vessel regression.


Conflict of interest statement

Declaration of interests The authors declare no competing financial interests.

Figures

Figure 1.
Figure 1.. Vessel regression drives maturation of the capillary network to optimize network perfusion.
(A) Static comparison of the capillary plexus of P5, P21, and P35 skin of VECadCreER; mTmG mice. (A’, A” & A’”) Quantification of capillary loop size (μm2), branching points, and % vascular coverage (n=3 mice). **, P<0.01; ***, P<0.001; ****, P<0.0001 by one-way ANOVA followed by Tukey’s MCT. (B) Schematic of the VECadCreER; mTmG reporter and longitudinal imaging workflow. (C) Longitudinal tracking of the capillary plexus at P5, P9 and P15. The same loops are pseudocolored in yellow. Example of regression (red inset) and angiogenesis events (Green inset). (C’) Quantification of overall vessel remodeling from P5-P9 and P9-P15 (n=3 mice). *, P<0.05; **, P<0.01 by unpaired Student’s t-test. (D) Tracking of vessels angiogenesis (white arrowhead) at P5-P9 revisited at P15. (D’) Quantification of the fate of angiogenesis events during P5-P9 revisited at P15 (n=38 events from 3 mice). (E) Tracking of vessel remodeling (top panel) and network perfusion (bottom panel) at P5, P9, and P15. Perfused segments are pseudocolored blue; non-perfused segments are pseudocolored orange. Red asterisks denote regressed segments. Black arrowheads show examples of stalled RBCs. (E’) Quantification of the percentage of perfused vessels at P5, P9, and P15 (n=3 mice). *, P<0.05; ***, P<0.001; ****, by one-way ANOVA followed by Tukey’s MCT. (E”) Quantification of perfusion status of regressed vessels tracked from P5-P9-P15 (n=80 events from 3 mice). For all bar graphs error bars are mean ± standard deviation.
Figure 2.
Figure 2.. Neonatal ECs participate in plexus-wide positional rearrangement and execute vessel regression via migration.
(A) Tracking of single ECs undergoing vessel regression (white asterisk). White arrow depicts migration direction. (A’) Quantification of regressed EC fate (n=38 cells from 5 mice). (B) 2-day revisits of an EC migrating within existing vessel architecture. (B’) Quantification of EC migration in 2-day intervals from P5-P11(n=60 cells from 3 mice). **, P<0.01; ***, P<0.001; ****, P<0.0001 by one-way ANOVA followed by Tukey’s post-hoc test. (C) P5 to P7 revisit of EC nuclear reporter (VECadtTA; pTREH2BGFP; mTmG). Overlay of P5 EC positions (magenta) compared to P7(cyan) indicates EC positional change. (C’) Quantification of the Pearson’s correlation coefficient between membrane signal compared to nuclear signal of P5 vs P7 vessels (n=3 mice). ****, P<0.0001 by unpaired Student’s t-test. (D) Time-lapse imaging of EC nuclei (numbered) migration in neonatal vessels. White arrowheads indicate initial EC positions, dotted arrow denotes direction of blood flow, and solid arrow indicates EC migration direction. (D’) Quantification of EC migration polarization direction (n=86 ECs from 3 mice). For all bar graphs error bars are mean ± standard deviation.
Figure 3.
Figure 3.. Cellular density in the developing plexus is locally controlled by the incorporation of ECs from regressed segments.
(A) Comparison of changes in EC number in conserved and regression-containing loops tracked from P5 to P21 in VECadtTA; pTREH2BGFP; mTmG mice. Examples of conserved loops (top panel) and regression-containing loops (bottom panel) with pseudocolored loops (yellow) and nuclei within loops of interest (red). ECs within regressed vessels are marked with white asterisks. (A’) Quantification of the change in EC number between conserved loops and regression-containing loops excluding regressed ECs (white asterisks) or (A”) including regressed ECs (n=150 capillary loops from 3 mice). ****, P<0.0001 by unpaired Student’s t-test. (B) Tracking of EC nuclei within the same vascular architecture in P5 and P21 mice. White boxes indicate matching regions of revisits. (B’) Quantification of EC density normalized to area Yellow box indicates matched P5 area (250000 μm2) in the P21 plexus (n=3 mice). (B”) Quantification of EC density matched to conserved vessel architecture. Red outline indicates matched P5 architecture at P21 (460000 μm2) (n=3 mice). **, P<0.01 by unpaired Student’s t-test. For all graphs error bars are mean ± standard deviation.
Figure 4.
Figure 4.. ECs become positionally stable in adulthood but coordinate neighborhood rearrangement in response to local ablation.
(A) Single ECs (numbered) in VECadCreER; mTmG mice at P35 longitudinally tracked over 1-month. (A’) Quantification of EC migration from P35 to P63 (n=60 cells from 3 mice). (B) Adult vessel (2–4 months) inflicted with targeted laser ablation adjacent to single labeled ECs followed by 1-day revisit. (B’) The vast majority (>90%) of all labeled cells respond to adjacent laser ablation. (B”) ECs adjacent to an ablation respond by migrating or elongating with approximately equal probability (n=180 cells from 3 mice). (C) Time-lapse of a laser ablation targeted in between two labeled ECs followed by 24 h revisit. (D) Tracking of EC nuclei (numbered) inflicted with laser ablation followed by 24 h and 1 week revisits (n=3 mice). Dotted arrows indicate migration direction. For all images, lightning bolt denotes the sites targeted for ablation; white arrowheads denote sites of anchorage; white asterisks denote the ablated region. For all bar graphs error bars are mean ± standard deviation.
Figure 5.
Figure 5.. Network-wide ablation of adult ECs reveals the coordinated maintenance of plexus architecture by surviving ECs.
(A) Schematic of the VECadCreER; R26-LSL-DTA; VECad-mTnG model and imaging workflow. (B) Tracking of EC network at pre-induction, 6-, 12-, and 18-days post-tamoxifen induction. (B’) Quantification of EC density tracked at pre-induction, 6-, 12-, and 18-days post-tamoxifen induction (n=3 mice). **, P<0.01; ***, P<0.001; ****, P<0.0001 by one-way ANOVA followed by Tukey’s MCT. (B”) Quantification of vessel fate from pre-induction to 18-days post-tamoxifen (n= 830 vessels from 3 mice). (C) Example of vessel recovery following DTA ablation. (D) (Top panel) Vessel segments that underwent regression at pre-induction, 6-, and 18-days post tamoxifen induction. (Bottom panel) Vessel segments that were maintained at the corresponding time-points. (D’) Quantification of the change in EC number per 100 μm vessel length within maintained versus regressed segments from pre-induction to 6-days post-tamoxifen induction. N.S, not significant by unpaired Student’s t-test. (D”) Quantification of EC number per 100 μm vessel length within maintained versus regressed vessel segments from pre-induction, 6-, and 18-days post-tamoxifen induction (n=63 maintained and 44 regressed vessels from 3 mice). P<0.001; ****, by one-way ANOVA followed by Tukey’s MCT for maintained segments. ****, P<0.0001 by unpaired Student’s t-test for regressed segments (pre-induction vs 6-days post-tamoxifen) and maintained vs regressed segments (pre-induction). For all images, white arrowheads indicate vessels fated for regression and white asterisks denote the location of vessels that were regressed. For all graphs error bars are mean ± standard deviation.
Figure 6.
Figure 6.. Adult but not neonatal ECs preferentially activate a plasmalemmal self-repair mechanism to survive injury and preserve the vascular architecture.
(A) Time-lapse of a labeled EC (VECadCreER; mTmG) inflicted with laser damage. White arrowhead denotes site of excision (n=4 mice). (B) (Top panel) Adult EC induced with laser ablation followed by 1-day revisit. (Bottom panel) A neonatal EC inflicted with laser ablation followed by 1-day revisit. (B’) Quantification of neonatal versus adult EC fates 1-day post laser ablation (n=60 neonatal cells; n=84 adult cells from 3 mice respectively). (C) Time-lapse of a labeled adult EC inflicted with laser ablation (inset; white arrowheads denote localized membrane blebs) (n=3 mice). (D) Time-lapse of a labeled neonatal EC inflicted with laser ablation (inset; white arrowheads denote membrane blebbing) (n=3 mice). (E) Tracking of blood flow status of an adult vessel 1-hour and 1-day post-laser ablation. Perfused segments are pseudocolored blue; non-perfused segments are pseudocolored orange (n=3 mice). (F) Tracking of adult (top panel) and neonatal (bottom panel) vessel fate 1-day post ablation. (F’) Quantification of vessel fates 1-day post-ablation (n=88 neonatal vessels; n=99 adult vessels from 3 mice respectively). For all images, lightning bolt denotes the site of laser ablation; white asterisks denote the ablation site. For all bar graphs error bars are mean ± standard deviation.
Figure 7.
Figure 7.. Neonatal vessel regression, optimization of network perfusion, and adult maintenance are orchestrated by neonatal VEGFR2 signaling.
(A) VEGF-A ELISA carried out on samples generated from P6, P15 and adult mouse paw skin (n=5 mice per condition). ****, P<0.0001 by one-way ANOVA followed by Tukey’s MCT. (B) Whole-mount immunostaining of VEGFR2 (green) and ERG (red) in P5 and P21 mouse skin. (C) Schematic of DC101 administration and longitudinal imaging workflow. (D) Longitudinal imaging of vehicle (PBS) versus DC101 treated mice from P5 to P9. Regressed vessels are pseudocolored in red at P5 and red asterisks at P9. New vessels from angiogenesis are pseudocolored in green at P9 with green asterisks at P5. (D’) Quantification of P5-P9 vessel remodeling in vehicle versus DC101 treated mice (n=3 mice). **, P<0.01; ****, P<0.0001 by unpaired Student’s t-test. (E) Comparison of network perfusion between vehicle and DC101 treated animals at P9. Perfused segments are pseudocolored blue; non-perfused segments are pseudocolored orange. (E’) Quantification of the percentage of perfused vessels in vehicle versus DC101 treated animals (n=470 vessels from vehicle and 341 vessels from DC101 treated animals across 4 mice). ***, P<0.001 by unpaired Student’s t-test. (F) Comparison of the vascular plexus of 2-month old vehicle-, 2-month old DC101-treated, and 6-month old control mice. (F’) Quantification of the percentage of vessels exhibiting tortuous morphology in 2-month old vehicle-, 2-month old DC101-treated and 6-month old control mice (n=3 mice). ***, P<0.001; ****, P<0.0001 by one-way ANOVA followed by Tukey’s MCT. For all bar graphs error bars are mean ± standard deviation.

References

    1. Augustin HG, and Koh GY (2017). Organotypic vasculature: From descriptive heterogeneity to functional pathophysiology. Science 357. 10.1126/science.aal2379. - DOI - PubMed
    1. Swift MR, and Weinstein BM (2009). Arterial-venous specification during development. Circ Res 104, 576–588. 10.1161/circresaha.108.188805. - DOI - PubMed
    1. Rocha SF, and Adams RH (2009). Molecular differentiation and specialization of vascular beds. Angiogenesis 12, 139–147. 10.1007/s10456-009-9132-x. - DOI - PubMed
    1. Ellis CG, Jagger J, and Sharpe M (2005). The microcirculation as a functional system. Crit Care 9 Suppl 4, S3–8. 10.1186/cc3751. - DOI - PMC - PubMed
    1. Herbert SP, and Stainier DY (2011). Molecular control of endothelial cell behaviour during blood vessel morphogenesis. Nat Rev Mol Cell Biol 12, 551–564. 10.1038/nrm3176. - DOI - PMC - PubMed

Publication types

LinkOut - more resources