. 2023 Apr 15;13(4):1387-1406.
eCollection 2023.

Metabolic genes, a potential predictor of prognosis and immunogenicity of clear cell renal cell carcinoma

Affiliations

Metabolic genes, a potential predictor of prognosis and immunogenicity of clear cell renal cell carcinoma

Cheng-Jian Ji et al. Am J Cancer Res. .

Abstract

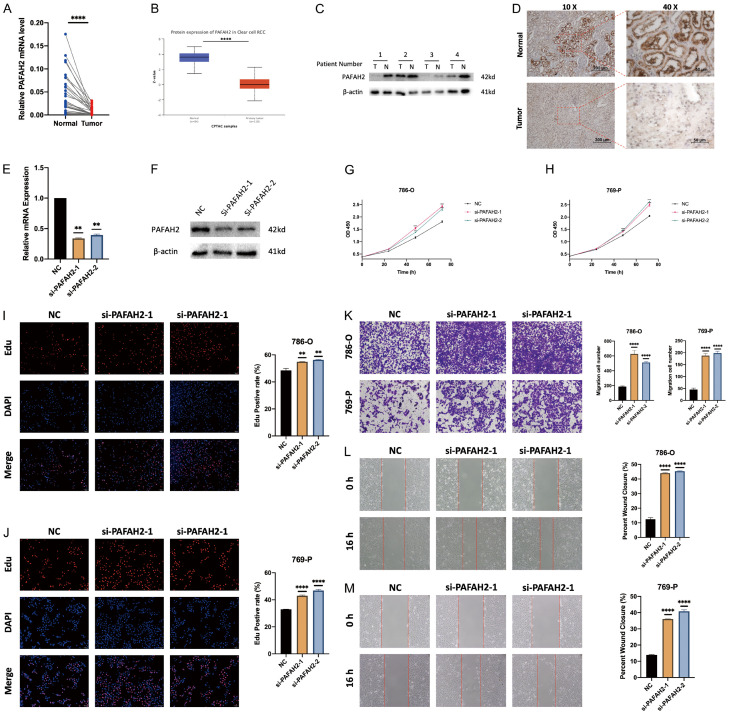
Clear cell renal cell carcinoma (ccRCC) is the most common subtype of renal cell carcinoma (RCC). Many ccRCCs are diagnosed at an advanced stage due to the lack of early symptoms, with a high mortality rate and a poor prognosis. The occurrence and development of ccRCC are closely related to metabolic disorders. This study aims to explore the relationship between metabolic genes and prognosis, immune microenvironment, and tumor development of ccRCC. Using data from TCGA, GEO, and ArrayExpress, we successfully established a risk model (riskScore) based on 4 metabolic genes (MGs) that can accurately predict the prognosis and immune microenvironment of ccRCCs. In addition, we determined the role of PAFAH2 in suppressing tumor cell proliferation and migration in ccRCC in vitro. Our research may shed new light on ccRCC patients' prognosis and treatment management.

Keywords: Metabolic genes; PAFAH2; TME; ccRCC; prognosis.


Conflict of interest statement

None.

Figures

Figure 1
Figure 1
Prognostic analysis of the prognostic model in entire cohort. A. Kaplan-Meier curve analysis of the high-risk and low-risk groups. B. DCA analysis of different variables in the TCGA cohort. C. ROC curve analysis of different variables in the TCGA cohort at three years. D. ROC curve analysis of different variables in the TCGA cohort at five years. E. ROC curve analysis of different variables in the TCGA cohort at ten years. F. Risk score distribution of patients in the prognostic model. G. Survival status scatter plots for patients in the prognostic model. H. Expression patterns of risk genes in the prognostic model.
Figure 2
Figure 2
Prognostic analysis of the prognostic model in ArrayExpress cohort. A. Kaplan-Meier curve analysis of the high-risk and low-risk groups. B. Time-dependent ROC curve analysis of the prognostic model. C. Kaplan-Meier survival curve analysis in the high P4HA3 expression group and low P4HA3 expression group. D. Kaplan-Meier survival curve analysis in the high ETNK2 expression group and low ETNK2 expression group. E. Kaplan-Meier survival curve analysis in the high PAFAH2 expression group and low PAFAH2 expression group. F. Kaplan-Meier survival curve analysis in the high ALAD expression group and low ALAD expression group.
Figure 3
Figure 3
Relationships of the variables in the model with the clinical characteristics of patients in the TCGA cohort. A. riskScore and clinical variables. B. Expression of risk genes and age. C. Expression of risk genes and gender. D. Expression of risk genes and grade. E. Expression of risk genes and stage. F. Expression of risk genes and T. G. Expression of risk genes and M. H. Expression of risk genes and N. Abbreviations: *, P < 0.05; **, P < 0.01; ***, P < 0.001.
Figure 4
Figure 4
Nomogram for the predictions of prognosis at one, three, and five years in the TCGA cohort. A. Nomogram for OS. B. Concordance index of the prognostic predictions. C. Calibration curves at 1, 3, and 5 years.
Figure 5
Figure 5
Function enrichment analysis and exploration of immune landscape. A. GO enrichment analysis of genes that are differentially expressed between high-risk and low-risk groups. B. Gene-set enrichment analysis in high-risk group. C. Gene-set enrichment analysis in low-risk group. D. Differences in ssGSEA scores of immune cells and immune function between high-risk and low-risk groups. E. Differences in somatic mutation between high-risk and low-risk groups. F. Differences in immune cell infiltration between high-risk and low-risk groups. G. Immune infiltrating cells significantly correlated with riskScore. H. Differences in TIDE scores between high-risk and low-risk groups. Abbreviations: *, P < 0.05; **, P < 0.01; ***, P < 0.001; ****, P < 0.0001.
Figure 6
Figure 6
PAFAH2 is lowly expressed in ccRCC and can inhibit the proliferation and migration of ccRCC cells. (A) Relative mRNA expression levels of PAFAH2 in ccRCC tissues (32 pairs). (B) Protein expression levels of PAFAH2 in ccRCC tissues (CPTAC database). (C) Protein expression levels of PAFAH2 in 4 ccRCC tissues (Western Blot). (D) IHC staining of PAFAH2 protein in ccRCC patient tumors and matched paracancerous tissues. (E, F) The effect of PAFAH2 siRNAs in 786-O cells was assessed by qRT-PCR (E) and Western Blot (F). (G, H) CCK-8 assays showed that knockdown of PAFAH2 levels increased the proliferation of ccRCC cells (G: 786-O, H: 769-P). (I, J) EDU assays suggested that knockdown of PAFAH2 levels increased the proliferation of ccRCC cells (I: 786-O, J: 769-P). (K) Transwell assays indicated that knockdown of PAFAH2 levels increased the migratory ability of ccRCC cells. (L, M) Wound healing assays showed that ccRCC cells with low levels of PAFAH2 moved more rapidly (L: 786-O, M: 769-P). Abbreviations: *, P < 0.05; **, P < 0.01; ***, P < 0.001; ****, P < 0.0001.

References

    1. Siegel RL, Miller KD, Jemal A. Cancer statistics, 2019. CA Cancer J Clin. 2019;69:7–34. - PubMed
    1. Hakimi AA, Voss MH, Kuo F, Sanchez A, Liu M, Nixon BG, Vuong L, Ostrovnaya I, Chen YB, Reuter V, Riaz N, Cheng Y, Patel P, Marker M, Reising A, Li MO, Chan TA, Motzer RJ. Transcriptomic profiling of the tumor microenvironment reveals distinct subgroups of clear cell renal cell cancer: data from a randomized phase III trial. Cancer Discov. 2019;9:510–525. - PMC - PubMed
    1. Rossi SH, Klatte T, Usher-Smith J, Stewart GD. Epidemiology and screening for renal cancer. World J Urol. 2018;36:1341–1353. - PMC - PubMed
    1. Choueiri TK, Motzer RJ. Systemic therapy for metastatic renal-cell carcinoma. N Engl J Med. 2017;376:354–366. - PubMed
    1. Capitanio U, Montorsi F. Renal cancer. Lancet. 2016;387:894–906. - PubMed

LinkOut - more resources