. 2023 Apr 11;26(5):106610.
doi: 10.1016/j.isci.2023.106610. eCollection 2023 May 19.

DEcancer: Machine learning framework tailored to liquid biopsy based cancer detection and biomarker signature selection

Affiliations

DEcancer: Machine learning framework tailored to liquid biopsy based cancer detection and biomarker signature selection

Andreas Halner et al. iScience. .

Abstract

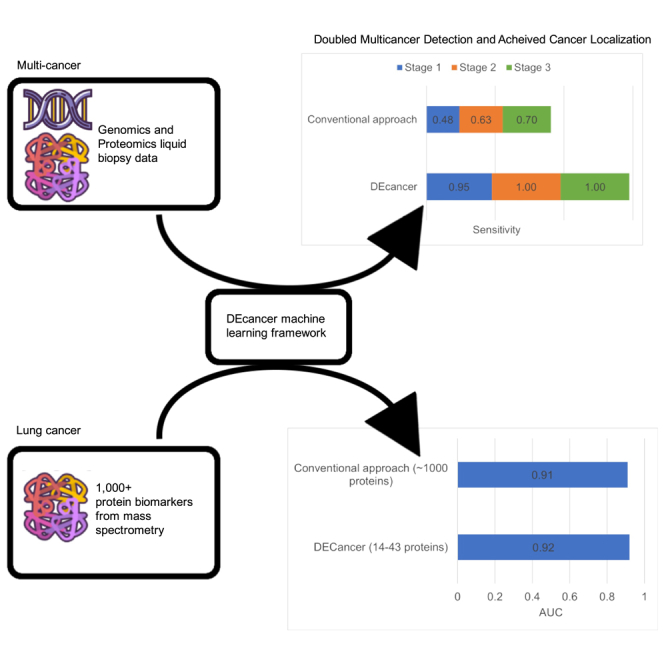
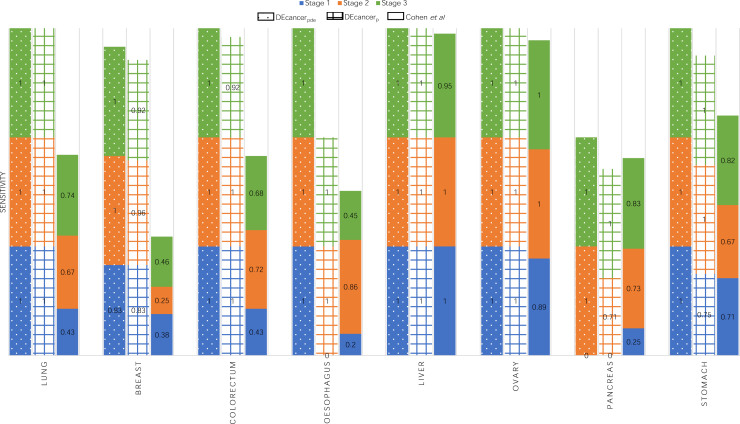
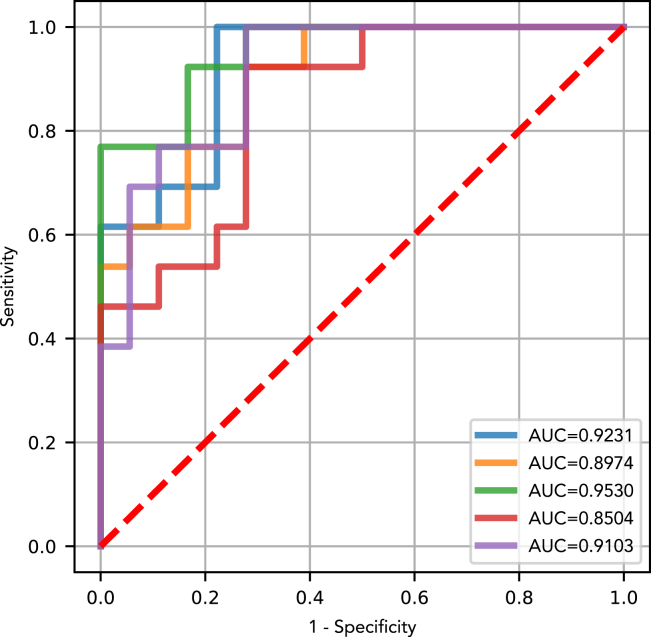
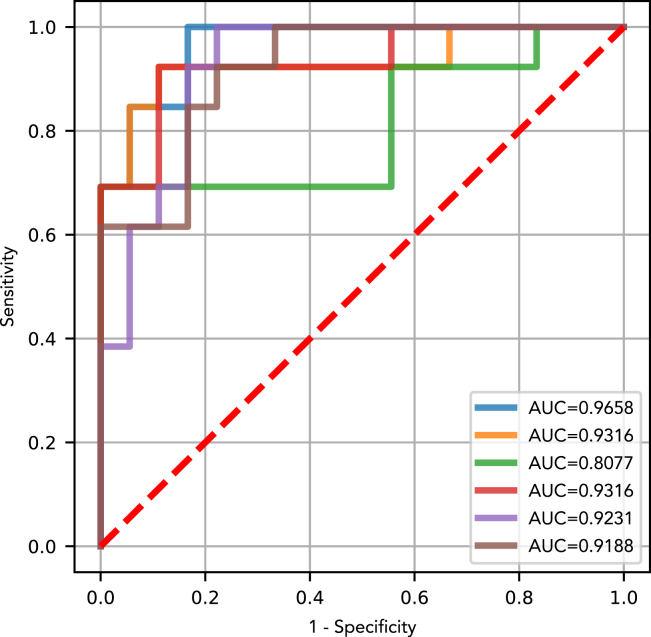
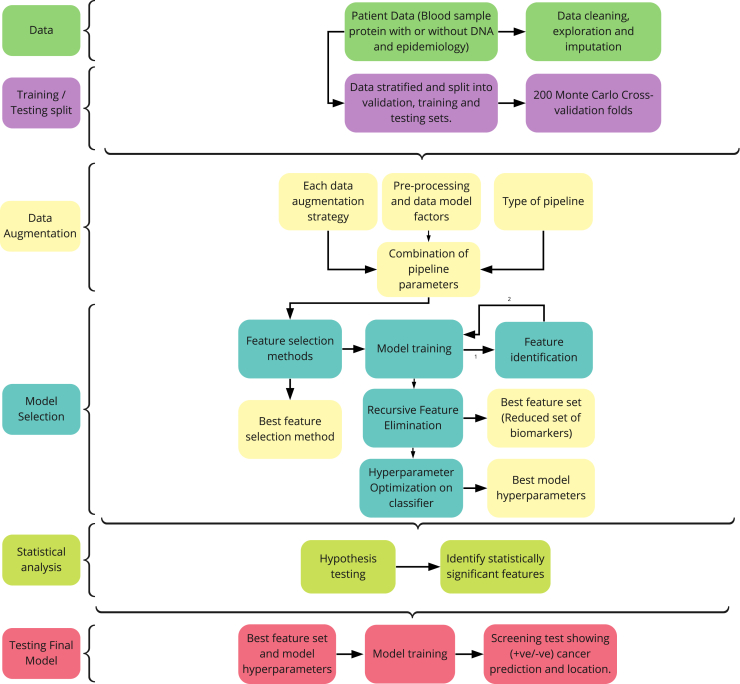
Cancer is a leading cause of mortality worldwide. Over 50% of cancers are diagnosed late, rendering many treatments ineffective. Existing liquid biopsy studies demonstrate a minimally invasive and inexpensive approach for disease detection but lack parsimonious biomarker selection, exhibit poor cancer detection performance and lack appropriate validation and testing. We established a tailored machine learning pipeline, DEcancer, for liquid biopsy analysis that addresses these limitations and improved performance. In a test set from a published cohort of 1,005 patients including 8 cancer types and 812 cancer-free individuals, DEcancer increased stage 1 cancer detection sensitivity across cancer types from 48 to 90%. In addition, with a test set cohort of patients from a high dimensional proteomics dataset of 61 lung cancer patients and 80 cancer-free individuals, DEcancer's performance using a 14-43 protein panel was comparable to 1,000 original proteins. DEcancer is a promising tool which may facilitate improved cancer detection and management.

Keywords: Cancer; Diagnostics; Machine learning.


Conflict of interest statement

A.H. is a founder, an employee, and shareholder of Oxford Cancer Analytics Ltd. L.H. is an employee of Oxford Cancer Analytics Ltd. Z.L. is an employee of Oxford Cancer Analytics Ltd. F.P. was an employee and is a shareholder of Oxford Cancer Analytics Ltd. D.S. is an employee and shareholder of Oxford Cancer Analytics Ltd. E.M. is an employee of Oxford Cancer Analytics Ltd. G.L. declares no competing interests. B.K. is a shareholder and member of the Scientific Advisory Board of Oxford Cancer Analytics Ltd. J.S. is an employee of Oxford Cancer Analytics Ltd. P.J.L. is a founder, an employee and shareholder of Oxford Cancer Analytics Ltd. A.H. and P.J.L. are co-inventors of the patent “A METHOD AND SYSTEM DETECTING A HEALTH ABNORMALITY IN A LIQUID BIOPSY SAMPLE” (International Patent Application Number: PCT/EP2022/075710).

Figures

None
Graphical abstract
Figure 1
Figure 1
Test set receiver operating characteristic (ROC) curve and area under the curve (AUC) showing the performance of the optimized classifier model for distinguishing 201 cancer patients from 163 cancer-free individuals of the Cohen et al. dataset DEcancerP uses proteins-only and DEcancerPDE includes all 39 proteins, DNA-based and epidemiology factors. (Blue) The DEcancerPDE approach for all cancer versus cancer-free test set ROC curve showing performance of optimal model. An AUC of 1.00 is achieved. At a fixed specificity of 99%, DEcancer achieves a sensitivity of 99%. (Orange) The 28-protein model uses the DEcancerP approach for all cancer versus cancer-free test set ROC curve. An AUC of 1.00 is achieved. At a fixed specificity of 99%, DEcancer achieves a sensitivity of 93%.
Figure 2
Figure 2
Bar chart comparing the performance of DEcancerPDE using protein, DNA and epidemiological data and DEcancerP using proteins alone to Cohen et al.’s cancer detection sensitivity for stage 1, 2 and 3 of 8 cancer types Specificity was held at 99%.
Figure 3
Figure 3
Test set receiver operating characteristic (ROC) curve and area under the curve (AUC) showing the performance of the best optimized classifier model (selected based on validation results) for detecting a target cancer from the Cohen et al. dataset The test set results represent a generalizable estimate of performance for DEcancer’s all cancer pipeline. DEcancerP uses proteins-only and DEcancerPDE includes all 39 proteins, DNA-based and epidemiology factors. (Blue) The DEcancerPDE approach for target cancer versus cancer-free test set ROC curve showing performance of optimal model. (Orange) The DEcancerP approach for the target cancer versus cancer-free test set ROC curve. (Green) The DEcancerPDE approach for the target cancer versus other cancers test set ROC curve showing performance of optimal model. (Red) The DEcancerP approach for the target cancer versus other cancers test set ROC curve. (Purple) The DEcancerPDE approach for the target cancer versus other cancers or cancer-free test set ROC curve showing performance of optimal model. (Brown) The DEcancerP approach for the target cancer versus other cancers or cancer-free test set ROC curve. (A) Target cancer: lung. (Blue) An AUC of 1.00 is achieved with the DEcancerPDE model. (Orange) An AUC of 1.00 is achieved with a 12-protein DEcancerP model. (Green) An AUC of 0.95 is achieved with the DEcancerPDE model. (Red) An AUC of 0.95 is achieved with a 39-protein DEcancerP model. (Purple) An AUC of 0.96 is achieved with the DEcancerPDE model. (Brown) An AUC of 0.95 is achieved with a 22-protein DEcancerP model. The optimal sensitivity and specificity corresponding to the top left corner of ROC curve is 95.24 and 99.39%, respectively. (B) Target cancer: breast. (Blue) An AUC of 1.00 is achieved with the DEcancerPDE model. (Orange) An AUC of 1.00 is achieved with a 27-protein DEcancerP model. (Green) An AUC of 0.93 is achieved with a DEcancerPDE model. (Red) An AUC of 0.88 is achieved with a 29-protein DEcancerP model. (Purple) An AUC of 0.97 is achieved with the DEcancerPDE model. (Brown) An AUC of 0.94 is achieved with a 26-protein DEcancerP model. The optimal sensitivity and specificity corresponding to the top left corner of ROC curve is 97.62 and 100.00%, respectively. (C) Target cancer: colorectal. (Blue) An AUC of 1.00 is achieved with the DEcancerPDE model. (Orange) An AUC of 0.99 is achieved with a 22-protein DEcancerP model. (Green) An AUC of 0.95 is achieved with the DEcancerPDE model. (Red) An AUC of 0.94 is achieved with a 22-protein DEcancerP model. (Purple) An AUC of 0.97 is achieved with the DEcancerPDE model. (Brown) An AUC of 0.96 is achieved with a 35-protein DEcancerP model. The optimal sensitivity and specificity corresponding to the top left corner of ROC curve is 94.87 and 99.38%, respectively. (D) Target cancer: esophageal. (Blue) An AUC of 0.98 is achieved with the DEcancerPDE model. (Orange) An AUC of 0.99 is achieved with an 8-protein DEcancerP model. (Green) An AUC of 0.80 is achieved with the DEcancerPDE. (Red) An AUC of 0.71 achieved with a 23-protein DEcancerP model. (Purple) An AUC of 0.83 is achieved with the DEcancerPDE model. (Brown) An AUC of 0.81 is achieved with a 15-protein DEcancerP model. The optimal sensitivity and specificity corresponding to the top left corner of ROC curve is 88.89 and 94.48%, respectively. (E) Target cancer: liver. (Blue) An AUC of 1.00 is achieved with the DEcancerPDE model. (Orange) An AUC of 1.00 is achieved with a 23-protein DEcancerP model. (Green) An AUC of 0.93 is achieved with the DEcancerPDE model. (Red) An AUC of 0.92 is achieved with an 8-protein DEcancerP model. (Purple) An AUC of 0.96 is achieved with the DEcancerPDE model. (Brown) An AUC of 0.96 is achieved with a 19-protein DEcancerP model. The optimal sensitivity and specificity corresponding to the top left corner of ROC curve is 88.89 and 98.77%, respectively. (F) Target cancer: ovarian. (Blue) An AUC of 0.98 is achieved with the DEcancerPDE model. (Orange) An AUC of 0.98 is achieved with a 15-protein DEcancerP model. (Green) An AUC of 0.99 is achieved with the DEcancerPDE model. (Red) An AUC of 0.99 is achieved with a 13-protein DEcancerP model. (Purple) An AUC of 0.99 is achieved with the DEcancerPDE model. (Brown) An AUC of 0.98 is achieved with a 12-protein DEcancerP model. The optimal sensitivity and specificity corresponding to the top left corner of ROC curve is 90.91 and 95.47%, respectively. (G) Target cancer: pancreatic. (Blue) An AUC of 0.98 is achieved with the DEcancerPDE model. (Orange) An AUC of 0.98 is achieved with a 8-protein DEcancerP model. (Green) An AUC of 0.92 is achieved with the DEcancerPDE model. (Red) An AUC of 0.91 is achieved with a 14-protein DEcancerP model. (Purple) An AUC of 0.97 is achieved with the DEcancerPDE model. (Brown) An AUC of 0.97 is achieved with a 9-protein DEcancerP model. The optimal sensitivity and specificity corresponding to the top left corner of ROC curve is 84.21 and 98.77%, respectively. (H) Target cancer: gastric. (Blue) An AUC of 0.97 is achieved with the DEcancerPDE model. (Orange) An AUC of 0.93 is achieved with a 17-protein DEcancerP model. (Green) An AUC of 0.88 is achieved with the DEcancerPDE model. (Red) An AUC of 0.85 is achieved with a 19-protein DEcancerP model. (Purple) An AUC of 0.88 is achieved with the DEcancerPDE model. (Brown) An AUC of 0.88 is achieved with a 25-protein DEcancerP model. The optimal sensitivity and specificity corresponding to the top left corner of ROC curve is 85.71 and 93.21%, respectively.
Figure 4
Figure 4
Control receiver operating characteristic (ROC) curve and area under the curve (AUC) showing the performance of an optimized classifier model with the full protein set used by Blume et al.’s final model to distinguish cancer-free individuals from NSCLC patients For each spion, the full protein set detected by that spion but not detected with the depleted plasma approach is used as per the methodology in Blume et al. The final model was retrained on all 110 training and validation samples and the retrained classifier was then assessed on the 31 test set samples. An ROC curve is shown for each of the spions of Blume et al. and the number of proteins included in the model is indicated. (Blue) SP003 with 711 proteins (AUC 0.92). (Orange) SP006 with 532 proteins (AUC 0.90). (Green) SP007 with 421 proteins (AUC 0.95). (Red) SP333 with 293 proteins (AUC 0.85); (Purple) SP339 with 416 proteins (0.91).
Figure 5
Figure 5
Receiver operating characteristic (ROC) curves and area under the curve (AUC) showing the 31-individual test set performance of the optimized randomforest classifier model for each spion or depleted plasma data of Blume et al. For each spion or depleted plasma, the optimal subset of proteins used by the final classifier model to distinguish between cancer-free and non-lung cancer samples is indicated (Blue) Depleted plasma in which the optimal protein set included 30 proteins (AUC 0.97); (Orange) SP003 in which the optimal protein set included 32 proteins (AUC 0.93); (Green) SP006 in which the optimal protein set included 26 proteins (AUC 0.81); (Red) SP007 in which the optimal protein set included 14 proteins (AUC 0.93); (Purple) SP333 in which the optimal protein set included 36 proteins (AUC 0.92); (Brown) SP339 in which the optimal protein set included 43 proteins (AUC 0.92).
Figure 6
Figure 6
Flowchart outlining the DEcancer early cancer detection pipeline DEcancer was applied to the Cohen et al. dataset of cancer-free individuals and patients with one of 8 types of cancer, as well as the Blume et al. dataset with cancer-free and lung cancer patients. An approximately 20% test set is first separated out. For each classification task, the remaining data not part of the test set are used to form training and validation folds as part of a 200-fold Monte Carlo cross validation scheme. Various data augmentation approaches are applied to the training data. Feature selection and hyperparameter optimization of the classifier model are carried out based on performance on the validation folds. The independent t-test is used to compare the performance of the classifier model with the best performing feature set to that of the classifier using the smallest subset of variables, such that the performance is not statistically significantly lower than that of the best feature set. The best data processing framework, classifier models and feature set are then selected. Subsequently, retraining is performed on all training and validation data combined and the models assessed on the test set samples.

References

    1. Sung H., Ferlay J., Siegel R.L., Laversanne M., Soerjomataram I., Jemal A., Bray F. Global cancer statistics 2020: GLOBOCAN estimates of incidence and mortality worldwide for 36 cancers in 185 countries. CA. Cancer J. Clin. 2021;71:209–249. doi: 10.3322/caac.21660. - DOI - PubMed
    1. Loud J.T., Murphy J. Cancer screening and early detection in the 21stCentury. Semin. Oncol. Nurs. 2017;33:121–128. doi: 10.1016/j.soncn.2017.02.002. - DOI - PMC - PubMed
    1. Miller K.D., Nogueira L., Devasia T., Mariotto A.B., Yabroff K.R., Jemal A., Kramer J., Siegel R.L. Cancer treatment and survivorship statistics. CA. Cancer J. Clin. 2022;72:409–436. doi: 10.3322/caac.21731. - DOI - PubMed
    1. Runowicz C.D., Leach C.R., Henry N.L., Henry K.S., Mackey H.T., Cowens-Alvarado R.L., Cannady R.S., Pratt-Chapman M.L., Edge S.B., Jacobs L.A., et al. American cancer society/American society of clinical oncology breast cancer survivorship care guideline. CA. Cancer J. Clin. 2016;66:43–73. doi: 10.3322/caac.21319. - DOI - PubMed
    1. Fiorica J.V. Breast cancer screening, mammography, and other modalities. Clin. Obstet. Gynecol. 2016;59:688–709. doi: 10.1097/GRF.0000000000000246. - DOI - PubMed

LinkOut - more resources