. 2023 Apr 24:11:1091666.
doi: 10.3389/fcell.2023.1091666. eCollection 2023.

Analysis of candidate genes for cleft lip ± cleft palate using murine single-cell expression data

Affiliations

Analysis of candidate genes for cleft lip ± cleft palate using murine single-cell expression data

Anna Siewert et al. Front Cell Dev Biol. .

Abstract

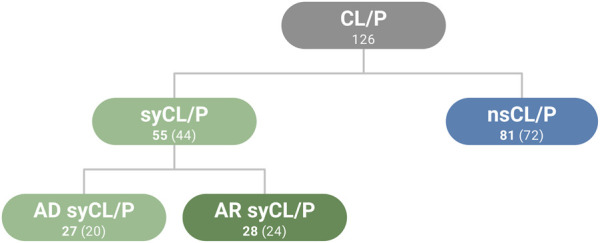
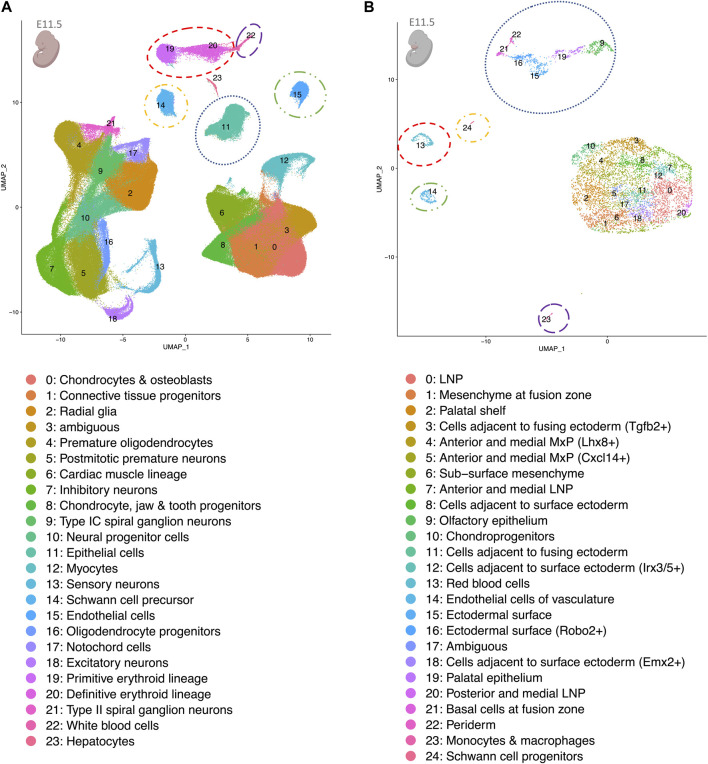
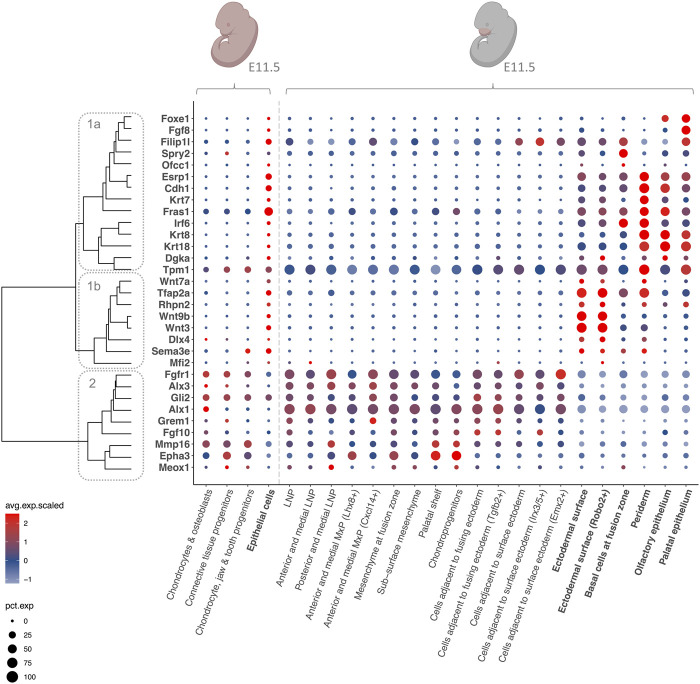
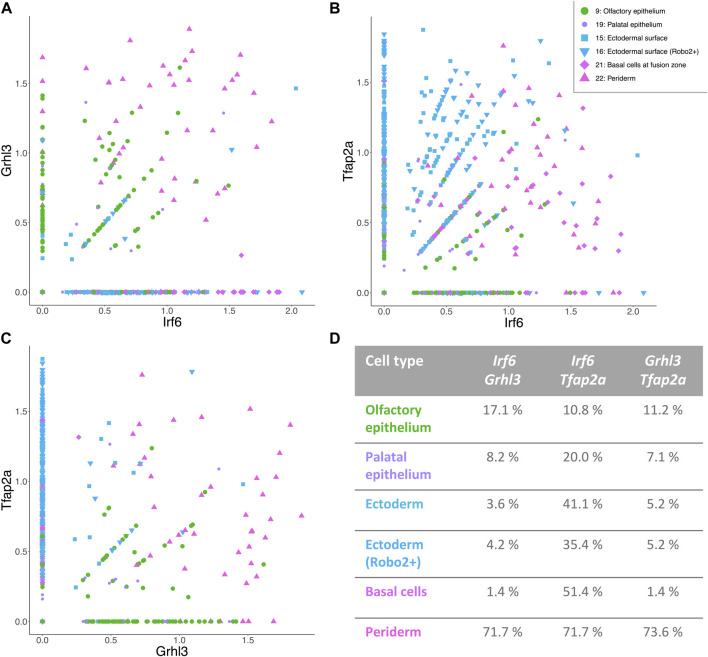
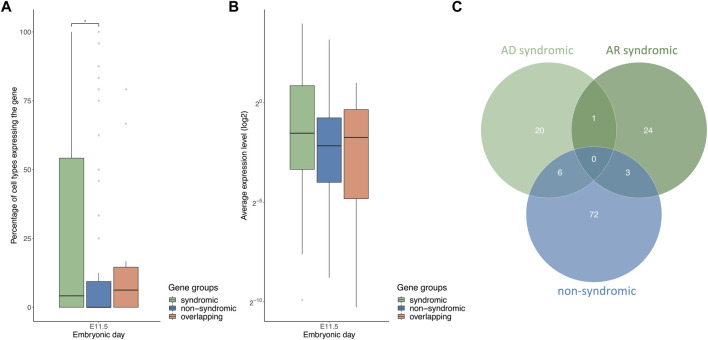
Introduction: Cleft lip ± cleft palate (CL/P) is one of the most common birth defects. Although research has identified multiple genetic risk loci for different types of CL/P (i.e., syndromic or non-syndromic forms), determining the respective causal genes and understanding the relevant functional networks remain challenging. The recent introduction of single-cell RNA sequencing (scRNA-seq) has provided novel opportunities to study gene expression patterns at cellular resolution. The aims of our study were to: (i) aggregate available scRNA-seq data from embryonic mice and provide this as a resource for the craniofacial community; and (ii) demonstrate the value of these data in terms of the investigation of the gene expression patterns of CL/P candidate genes. Methods and Results: First, two published scRNA-seq data sets from embryonic mice were re-processed, i.e., data representing the murine time period of craniofacial development: (i) facial data from embryonic day (E) E11.5; and (ii) whole embryo data from E9.5-E13.5 from the Mouse Organogenesis Cell Atlas (MOCA). Marker gene expression analyses demonstrated that at E11.5, the facial data were a high-resolution representation of the MOCA data. Using CL/P candidate gene lists, distinct groups of genes with specific expression patterns were identified. Among others we identified that a co-expression network including Irf6, Grhl3 and Tfap2a in the periderm, while it was limited to Irf6 and Tfap2a in palatal epithelia, cells of the ectodermal surface, and basal cells at the fusion zone. The analyses also demonstrated that additional CL/P candidate genes (e.g., Tpm1, Arid3b, Ctnnd1, and Wnt3) were exclusively expressed in Irf6+ facial epithelial cells (i.e., as opposed to Irf6- epithelial cells). The MOCA data set was finally used to investigate differences in expression profiles for candidate genes underlying different types of CL/P. These analyses showed that syndromic CL/P genes (syCL/P) were expressed in significantly more cell types than non-syndromic CL/P candidate genes (nsCL/P). Discussion: The present study illustrates how scRNA-seq data can empower research on craniofacial development and disease.

Keywords: IRF6; cleft lip with or without cleft palate; craniofacial development; expression pattern; single-cell RNA sequencing (scRNA-seq); single-cell transcriptomics.


Conflict of interest statement

BR and HD were employed by FASTGenomics (Comma Soft AG). The remaining authors declare that the research was conducted in the absence of any commercial or financial relationships that could be construed as a potential conflict of interest.

Figures

FIGURE 1
FIGURE 1
Summary of gene lists used in the present study. Genes that overlapped between categories are included in the numbers of genes indicated in bold (n = 10). Numbers in parentheses correspond to the number of unique genes in the respective category, without overlapping genes. CL/P (cleft lip with or without cleft palate), ns (non-sndromic), sy (syndromic), AD (autosomal dominant), AR (autosomal recessive).
FIGURE 2
FIGURE 2
UMAP plots of re-analyzed scRNA-seq whole embryo data at E11.5 (A) and facial data at E11.5 (B). Despite differing read depths in the two data sets, shared cell clusters corresponding to matched cell types are observed. These are encircled in the same color in both panels. The pink colors of the embryo graphics correspond to the tissues that are included in the data set. Lateral nasal process (LNP), maxillary prominence (MxP).
FIGURE 3
FIGURE 3
Expression patterns of CL/P candidate genes at E11.5. Dotplot of gene expression for selected CL/P candidate genes at E11.5 in selected cell types in the MOCA and the facial data. The color of the dots corresponds to the average scaled expression level. The size of the dots corresponds to the percentage of cells that express the gene in the respective cell type. Epithelial cell types are indicated in bold, and mesenchymal-like cell types are indicated in non-bold. Dendrogram cluster 1a = genes expressed predominantly in periderm, basal cells at fusion zone, olfactory epithelium, and palatal epithelium; cluster 1b = genes predominantly expressed in ectodermal surface; cluster 2 = genes expressed predominantly in mesenchymal-like cell types. The pink colors of the embryo graphics correspond to the tissues that are included in the data set. Lateral nasal process (LNP), maxillary prominence (MxP).
FIGURE 4
FIGURE 4
Distinct populations of epithelial cells with a possible involvement in CL/P. (A–C) Irf6-Grhl3-Tfap2a show partial co-expression in epithelial cell types of E11.5 facial data. The axes of the graphs represent the expression level. Legend for all three figures is positioned in panel (B). (D) Table showing the percentage of cells with co-expression of the respective gene pair in all six epithelial cell clusters.
FIGURE 5
FIGURE 5
AD syCL/P genes are expressed in more cell types and have higher average expression levels compared with nsCL/P genes. (A) Boxplot of the percentages of cell types expressing the gene groups of syCL/P, nsCL/P, and overlapping genes at E11.5 (B) Boxplot of average log2 expression levels of the gene groups of syCL/P, nsCL/P, and overlapping genes at E11.5. (C) Venn diagram of non-syndromic, AR syndromic, and AD syndromic CL/P gene lists. (*p < 0.05). Data on the remaining time points are provided in Supplementary Figure S2.

References

    1. Bachler M., Neubüser A. (2001). Expression of members of the fgf family and their receptors during midfacial development. Mech. Dev. 100 (2), 313–316. 10.1016/S0925-4773(00)00518-9 - DOI - PubMed
    1. Bartsocas C. S., Papas C. V. (1972). Popliteal pterygium syndrome. Evidence for a severe autosomal recessive form. J. Med. Genet. 9 (2), 222–226. 10.1136/jmg.9.2.222 - DOI - PMC - PubMed
    1. Bebee T. W., Juw Won Park K. I., Alex M., Xing Y., Carstens R. P. (2015). The splicing regulators Esrp1 and Esrp2 direct an epithelial splicing program essential for mammalian development. ELife 4, 1–27. 10.7554/eLife.08954 - DOI - PMC - PubMed
    1. Birnbaum S., Ludwig K. U., Reutter H., Herms S., Rubini M., Baluardo C., et al. (2009). Key susceptibility locus for nonsyndromic cleft lip with or without cleft palate on chromosome 8q24. Nat. Genet. 41 (4), 473–477. 10.1038/ng.333 - DOI - PubMed
    1. Bishop M. R., Diaz Perez K. K., Sun M., Ho S., Chopra P., Mukhopadhyay N., et al. (2020). Genome-wide enrichment of de novo coding mutations in orofacial cleft trios. Am. J. Hum. Genet. 107 (1), 124–136. 10.1016/j.ajhg.2020.05.018 - DOI - PMC - PubMed