. 2023 Jun;22(6):100566.
doi: 10.1016/j.mcpro.2023.100566. Epub 2023 May 9.

Degradomic Identification of Membrane Type 1-Matrix Metalloproteinase as an ADAMTS9 and ADAMTS20 Substrate

Affiliations

Degradomic Identification of Membrane Type 1-Matrix Metalloproteinase as an ADAMTS9 and ADAMTS20 Substrate

Sumeda Nandadasa et al. Mol Cell Proteomics. 2023 Jun.

Abstract

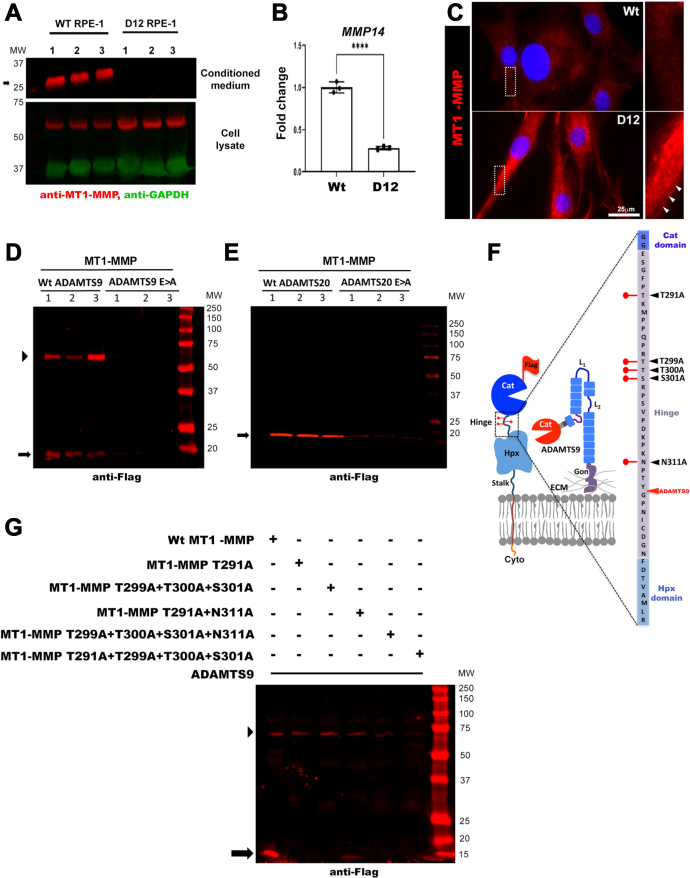
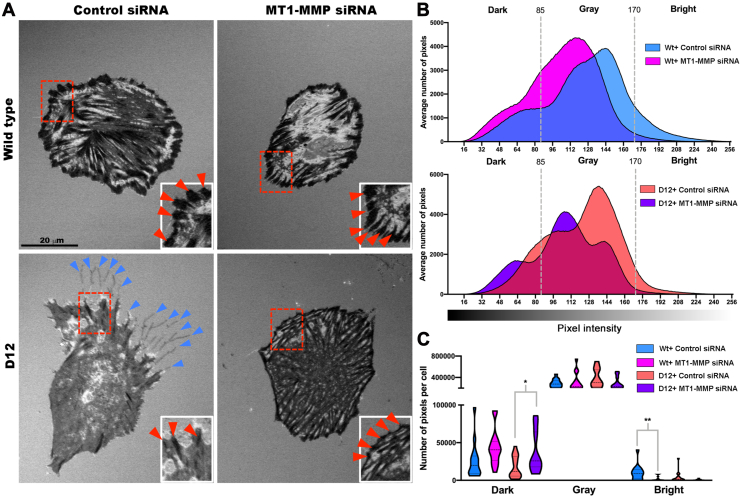
The secreted metalloproteases ADAMTS9 and ADAMTS20 are implicated in extracellular matrix proteolysis and primary cilium biogenesis. Here, we show that clonal gene-edited RPE-1 cells in which ADAMTS9 was inactivated, and which constitutively lack ADAMTS20 expression, have morphologic characteristics distinct from parental RPE-1 cells. To investigate underlying proteolytic mechanisms, a quantitative terminomics method, terminal amine isotopic labeling of substrates was used to compare the parental and gene-edited RPE-1 cells and their medium to identify ADAMTS9 substrates. Among differentially abundant neo-amino (N) terminal peptides arising from secreted and transmembrane proteins, a peptide with lower abundance in the medium of gene-edited cells suggested cleavage at the Tyr314-Gly315 bond in the ectodomain of the transmembrane metalloprotease membrane type 1-matrix metalloproteinase (MT1-MMP), whose mRNA was also reduced in gene-edited cells. This cleavage, occurring in the MT1-MMP hinge, that is, between the catalytic and hemopexin domains, was orthogonally validated both by lack of an MT1-MMP catalytic domain fragment in the medium of gene-edited cells and restoration of its release from the cell surface by reexpression of ADAMTS9 and ADAMTS20 and was dependent on hinge O-glycosylation. A C-terminally semitryptic MT1-MMP peptide with greater abundance in WT RPE-1 medium identified a second ADAMTS9 cleavage site in the MT1-MMP hemopexin domain. Consistent with greater retention of MT1-MMP on the surface of gene-edited cells, pro-MMP2 activation, which requires cell surface MT1-MMP, was increased. MT1-MMP knockdown in gene-edited ADAMTS9/20-deficient cells restored focal adhesions but not ciliogenesis. The findings expand the web of interacting proteases at the cell surface, suggest a role for ADAMTS9 and ADAMTS20 in regulating cell surface activity of MT1-MMP, and indicate that MT1-MMP shedding does not underlie their observed requirement in ciliogenesis.

Keywords: ADAM; ADAMTS; MMP; MT1-MMP; cleavage; degradome; degradomics; focal adhesion; gene-editing-N-terminomics; metalloprotease; protease; proteolysis; substrate.


Conflict of interest statement

Conflict of interest The authors declare no competing interests.

Figures

None
Graphical abstract
Fig. 1
Fig. 1
Altered cell–substratum interface in gene-edited RPE-1 cells lacking ADAMTS9.A, still photomicroscopy of concurrent, aligned interference reflection microscopy (IRM) and differential interference contrast (DIC) images from time-lapse experiments (see supplemental Movies S1–S4) at 30 min postseeding show strong adhesions (dark areas in cells indicated by red arrowheads) in the majority of parental RPE-1 cells (labeled as WT). ADAMTS9 KO RPE-1 cells (labeled as D12) also attach, but only occasional cells form strong adhesions at this early point. B, IRM of parental RPE-1 (labeled as WT) and ADAMTS9 KO (D12) cells 24 h postseeding from time-lapse images showing poorly formed fibrillar adhesions in D12 cells (contrasting with discrete and peripheral fibrillar adhesions in parental RPE-1 cells (red arrowheads)). D12 cells show trailing edge filamentous extensions (blue arrowheads), which are lacking in parental RPE-1 cells. The arrow indicates the direction of cell migration, which was determined by live imaging. C, distribution of IRM pixel intensities comparing parental RPE-1 cells (Wt, blue) and D12 cells (red). Dotted lines bin dark (0–85), gray (85–170), and bright (170–256) pixels. D, violin plot of binned pixel intensities per cell shows that D12 cells have fewer dark pixels (strong focal adhesions). N = 20 cells per group, ∗∗∗p < 0.0005, two-tailed unpaired Student t test. The scale bars represent 25 μm in (A) and 20 μm in (B). ADAMTS, a disintegrin-like and metalloproteinase domain with thrombospondin type 1 repeats.
Fig. 2
Fig. 2
Identification of MT1-MMP as a novel ADAMTS9 substrate.A, schematic illustrating the key experimental steps of the TAILS (terminal amine isotopic labeling of substrates) strategy as applied to parental RPE-1 cells (Wt) and D12 conditioned medium (using reductive dimethylation of protein N termini) and to cell lysates (using iTRAQ labeling of protein N termini). B, volcano plot of neo-N terminal peptides arising from secreted and cell-surface proteins identified by TAILS of the medium. Peptides indicating MT1-MMP cleavage at Y314-G315 and TMEM67 cleavage at K322-F333 are identified by red and green colors, respectively and show a statistically significant reduction in D12 cells. C, MS2 profile of the MT1-MMP peptide (GPNICDGNFDTVAMLR), which was dimethyl labeled at the N terminus and reduced in the medium of D12 cells. D, extracted ion chromatograms of the MT1-MMP precursor ion from triplicate experiments (left) and quantitation of normalized abundance of the identified MT1-MMP neo-peptide in triplicate experiments (right). ∗∗p < 0.005, two-tailed unpaired Student t test. E, cartoon of MT1-MMP domain structure indicating the location within the hinge of the ADAMTS9 cleavage site deduced from the peptide in (C). The four blades of the hemopexin domain β-propeller structure are numbered in sequence from N terminus to C terminus. ADAMTS, a disintegrin-like and metalloproteinase domain with thrombospondin type 1 repeats; CM, cell membrane; Cyto, cytoplasmic tail; mAb, mAb to catalytic domain; MS, mass spectrometry; MT-MMP, membrane type-matrix metalloproteinase; Pro, propeptide; SP, signal peptide.
Fig. 3
Fig. 3
MT1-MMP is cleaved by ADAMTS9 and ADAMTS20, and MT1-MMP hinge glycosylation is essential for proteolysis by ADAMTS9.A, Western blot of parental RPE-1 (Wt) and D12 conditioned medium and cell lysate with a catalytic domain-specific antibody and anti-GAPDH as control showing release of the MT1-MMP catalytic domain (arrow indicates the catalytic domain fragment) in Wt but not D12 cells and corresponding to this, higher MT1-MMP signal in D12 lysates. B, quantitative RT-PCR analysis of MMP14 (MT1-MMP) transcript levels in parental RPE-1 (Wt) and D12 cells shows significantly downregulated expression in D12 cells. Error bars indicate S.D., ∗∗∗∗p < 0.0001, two-tailed unpaired Student t test. C, cell surface immunostaining of MT1-MMP utilizing a catalytic domain antibody (red) shows more intense MT1-MMP staining in D12 cells. Nuclei are stained blue by DAPI. Molecular weight markers are shown on the right of the blot. High-magnification areas shown on the right are marked by the white boxes. White arrowheads indicate the cell membrane. The scale bar represents 25 μm. D, Western blot (anti-FLAG) of the medium of HEK293T cells cotransfected in triplicate with MT1-MMP and ADAMTS9 showing molecular species of ∼60 kDa (arrowhead), corresponding to the MT1-MMP ectodomain and presumed to occur within the MT1-MMP stalk and ∼15 kDa (arrow), which are lacking in the medium of cells cotransfected with catalytically inactive ADAMTS9 (ADAMTS9E>A). Molecular weight markers are shown on the right of the blot adjoining the protein ladder. E, Western blot (anti-FLAG) of the medium of HEK293T cells cotransfected in triplicate with MT1-MMP and ADAMTS20 showing a single 15 kDa fragment (arrow), which is lacking in the medium of cells cotransfected with catalytically inactive ADAMTS20 (ADAMTS20E>A). Molecular weight markers are shown on the right of the blot. F, schematic illustrating the MT1-MMP hinge in greater detail and depicting a model of ADAMTS9 cleavage at the MT1-MMP hinge. The hinge sequence is shown at far right flanked by the catalytic (Cat) domain and hemopexin (Hpx) domains. Lollipops indicate the glycosylated residues, and black arrowheads indicate the specific mutations at these sites. The ADAMTS9 cleavage site is indicated by the red arrowhead. G, Western blot of the medium from HEK293T cells cotransfected with ADAMTS9 and MT1-MMP or the indicated glycosylation mutants. Note the absence of the ∼15 kDa fragment indicated by the arrow in all glycosylation mutants and additionally, lack of stalk cleavage in the T291A + T299A + T300A + T301A mutant (∼60 kDa fragment indicated by arrowhead). Molecular weight markers are shown on the right of the blot. ADAMTS, a disintegrin-like and metalloproteinase domain with thrombospondin type 1 repeats; Cyto, cytoplasmic tail; ECM, extracellular matrix; Gon, Gon-1 domain; MT-MMP, membrane type-matrix metalloproteinase.
Fig. 4
Fig. 4
Degradomics identification of a cleavage site in the MT1-MMP hemopexin domain.A, schematic of the strategy for identifying nontryptic peptides in the medium of parental RPE-1 cells and D12 cells and quantitation via internal dimethyl-labeled lysine residues. B, volcano plot of peptides identified with this strategy highlighting MT1-MMP and TMEM67 peptides and indicating cleavages at Phe429-Phe430 (red) and Asn342-Phe343 (dark blue), respectively. C, MS2 profile of the MT1-MMP peptide GLPTDKIDAALFWMPNGKTYF. D, quantitation of normalized abundance of the identified MT1-MMP peptide in triplicate experiments. ∗p < 0.05, two-tailed unpaired Student t test. E, location of the deduced cleavage site in blade 3 of the hemopexin domain. The hinge cleavage site is also shown. MS, mass spectrometry; MT-MMP, membrane type-matrix metalloproteinase; TM, transmembrane segment.
Fig. 5
Fig. 5
Increased pro-MMP2 activation and collagenase activity in D12 cells as a result of increased cell-surface MT1-MMP.A, gelatin zymography of the medium from parental RPE-1 cells (WT) and D12 cells shows increased active MMP2 (62 kDa) as well as an intermediate species (I) in the D12 medium. B, quantitation of band intensities from (A) shows significantly higher active MMP2 levels in the D12 medium. N = 4, each group, error bars indicate SD, ∗ indicates p < 0.05, ∗∗∗ indicates p < 0.05, Student t test. C, parental RPE-1 cells and D12 cells were cultured on DQ collagen type I–coated plates for 24 h, and areas of collagenolysis were visualized by green fluorescence, showing greater activity in D12 cells than parental RPE-1 cells. D, quantitative RT-PCR analysis shows reduced MMP2 mRNA in D12 cells. Error bars indicate SD, ∗∗∗∗p < 0.0001, two-tailed unpaired Student t test. The scale bar in (C) represents 25 μm. MT-MMP, membrane type-matrix metalloproteinase.
Fig. 6
Fig. 6
Depletion or overexpression of cellular MT1-MMP affects cilium length but not cilium biogenesis.A, immunostaining of cell surface MT1-MMP (red) shows that MMP14 siRNA effectively depleted MT1-MMP in both parental RPE-1 cells (Wt) and ADAMTS9-edited RPE-1 D12 cells. B, Western blot of parental RPE-1 cells treated with control siRNA or MMP14 siRNA shows significant depletion of MT1-MMP (red) normalized to GAPDH (green) as a measure of knockdown. Error bars indicate SD, ∗∗ indicates p < 0.005, two-tailed unpaired Student t test analysis. C and D, primary cilium staining using acetylated α-tubulin antibody (green) in parental RPE-1 cells treated with control siRNA and MMP14 siRNA (upper panels) or transfected with MT1-MMP or empty vector (E.V.) (lower panels) showed that MT1-MMP depletion did not affect the percentage of ciliated cells but slightly increased cilium length. MT1-MMP overexpression also did not affect the percentage of ciliated cells but slightly decreased cilium length. Red error bars indicate SD, black lines indicate mean, ∗∗∗p < 0.0005, ∗p < 0.05 two-tailed unpaired Student t test. E and F, primary cilium analysis using acetylated α-tubulin immunostaining (green) after depletion of MT1-MMP in D12 cells showed no impact on the percentage of ciliated cells nor cilium length. Red error bars indicate SD, black lines indicate the mean. The scale bars represent 20 μm in (A) and 25 μm in (B). ADAMTS, a disintegrin-like and metalloproteinase domain with thrombospondin type 1 repeats; MT-MMP, membrane type-matrix metalloproteinase.
Fig. 7
Fig. 7
MT1-MMP depletion restored cell–substratum interaction in RPE1-ADAMTS9KOcells.A, still images taken from concurrent, aligned interference reflection microscopy (IRM) and differential interference contrast (DIC) time-lapse imaging show reversion of the cell–substratum interface to that noted at the same time point in parental RPE-1 cells (see Fig. 1A) after MMP14 knockdown. Red arrowheads indicate attached cells with dark contacts. B, percentage of D12 cells bound by focal adhesions observed by time-lapse microscopy after transfection with MT1-MMP siRNA (orange) and scrambled siRNA (blue) shows consistently better cell attachment in the former. C, quantitative RT-PCR analysis for MMP14 and MMP2 transcripts in D12 cells treated with control siRNA and MMP14 siRNA shows effective knockdown and suggests that stronger attachment after MMP14 knockdown is not due to altered transcription of MMP2. Error bars indicate SD, ∗∗ indicates p < 0.0005 in two-tailed unpaired Student t test. The scale bar represents 50 μm in (A). ADAMTS, a disintegrin-like and metalloproteinase domain with thrombospondin type 1 repeats; MT-MMP, membrane type-matrix metalloproteinase.
Fig. 8
Fig. 8
MT1-MMP knockdown improves focal adhesion formation in D12 cells.A, interference reflection microscopy (IRM) imaging 24 h after seeding of parental RPE-1 cells and D12 cells treated with control siRNA or MMP14 siRNA shows an increase in fibrillar adhesions, especially at the cell periphery (red arrowheads, inset box) and lack of trailing edge filamentous extensions observed in D12 cells (blue arrowheads). B, distribution of IRM pixel intensities comparing parental RPE-1 cells treated with control siRNA (blue) or MT1-MMP siRNA (pink) and D12 cells treated with control siRNA (salmon) or MT1-MMP siRNA (purple). Dashed lines indicate binning of dark (0–85), gray (85–170), and bright (170–256) pixels. C, violin plot of binned pixel intensities per cell showing increased dark pixels in D12 cells treated with MT1-MMP siRNA compared to control siRNA treatment and decreased bright pixels in WT cells treated with MT1-MMP siRNA. N = 14 to 16 cells per treatment group, ∗p < 0.05, ∗∗p < 0.005, two-tailed unpaired Student t test. The scale bar represents 20 μm in (A). MT-MMP, membrane type-matrix metalloproteinase.

References

    1. Lichtenthaler S.F., Lemberg M.K., Fluhrer R. Proteolytic ectodomain shedding of membrane proteins in mammals-hardware, concepts, and recent developments. EMBO J. 2018;37 - PMC - PubMed
    1. Mead T.J., Apte S.S. ADAMTS proteins in human disorders. Matrix Biol. 2018;71-72:225–239. - PMC - PubMed
    1. Kuno K., Matsushima K. ADAMTS-1 protein anchors at the extracellular matrix through the thrombospondin type I motifs and its spacing region. J. Biol. Chem. 1998;273:13912–13917. - PubMed
    1. Cain S.A., Mularczyk E.J., Singh M., Massam-Wu T., Kielty C.M. ADAMTS-10 and -6 differentially regulate cell-cell junctions and focal adhesions. Sci. Rep. 2016;6 - PMC - PubMed
    1. Rodriguez-Manzaneque J.C., Carpizo D., Plaza-Calonge Mdel C., Torres-Collado A.X., Thai S.N., Simons M., et al. Cleavage of syndecan-4 by ADAMTS1 provokes defects in adhesion. Int. J. Biochem. Cell Biol. 2009;41:800–810. - PMC - PubMed

Publication types

LinkOut - more resources