. 2023 Oct;12(27):e2301148.
doi: 10.1002/adhm.202301148. Epub 2023 Jun 20.

Hybrid Polypyrrole and Polydopamine Nanosheets for Precise Raman/Photoacoustic Imaging and Photothermal Therapy

Affiliations

Hybrid Polypyrrole and Polydopamine Nanosheets for Precise Raman/Photoacoustic Imaging and Photothermal Therapy

Hongya Geng et al. Adv Healthc Mater. 2023 Oct.

Abstract

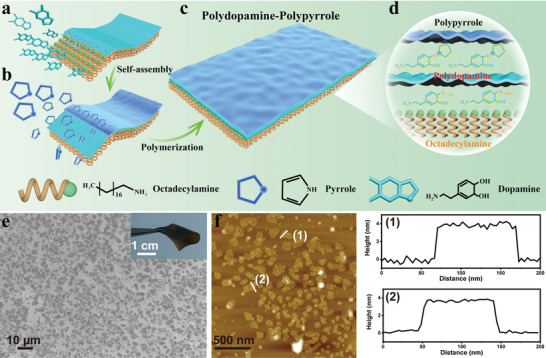
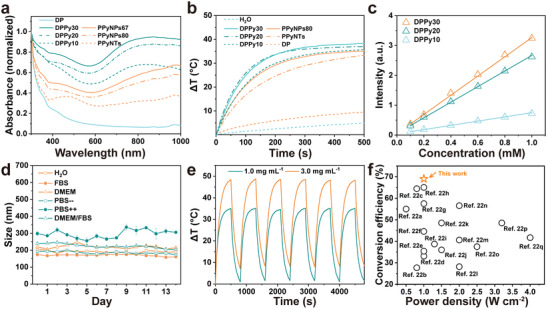
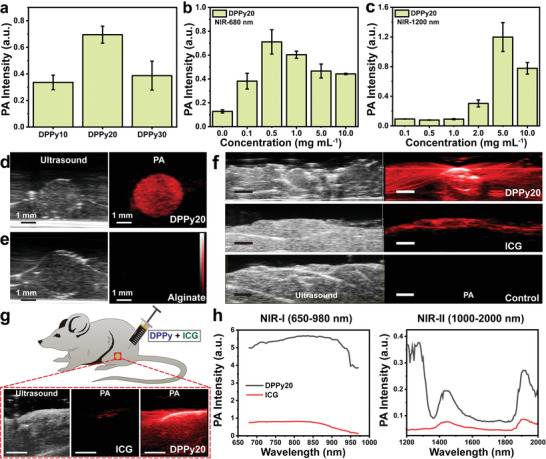
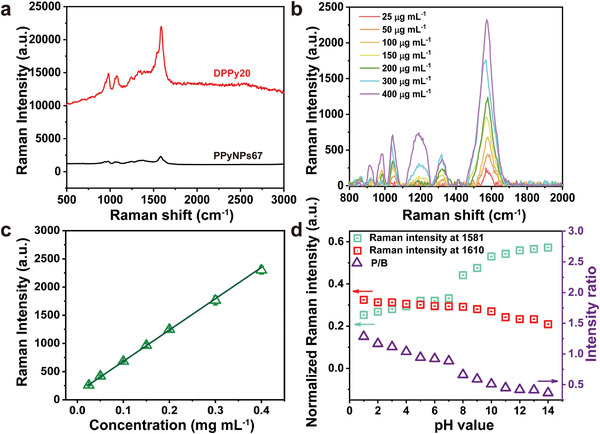
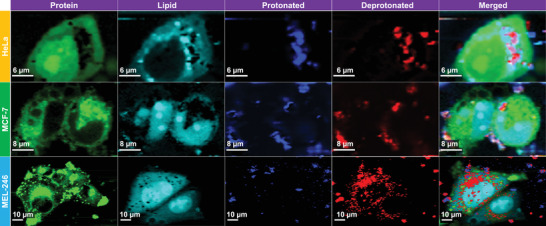
The development of near-infrared light responsive conductive polymers provides a useful theranostic platform for malignant tumors by maximizing spatial resolution with deep tissue penetration for diagnosis and photothermal therapy. Herein, the self-assembly of ultrathin 2D polypyrrole nanosheets utilizing dopamine as a capping agent and a monolayer of octadecylamine as a template is demonstrated. The 2D polypyrrole-polydopamine nanostructure has tunable size distribution which shows strong absorption in the first and second near-infrared windows, enabling photoacoustic imaging and photothermal therapy. The hybrid double-layer is demonstrated to increase Raman intensity for 3D Raman imaging (up to two orders of magnitude enhancement and spatial resolution up to 1 µm). The acidic environment drives reversible doping of polypyrrole, which can be detected by Raman spectroscopy. The combined properties of the nanosheets can substantially enhance performance in dual-mode Raman and photoacoustic guided photothermal therapy, as shown by the 69% light to heat conversion efficiency and higher cytotoxicity against cancer spheroids. These pH-responsive features highlight the potential of 2D conductive polymers for applications in accurate, highly efficient theranostics.

Keywords: Raman imaging; conductive nanosheets; photoacoustic imaging; photothermal therapy; polypyrrole.


Conflict of interest statement

The authors declare no conflict of interest.

Figures

Figure 1
Figure 1
Self‐assembly and morphology of the DPPy nanosheets. a) Schematic of the octadecylamine/PD nanosheet. b) PPy was assembled and polymerized on an octadecylamine/PD nanosheet. c,d) Three layers of polydopamine‐PPy nanosheet. e) SEM image of the nanosheet structures. Inset shows a membrane consisting of DPPy20 nanosheets. f) AFM topographic image of DPPy30 and the corresponding height profiles of the two nanostructures indicated with white lines.
Figure 2
Figure 2
Characterization of DPPy nanosheets in solution. a) UV–vis‐NIR absorption spectra of various DPPy nanosheets compared with PPy nanospheres and nanotubes. b) Temperature increase of various materials in 2.0 mg mL−1 under 808 nm laser irradiation. c) The UV–vis absorption intensity of DPPy in water with increasing concentrations. Data shown as mean ± s.d., N = 3. d) Stability test as shown by size profiles of DPPy nanosheets in different buffer solutions recorded by dynamic light scattering measurements for 2 weeks. Data shown as mean ± s.d., N = 3. e) Repeated heating/cooling profiles of DPPy20 suspended in PBS with different concentrations under 808 nm laser irradiation with a power density of 0.5 W cm−2. f) Comparison of photothermal conversion efficiency under irradiation with various power densities of nanosheets reported in this work and in the past 5 years.[ 22 ]
Figure 3
Figure 3
Performance of 2D nanosheets as contrast agents for PA imaging. a) PA intensity of DPPy10, DPPy20, and DPPy30. b,c) PA intensity of DPPy20 at wavelengths of 680 and 1200 nm. Data shown as mean ± s.d., N = 3. d) Representative ultrasound and PA image of DPPy20‐loaded alginate sphere phantom. e) Representative ultrasound and PA image of alginate sphere phantom not loaded with DPPy. f) In vitro ultrasound and PA image of chicken slices injected with 250 µL of 0.5 mg mL−1 aqueous solution of DPPy20 and ICG. Scale bar, 2 mm. A spectroscopic experiment was performed starting at 680 nm to a maximum of 2000 nm with a 5 nm step size. g) Representative in vivo PA images of a healthy mouse after intramuscular injection of a mixture of DPPy20 (1.0 mg mL−1) and indocyanine green (ICG) (1.0 mg mL−1) in the hind limb. Scale bar, 5 mm. h) Corresponding PA intensity in the first (650–980 nm, NIR‐I) and the second (1000‐2000 nm, NIR‐II) NIR window. Data were collected by injecting DPPy20 and ICG into 3 mice.
Figure 4
Figure 4
Raman shift and pH value relationship of DPPy20. a) Raman spectra of DPPy20 (red) and PPyNPs67 (black) using 532 nm laser and 5 s accumulation time. b) Relative Raman intensity of DPPy20 aqueous suspensions plotted as a function of the concentration of PPy. The Raman intensity data were collected using a 532 nm laser of 2 mW power with an integration time of 0.5 s three times, see the Supporting Information for more details about the measurement. c) Raman intensity of DPPy20 in PBS with increasing concentration of pyrrole. Data shown as mean ± s.d., N = 6. d) Relative Raman intensity ratio of vibrational bands of C=C at 1610 and 1581 cm−1, which could be assigned to the transition between polaron and bipolaron states.
Figure 5
Figure 5
Confocal Raman visualization of HeLa, MCF‐7, and MEL‐246 cells treated with 0.1 mg mL−1 of DPPy20. Protein, lipid, protonated DPPy20, and deprotonated DPPy20 were selected to display. Protein‐rich regions at 1006 and 679 cm−1 (shown in green), lipid‐rich regions at 1300 and 1430 cm−1 (shown in cyan), intensity ratio of vibrational bands of C=C at 1610 and 1581 cm−1 higher than 0.88 for protonated DPPy20 regions (shown in blue), while lower than 0.88 for deprotonated DPPy20 regions (shown in red). See the Supporting Information for more details. The Raman intensity of each component is normalized to the lipid peak intensity.

References

    1. Li T., Li C., Ruan Z., Xu P., Yang X., Yuan P., Wang Q., Yan L., ACS Nano 2019, 13, 3691. - PubMed
    1. Wang H., Chang J., Shi M., Pan W., Li N., Tang B., Angew. Chem., Int. Ed. 2019, 58, 1057. - PubMed
    1. Liu S., Pan X., Liu H., 2020, 59, 5890. - PubMed
    1. Deng X., Shao Z., Zhao Y., Adv. Sci. 2021, 8, 2002504. - PMC - PubMed
    1. a) Karabeber H., Huang R., Iacono P., Samii J. M., Pitter K., Holland E. C., Kircher M. F., ACS Nano 2014, 8, 9755; - PMC - PubMed
    2. b) Jiang T., Olson E. S., Nguyen Q. T., Roy M., Jennings P. A., Tsien R. Y., Proc. Natl. Acad. Sci. USA 2004, 101, 17867; - PMC - PubMed
    3. c) Jokerst J. V., Cole A. J., Van de Sompel D., Gambhir S. S., ACS Nano 2012, 6, 10366. - PMC - PubMed

Publication types