. 2023 May 11;14(1):2671.
doi: 10.1038/s41467-023-38188-z.

Convergent evolution of SARS-CoV-2 Omicron subvariants leading to the emergence of BQ.1.1 variant

Collaborators, Affiliations

Convergent evolution of SARS-CoV-2 Omicron subvariants leading to the emergence of BQ.1.1 variant

Jumpei Ito et al. Nat Commun. .

Abstract

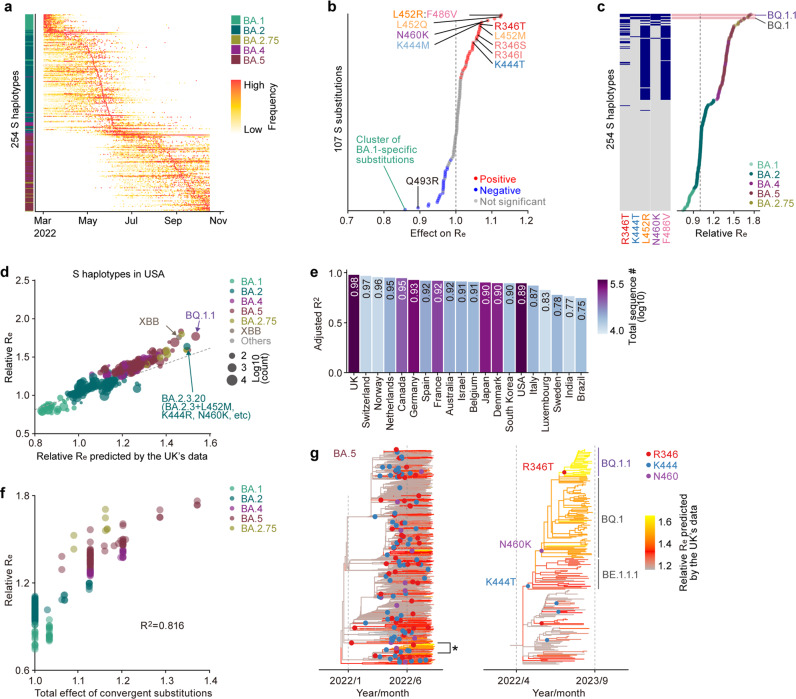
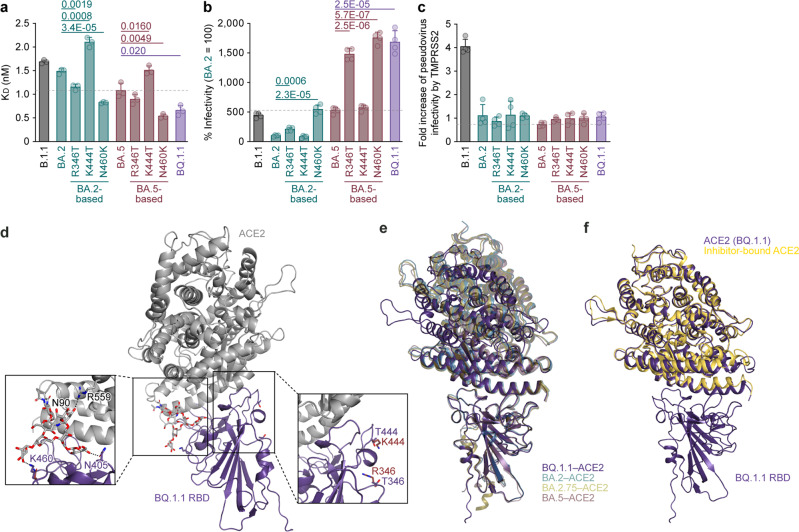
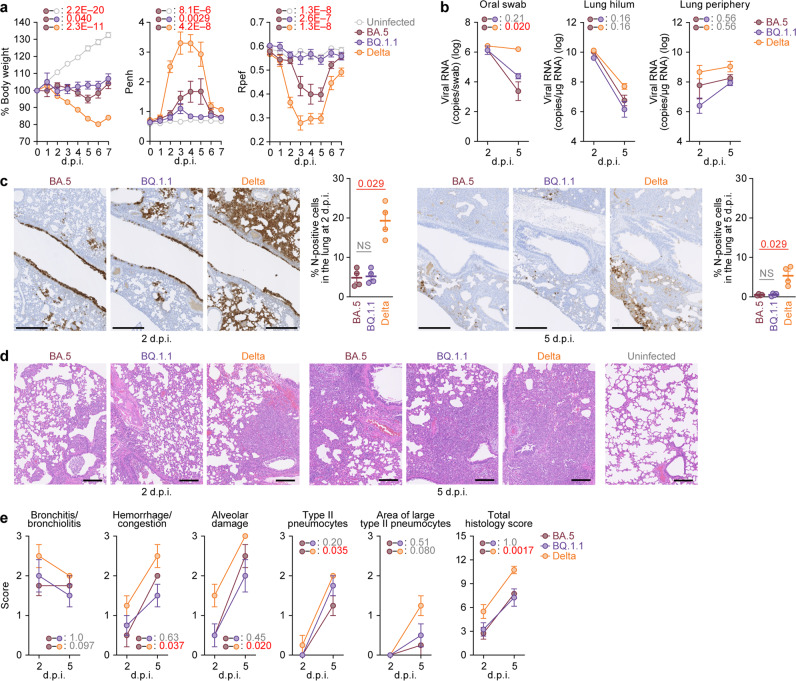
In late 2022, various Omicron subvariants emerged and cocirculated worldwide. These variants convergently acquired amino acid substitutions at critical residues in the spike protein, including residues R346, K444, L452, N460, and F486. Here, we characterize the convergent evolution of Omicron subvariants and the properties of one recent lineage of concern, BQ.1.1. Our phylogenetic analysis suggests that these five substitutions are recurrently acquired, particularly in younger Omicron lineages. Epidemic dynamics modelling suggests that the five substitutions increase viral fitness, and a large proportion of the fitness variation within Omicron lineages can be explained by these substitutions. Compared to BA.5, BQ.1.1 evades breakthrough BA.2 and BA.5 infection sera more efficiently, as demonstrated by neutralization assays. The pathogenicity of BQ.1.1 in hamsters is lower than that of BA.5. Our multiscale investigations illuminate the evolutionary rules governing the convergent evolution for known Omicron lineages as of 2022.


Conflict of interest statement

Y.Y. and T.N. are founders and shareholders of HiLung, Inc. Y.Y. is a coinventor of patents (PCT/JP2016/057254; “Method for inducing differentiation of alveolar epithelial cells”, PCT/JP2016/059786, “Method of producing airway epithelial cells”). The other authors declare that no competing interests exist.

Figures

Fig. 1
Fig. 1. Convergent evolution of Omicron lineages.
a A maximum likelihood (ML) tree of the Omicron lineages. The tree was rooted using an outgroup sequence (B.1.1). The substitutions in the S protein acquired by BA.4/BA.5, BA.2.75, and BQ.1.1 are indicated in the panel, and the five convergent substitutions are indicated in bold. Note that R493Q is a reversion. Bootstrap values, *, ≥0.85; **, ≥0.9. b Left, amino acid differences in the S proteins of Omicron lineages. The five convergent substitutions are indicated in bold. Right, amino acid differences in the non-S proteins between BA.5 and BQ.1.1. c Left, time-calibrated ML trees for BA.1, BA.2, BA.4, and BA.5. The trees for BA.2 and BA.5 include BA.2.75 and BQ.1.1 lineages, respectively. The dots indicate estimated substitution events at the convergent sites. The branch color indicates the estimated number of additional substitutions at the convergent sites compared to the most recent common ancestor of each lineage. Right, the substitution profile at the convergent sites. d, e The number of substitution events at the convergent sites detected. Raw counts (d) and counts per 1 million (M) analyzed sequences (d) are shown. Note that L452 and F486 in BA.4/5 are indicated in gray because the common ancestor of BA.4/5 harbors the L452R and F486V substitutions.
Fig. 2
Fig. 2. Fitness landscape of S proteins of Omicron lineages as of late 2022.
a Epidemic dynamics of S haplotypes in the UK. Omicron sequences were classified into 254 groups harboring unique sets of substations in the S protein, referred to as S haplotypes. S haplotypes are ordered according to the time of epidemic peak. b Effect size of each substitution in the S protein on relative effective reproduction number (Re) estimated by a hierarchal Bayesian model. The posterior mean value is shown. A group of highly co-occurred substitutions (e.g., L452R and F486V) was treated as substitution clusters. The red and blue dots indicate the substitutions with significant positive and negative effects, respectively. The representative substitutions are annotated. c Relative Re value for a viral group represented by each S haplotype, assuming a fixed generation time of 2.1 day. The posterior mean value is shown. The Re of the major S haplotype in BA.2 is set at 1. The substitution profile at the five convergent sites is shown on the left. d Prediction of the relative Re of S haplotypes in the USA using the model trained on UK data. The predicted Re and Re estimated by a simple multiple logistic model based on USA’s data were compared. The dot size indicates the number of sequences of each haplotype. The dotted line denotes a line with a slope of 1 and an intercept of 0. e Adjusted R2 value for the prediction of the Re of S haplotypes in each country. The bar color indicates the total number of sequences included in the dataset investigated. f Comparison between relative Re and the total effect of substitutions at the convergent sites on Re. Dot indicates a viral group represented by an S haplotype. The dots are colored according to the major classification of the PANGO lineage. g Change in viral fitness during BA.5 diversification. The lineages indicated with an asterisk, which includes BQ.1.1, are magnified in the right panel.
Fig. 3
Fig. 3. Immune evasion of BQ.1.1.
Neutralization assays were performed with pseudoviruses harboring the S proteins of B.1.1, BA.1, BA.2, BA.2.75, BA.5 and BQ.1.1. The BA.5 S-based derivatives are included in (a, b, eg). The following sera were used. a, b Convalescent sera from fully vaccinated individuals who had been infected with BA.2 after full vaccination (9 2-dose vaccinated and 5 3-dose vaccinated). 14 donors in total) (a), and BA.5 after full vaccination (2 2-dose vaccinated donors, 17 3-dose vaccinated donors and 1 4-dose vaccinated donor). 20 donors in total) (b). c Sera from hamsters infected with BA.2 (12 hamsters; left), BA.2.75 (12 hamsters; middle), and BA.5 (12 hamsters; right). d Principal component (PC) analysis representing the antigenicity of the S proteins. The analysis is based on the results of neutralization assays using hamster sera (c). eg 4-dose vaccine sera collected at 1 month (1mo) after the 4-dose monovalent vaccine (19 donors) (e), BA.1 bivalent vaccine (22 donors) (f), and BA.5 bivalent vaccine (21 donors) (g) Assays for each serum sample were performed in triplicate to determine the 50% neutralization titer (NT50). Each dot represents one NT50 value, and the geometric mean and 95% confidential interval (CI) are shown. Statistically significant differences were determined by two-sided Wilcoxon signed-rank tests. The P values versus BA.2 (a, c, left), BA.2.75 (c, middle), BA.5 (b, c, right) or B.1.1 (eg) are indicated in the panels. The horizontal dashed line indicates the detection limit (120-fold). Information on the convalescent donors is summarized in Supplementary Table 3.
Fig. 4
Fig. 4. Interaction between BQ.1.1 S and ACE2.
a Binding affinity of the receptor binding domain (RBD) of the SARS-CoV-2 S protein to ACE2 by yeast surface display. The dissociation constant (KD) value indicating the binding affinity of the RBD of the SARS-CoV-2 S protein to soluble ACE2 when expressed on yeast is shown. b Pseudovirus assay. HOS-ACE2/TMPRSS2 cells were infected with pseudoviruses bearing each S protein. The amount of input virus was normalized based on the amount of HIV-1 p24 capsid protein. The percent infectivity compared to that of the virus pseudotyped with the BA.2 S protein are shown. c, Fold increase in pseudovirus infectivity based on TMPRSS2 expression. df The BQ.1.1 RBD bound to ACE2 trapped in the closed conformation. d Crystal structure of the BQ.1.1 RBD-human ACE2 complex. Characteristic substitutions in the BQ.1.1 RBD and an N-linked glycan on N90 of human ACE2 are shown in purple and gray sticks. In the close-up view, corresponding residues in the BA.4/5 RBD-human ACE2 complex structure (PDB: 7XWA) are also shown in brown sticks. The BQ.1.1 RBD and ACE2 residues recognizing the glycan are shown in stick representation. Dashed lines represent hydrogen bonds. e Superimposition of the BQ.1.1 RBD-human ACE2 complex structure (purple) onto previously reported structures of SARS-CoV-2 RBD bound to human ACE2. BQ.1.1, purple; BA.2, pale green, PDB: 7ZF7; BA.2.75, khaki, PDB: 8ASY; BA.5, brown, PDB: 7XWA. BA.2, BA.2.75. BA.5 are shown as transparent. f Superimposition of the BQ.1.1 RBD-human ACE2 complex structure (purple) onto a previously reported structure of an inhibitor bound human ACE2 (pale yellow, PDB: 1R4L). Assays were performed in triplicate (a) or quadruplicate (b). The presented data are expressed as the average ± standard deviation (SD) (ac). Each dot indicates the result of an individual replicate. The dashed horizontal lines indicate the value of BA.5. Statistically significant differences versus each parental S protein and those between BA.5 and BQ.1.1 were determined by two-sided Student’s t tests.
Fig. 5
Fig. 5. Virological characteristics of BQ.1.1 in vitro.
a, b S-based fusion assay in Calu-3 cells. The recorded fusion activity (arbitrary units) is shown. The dashed green line (a) and the dashed brown line (b) indicate the results of BA.2 and BA.5, respectively. The red number in each panel indicates the fold difference between BA.2 (a) or BA.5 (b) and the derivative tested at 24 h post coculture. ci Growth kinetics of BQ.1.1. Clinical isolates of BA.2, BA.5, BQ.1.1 and Delta (only in i) were inoculated into Vero cells (c), VeroE6/TMPRSS2 cells (d), Calu-3 cells (e), the human airway organoid-derived air-liquid interface (AO-ALI) system (f), human induced pluripotent stem cell (iPSC)-derived alveolar epithelial cells (g), iPSC-derived airway epithelial cells (h), and an airway-on-a-chip system (i). h.p.i., hours post-infection; d.p.i., days post-infection. The copy numbers of viral RNA in the culture supernatant (c–e), the apical sides of cultures (fi), and the top (i, left) and bottom (i, middle) channels of an airway-on-a-chip were routinely quantified by RT–qPCR. In (i, right), the percentage of viral RNA load in the bottom channel per top channel during 3–6 d.p.i. (i.e., the % invaded virus from the top channel to the bottom channel) is shown. Assays were performed in triplicate (i) or quadruplicate (ah). The presented data are expressed as the average ± standard deviation (SD) (a, b) or standard error of mean (SEM) (ci). Statistically significant differences versus BA.2 (a) and BA.5 (bi) across timepoints were determined by multiple regression. The familywise error rates (FWERs) calculated using the Holm method are indicated in the figures. NA, not applicable.
Fig. 6
Fig. 6. Virological characteristics of BQ.1.1 in vivo.
Syrian hamsters were intranasally inoculated with BA.5, BQ.1.1 and Delta. Six hamsters of the same age were intranasally inoculated with saline (uninfected). Six hamsters per group were used to routinely measure the respective parameters (a). Four hamsters per group were euthanized at 2 and 5 days post-infection (d.p.i.) and used for virological and pathological analysis (be). a Body weight, enhanced pause (Penh), and the ratio of time to peak expiratory flow relative to the total expiratory time (Rpef) values of infected hamsters (n = 6 per infection group). b (Left) Viral RNA loads in the oral swab (n = 6 per infection group). (Middle and right) Viral RNA loads in the lung hilum (middle) and lung periphery (right) of infected hamsters (n = 4 per infection group). c Immunohistochemical (IHC) analysis of the viral N protein in the lungs at 2 d.p.i. (left) and 5 d.p.i. (right) of infected hamsters. Representative Figures (N-positive cells are shown in brown) and the percentage of N-positive cells in whole lung lobes (n = 4 per infection group) are shown. NS, not significant. The raw data are shown in Supplementary Fig. 4b. d, e Haematoxylin and eosin (H&E) staining of the lungs of infected hamsters. Representative figures are shown in (d). Uninfected lung alveolar space and bronchioles are also shown. e Histopathological scoring of lung lesions (n = 4 per infection group). Representative pathological features are reported in our previous studies,,,,. In (ac,e), data are presented as the average ± standard error of mean (SEM). In (c), each dot indicates the result of an individual hamster. In (a, b), and (e), statistically significant differences between BA.5 and other variants across timepoints were determined by multiple regression. In (a), the 0 d.p.i. data were excluded from the analyses. The familywise error rates (FWERs) calculated using the Holm method are indicated in the figures. In (c), the statistically significant differences between BA.5 and other variants were determined by a two-sided Mann–Whitney U test. In (c, d), each panel shows a representative result from an individual infected hamster. Scale bars, 500 μm (c); 200 μm (d).

References

    1. WHO. Tracking SARS-CoV-2 variants (March 30, 2023) https://www.who.int/en/activities/tracking-SARS-CoV-2-variants (2022).
    1. Saito A, et al. Virological characteristics of the SARS-CoV-2 Omicron BA.2.75 variant. Cell Host Microbe. 2022;30:1540–1555.e1515. doi: 10.1016/j.chom.2022.10.003. - DOI - PMC - PubMed
    1. Wang, Q. et al. Antibody evasion by SARS-CoV-2 Omicron subvariants BA.2.12.1, BA.4, & BA.5. Nature10.1038/s41586-022-05053-w (2022). - PMC - PubMed
    1. Tuekprakhon A, et al. Antibody escape of SARS-CoV-2 Omicron BA.4 and BA.5 from vaccine and BA.1 serum. Cell. 2022;185:2422–2433 e2413. doi: 10.1016/j.cell.2022.06.005. - DOI - PMC - PubMed
    1. Cao, Y. et al. BA.2.12.1, BA.4 and BA.5 escape antibodies elicited by Omicron infection. Nature10.1038/s41586-022-04980-y (2022). - PMC - PubMed

Publication types