. 2023 May 12;8(1):184.
doi: 10.1038/s41392-023-01402-x.

A kidney-brain neural circuit drives progressive kidney damage and heart failure

Affiliations

A kidney-brain neural circuit drives progressive kidney damage and heart failure

Wei Cao et al. Signal Transduct Target Ther. .

Abstract

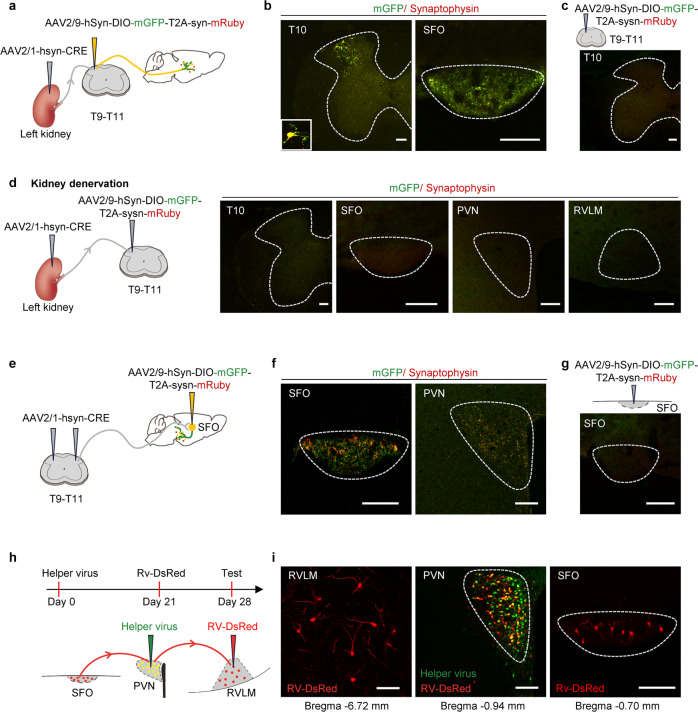
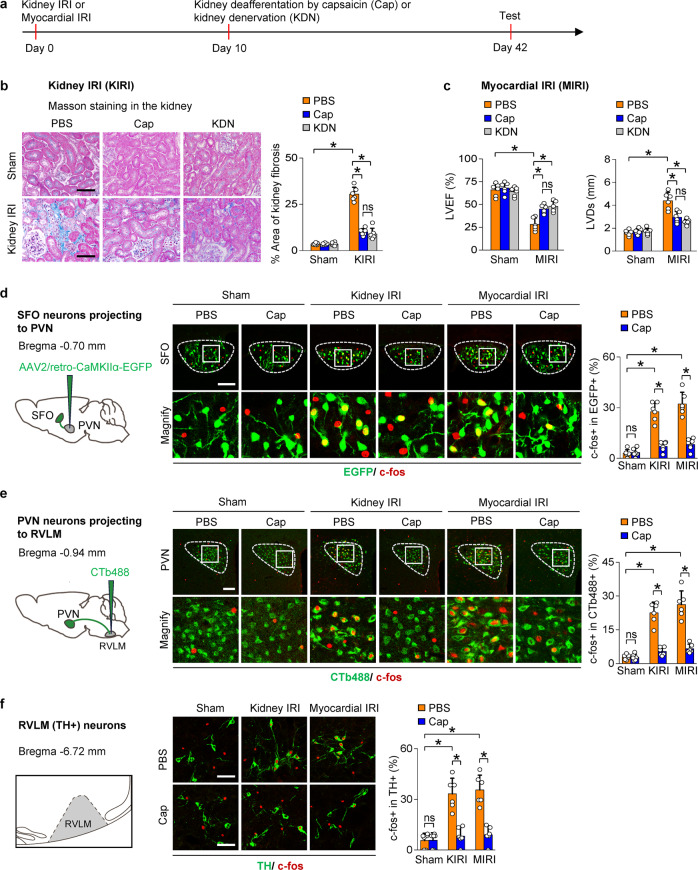
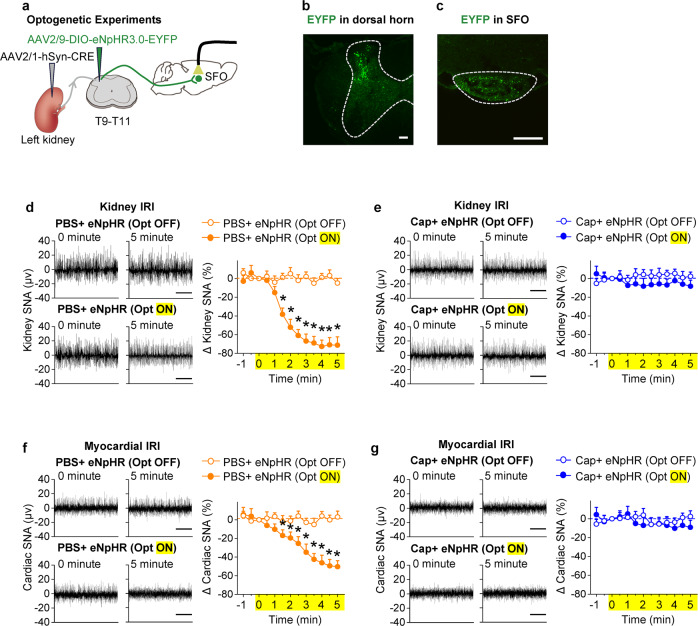
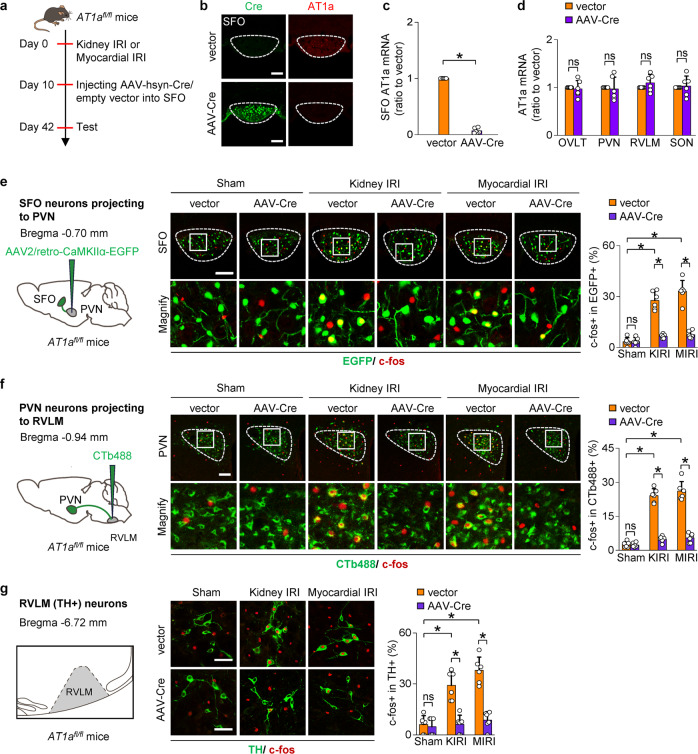
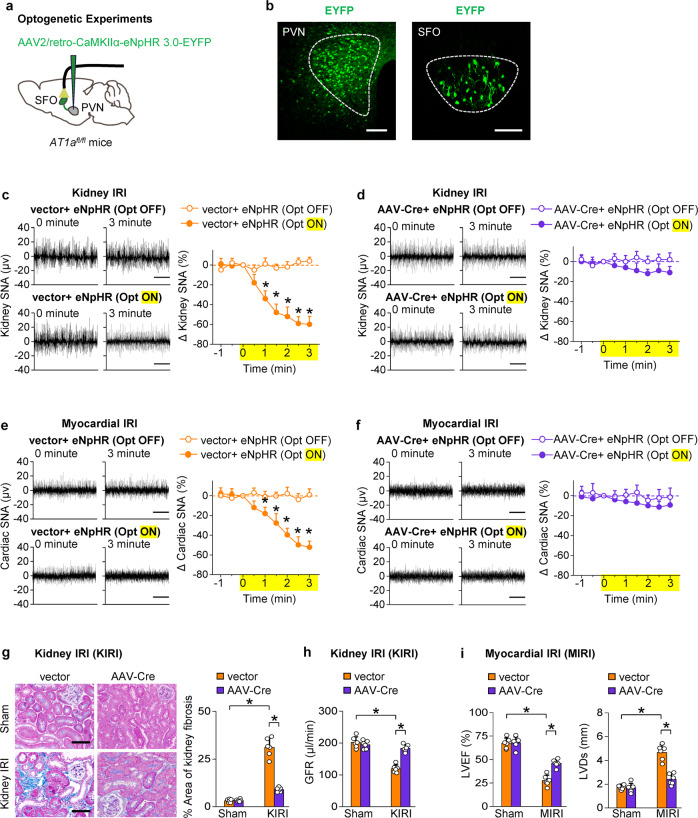
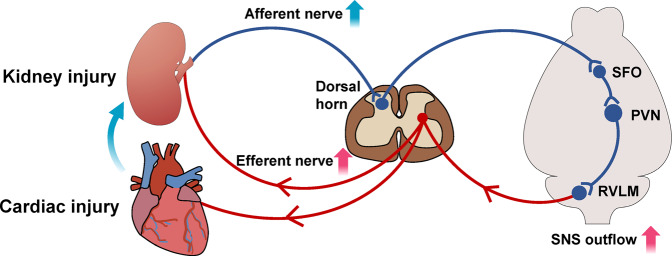
Chronic kidney disease (CKD) and heart failure (HF) are highly prevalent, aggravate each other, and account for substantial mortality. However, the mechanisms underlying cardiorenal interaction and the role of kidney afferent nerves and their precise central pathway remain limited. Here, we combined virus tracing techniques with optogenetic techniques to map a polysynaptic central pathway linking kidney afferent nerves to subfornical organ (SFO) and thereby to paraventricular nucleus (PVN) and rostral ventrolateral medulla that modulates sympathetic outflow. This kidney-brain neural circuit was overactivated in mouse models of CKD or HF and subsequently enhanced the sympathetic discharge to both the kidney and the heart in each model. Interruption of the pathway by kidney deafferentation, selective deletion of angiotensin II type 1a receptor (AT1a) in SFO, or optogenetic silence of the kidney-SFO or SFO-PVN projection decreased the sympathetic discharge and lessened structural damage and dysfunction of both kidney and heart in models of CKD and HF. Thus, kidney afferent nerves activate a kidney-brain neural circuit in CKD and HF that drives the sympathetic nervous system to accelerate disease progression in both organs. These results demonstrate the crucial role of kidney afferent nerves and their central connections in engaging cardiorenal interactions under both physiological and disease conditions. This suggests novel therapies for CKD or HF targeting this kidney-brain neural circuit.


Conflict of interest statement

The authors declare no competing interests.

Figures

Fig. 1
Fig. 1
Kidney afferent nerves drive a kidney-to-brain neural circuit in normal mice. a, b Schematic for labeling presynaptic terminals of dorsal horn neurons that receive kidney afferent input a. Representative image shows injection site in the dorsal horn at T10 level (b, left). The representative image shows substantial presynaptic terminals of these dorsal horn neurons in the SFO (b, right). Scale bar, 100 µm. c Schematic for injection of AAV2/9-hSyn-DIO-mGFP-T2A-sysn-mRuby into the dorsal horn at T9-T11 level alone (upper). The representative image shows no labeled neurons observed in dorsal horn after virus injection (down). Scale bar, 100 µm. d Normal mice were subjected to kidney denervation before the virus injection (left). The representative image shows no labeling of dorsal horn neurons at T10 level, and no labeling of terminals of dorsal horn neurons in SFO, PVN, and RVLM post-virus injection in these mice (right). Scale bar, 100 µm. e, f Schematic for labeling terminals of SFO neurons that receive kidney spinal afferent input e. The representative image shows the injection site in the SFO (f, left). The representative image shows substantial presynaptic terminals of these SFO neurons in the PVN (f, right). Scale bar, 100 µm. g Schematic for injection of AAV2/9-hSyn-DIO-mGFP-T2A-sysn-mRuby into the SFO alone (upper). The representative image shows no labeled neurons observed in the SFO after virus injection (down). Scale bar, 100 µm. h, i Schematic for labeling direct innervation of SFO in RVLM-projecting PVN neurons h. Representative images showing DsRed-labeled neurons in RVLM, double-infected relay neurons in PVN, and DsRed-labeled neurons in SFO i. Scale bar, 100 µm. Error bars, mean ± SD. n = 3 in each experiment. Abbreviations for brain regions: SFO, subfornical organ (Bregma −0.70 mm); PVN paraventricular nucleus (Bregma −0.94 mm); RVLM rostral ventrolateral medulla (Bregma −6.72 mm)
Fig. 2
Fig. 2
Increase in kidney afferent input drives SFO-PVN-RVLM pathway to promotes progressive kidney and cardiac dysfunction after injury. a Experimental models of CKD are induced by kidney IRI (KIRI), while experimental models of HF are induced by myocardial IRI (MIRI). Selective kidney deafferentation by capsaicin (Cap) or surgical ablation of kidney nerves (KDN) was performed on day 10 after KIRI or MIRI. b Kidney fibrosis determined by Masson staining in KIRI mice: representative images and quantitative data. Scale bar, 100 µm. c Left ventricular ejection fraction (LVEF, left) and LV systolic dimension (LVDs, right) in MIRI mice. d Retrograde labeling of SFO neurons projecting to PVN using AAV2/retro-CaMKIIα-EGFP (left). C-fos expression in EGFP-labelled SFO neurons (right): representative images and percentage of c-fos+ cells in EGFP + cells. Scale bar, 100 µm. e Retrograde labeling of PVN neurons projecting to RVLM using CTb-488 (left). C-fos expression in CTb-488-labelled PVN neurons(right): representative images and percentage of c-fos+ cells in CTb-488+ cells. Scale bar, 100 µm. f Schematic of RVLM (left). Immunostaining of c-fos and TH in RVLM (right): representative images and percentage of c-fos+ cells in TH + cells. scale bar, 50 µm. ns, not significant. *, P < 0.001. Error bars, mean ± SD (n = 6 in each group). One-way ANOVA or t test with Bonferroni correction
Fig. 3
Fig. 3
Increase in kidney afferent input drives SFO-PVN-RVLM pathway to enhance sympathetic discharge in CKD and HF. a Experimental design: we optically silenced the kidney-SFO projection in both models using third-generation Natronomonas halorhodopsin (eNpHR 3.0), a yellow-light-drivable proton pump, while simultaneously recording sympathetic nerve activity (SNA) in the kidney or heart. b Representative image of injection site in the dorsal horn at the T10 level. Scale bar, 100 µm. c Representative image of EYFP-positive dorsal horn neuronal terminals in the SFO. Scale bar, 100 µm. d Changes of kidney SNA in KIRI mice treated with PBS, with (Opt ON) or without (Opt OFF) optical silence. e Changes of kidney SNA in KIRI mice treated with Cap, in condition of Opt ON or Opt OFF. f Changes of cardiac SNA in MIRI mice treated with PBS, in condition of Opt ON or Opt OFF. g Changes of cardiac SNA in MIRI mice treated with Cap, in condition of Opt ON or Opt OFF. Scale bar, 2 s in dg. The value at 0 min was set to zero on the ordinate, and changes from zero were shown as % changes in sympathetic nerve activity. *, P < 0.05 versus Opt OFF. ns, not significant. Error bars, mean ± SD (n = 6 in each group). One-way ANOVA or t test with Bonferroni correction
Fig. 4
Fig. 4
Kidney afferent inflow in CKD and HF activates RAS in SFO. a Immunostaining of c-fos with AGT or Ang II in SFO of kidney IRI (KIRI) or myocardial IRI (MIRI) mice. Scale bar, 100 µm. b Quantitative analysis of AGT + (left) and Ang II + (right) cells in SFO. c Percentage of AGT + (left) or Ang II + (right) cells in c-fos+ cells in SFO. df Level of AGT mRNA d, Ang II protein e, and AT1a mRNA f in homogenates of SFO from KIRI or MIRI mice. g Plasma Ang II level in KIRI or MIRI mice. h, i Binding of CRTC1 with phosphorylated CREB in SFO of KIRI h or MIRI i mice. ns not significant. *, P < 0.001. Error bars, mean ± SD (n = 6 in each group). One-way ANOVA or t test with Bonferroni correction
Fig. 5
Fig. 5
Activation of SFO-PVN-RVLM pathway in CKD and HF depends on activation of RAS in SFO. a Deletion of AT1a in SFO is achieved by injection of AAV2/9-Cre into SFO of AT1afl/fl mice on day 10 after kidney IRI (KIRI) or myocardial IRI (MIRI). bd Representative images show immunostaining of Cre and in situ hybridization of AT1a mRNA in the SFO of AT1afl/fl mouse treated with AAV-Cre or empty vector b. Scale bar, 100 µm. The mRNA expression of AT1a is determined in homogenates of SFO c, OVLT, PVN, RVLM, and SON d. e Retrograde labeling of SFO neurons projecting to PVN using AAV2/retro-CaMKIIα-EGFP. C-fos expression in EGFP-labelled SFO neurons: representative images and percentage of c-fos+ cells in EGFP + cells. Scale bar, 100 µm. f Retrograde labeling of PVN neurons projecting to RVLM using CTb-488. C-fos expression in CTb-488-labelled PVN neurons: representative images and percentage of c-fos+ cells in CTb-488+ cells. Scale bar, 100 µm. g Schematic of RVLM. Immunostaining of c-fos and TH in RVLM: representative images and percentage of c-fos+ cells in TH + cells. Scale bar, 50 µm. *P < 0.001. ns, not significant. Error bars, mean ± SD (n = 6 in each group). One-way ANOVA or t test with Bonferroni correction
Fig. 6
Fig. 6
Activation of the SFO RAS enhance sympathetic discharge and promotes progressive kidney and cardiac dysfunction after injury. a Schematic showing optogenetic silence of SFO neurons projecting to PVN with simultaneous recording of sympathetic nerve activity (SNA) in the kidney or heart. b Representative image of injection site in the PVN (left), and representative image of EYFP-positive neurons in SFO (right). Scale bar, 100 µm. c Changes of kidney SNA in KIRI mice treated with empty vector, in condition of Opt ON or Opt OFF. *P < 0.05 versus Opt OFF. d Changes of kidney SNA in AT1a-deleted KIRI mice, in condition of Opt ON or Opt OFF. e Changes of cardiac SNA in MIRI mice treated with empty vector, in condition of Opt ON or Opt OFF. *P < 0.05 versus Opt OFF. f Changes of cardiac SNA in AT1a-deleted MIRI mice, in condition of Opt ON or Opt OFF. g Kidney fibrosis determined by Masson staining in KIRI mice: representative images (scale bar, 100 µm) and quantitative data. *, P < 0.001. h GFR in KIRI mice. i Left ventricular ejection fraction (LVEF, left) and LV systolic dimension (LVDs, right) in MIRI mice. Scale bar in cf, 2 s. The value at 0 min is set to zero in cf. *, P < 0.001. ns, not significant. Error bars, mean ± SD (n = 6 in each group). One-way ANOVA or t test with Bonferroni correction
Fig. 7
Fig. 7
Schematic diagram summarizing a polysynaptic central neuronal pathway that links activated kidney sensory nerves to neurons in SFO-PVN-RVLM pathway to control the sympathetic outflow. This kidney-brain neural circuit is overactivated in both experimentally induced CKD and HF, and drives the sympathetic nervous system (SNS) to accelerate disease progression in both organs. [created with Adobe Illustrator (Adobe, San Jose, CA)]

References

    1. McCullough PA, et al. Confirmation of a heart failure epidemic: findings from the Resource Utilization Among Congestive Heart Failure (REACH) study. J Am Coll Cardiol. 2002;39:60–69. doi: 10.1016/S0735-1097(01)01700-4. - DOI - PubMed
    1. Spahillari A, et al. Ideal cardiovascular health, cardiovascular remodeling, and heart failure in blacks: the jackson heart study. Circulation. Heart failure. 2017;10:e003682. doi: 10.1161/CIRCHEARTFAILURE.116.003682. - DOI - PMC - PubMed
    1. McCullough PA, Bakris GL, Owen WF, Jr., Klassen PS, Califf RM. Slowing the progression of diabetic nephropathy and its cardiovascular consequences. Am. Heart J. 2004;148:243–251. doi: 10.1016/j.ahj.2004.03.042. - DOI - PubMed
    1. Pitt B, et al. Cardiovascular events with finerenone in kidney disease and type 2 diabetes. N. Engl. J. Med. 2021;385:2252–2263. doi: 10.1056/NEJMoa2110956. - DOI - PubMed
    1. Damman K, Voors AA, Navis G, van Veldhuisen DJ, Hillege HL. The cardiorenal syndrome in heart failure. Prog. Cardiovasc. Dis. 2011;54:144–153. doi: 10.1016/j.pcad.2011.01.003. - DOI - PubMed

Publication types