. 2023 May 11;13(1):7648.
doi: 10.1038/s41598-023-34571-4.

3D melanoma spheroid model for the development of positronium biomarkers

Affiliations

3D melanoma spheroid model for the development of positronium biomarkers

Hanieh Karimi et al. Sci Rep. .

Abstract

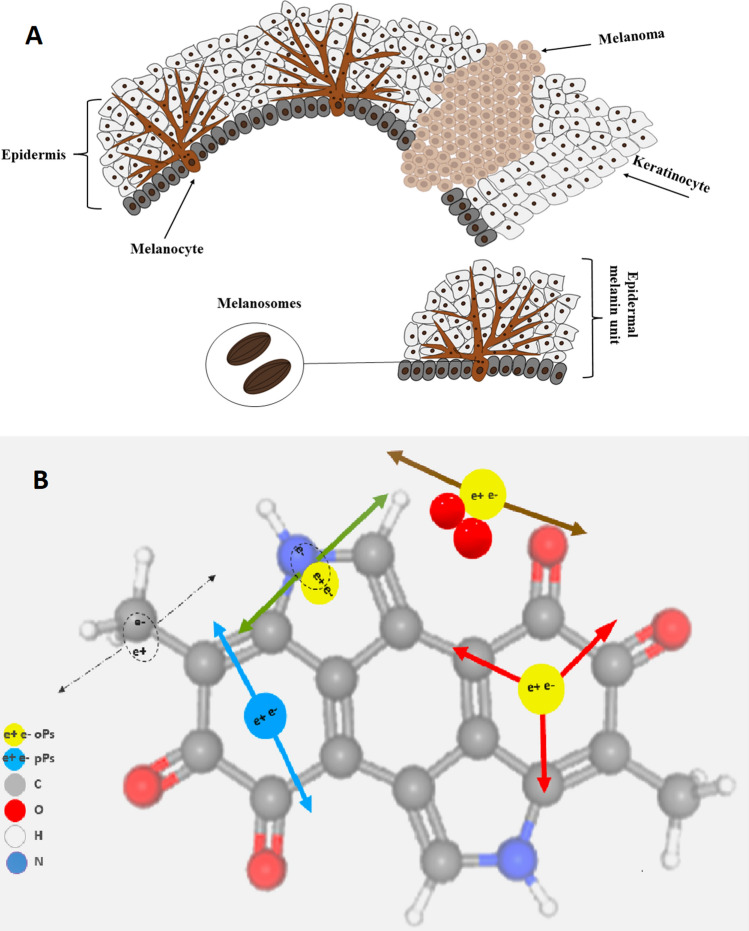
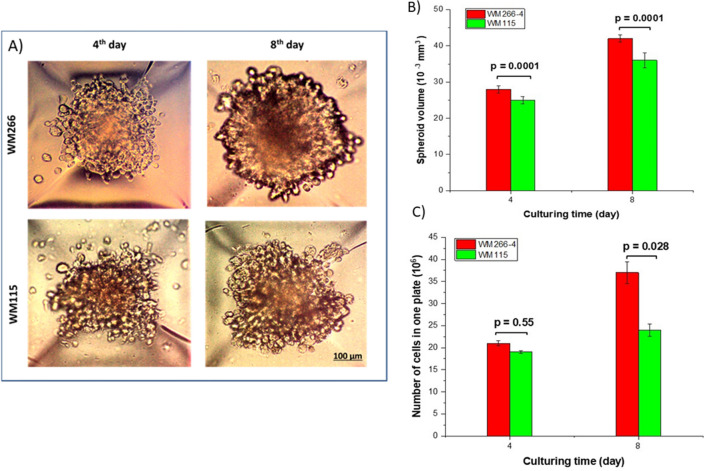
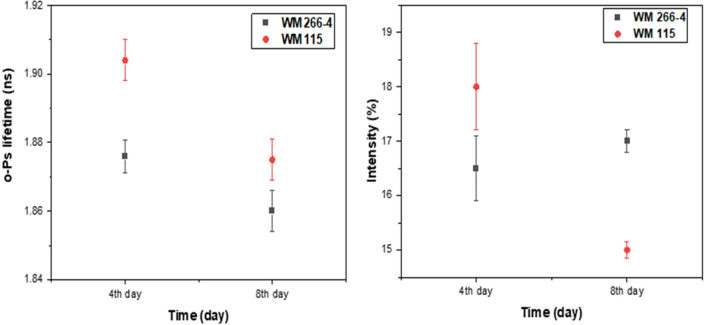
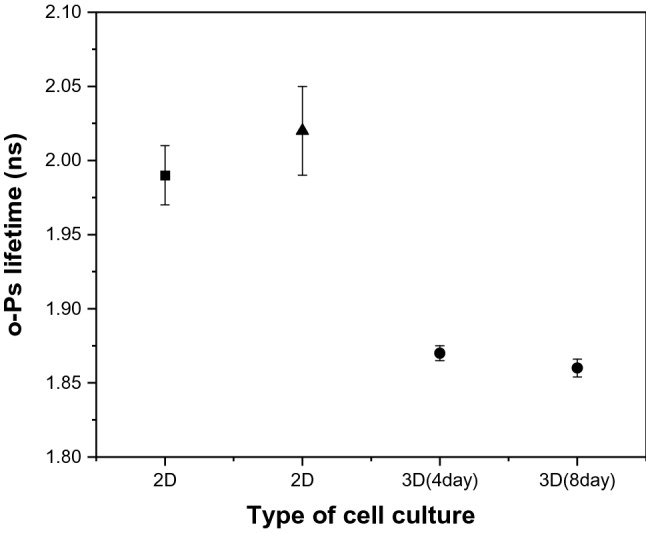
It was recently demonstrated that newly invented positronium imaging may be used for improving cancer diagnostics by providing additional information about tissue pathology with respect to the standardized uptake value currently available in positron emission tomography (PET). Positronium imaging utilizes the properties of positronium atoms, which are built from the electrons and positrons produced in the body during PET examinations. We hypothesized that positronium imaging would be sensitive to the in vitro discrimination of tumor-like three-dimensional structures (spheroids) built of melanoma cell lines with different cancer activities and biological properties. The lifetime of ortho-positronium (o-Ps) was evaluated in melanoma spheroids from two cell lines (WM266-4 and WM115) differing in the stage of malignancy. Additionally, we considered parameters such as the cell number, spheroid size and melanoma malignancy to evaluate their relationship with the o-Ps lifetime. We demonstrate pilot results for o-Ps lifetime measurement in extracellular matrix-free spheroids. With the statistical significance of two standard deviations, we demonstrated that the higher the degree of malignancy and the rate of proliferation of neoplastic cells, the shorter the lifetime of ortho-positronium. In particular, we observed the following indications encouraging further research: (i) WM266-4 spheroids characterized by a higher proliferation rate and malignancy showed a shorter o-Ps lifetime than WM115 spheroids characterized by a lower growth rate. (ii) Both cell lines showed a decrease in the lifetime of o-Ps after spheroid generation on day 8 compared to day 4 in culture, and the mean o-Ps lifetime was longer for spheroids formed from WM115 cells than for those formed from WM266-4 cells, regardless of spheroid age. The results of this study revealed that positronium is a promising biomarker that may be applied in PET diagnostics for the assessment of the degree of cancer malignancy.


Conflict of interest statement

The authors declare no competing interests.

Figures

Figure 1
Figure 1
Schematic view of melanocytes and the formation of a melanoma lesion in the epidermal layer. (A) Normal melanocytes have a regular dendritic shape and form many branching processes extending between numerous keratinocytes (left). One melanocyte reaches between 36 and 40 keratinocytes, forming an epidermal melanin unit (EMU), with a balanced proportion of one melanocyte to each of 8–10 keratinocytes in the basal layer of the epidermis. In a melanoma lesion (right), melanocytes lose their dendricity and become malignant and amoeboid in shape, changing their cell–cell contacts by expressing different adhesion molecules (N-cadherin instead of E-cadherin expressed by melanocytes). Melanosomes store the melanin granules produced by melanocytes, which can be distributed among surrounding keratinocytes to protect them from UV radiation damage. (B) Pictorial illustrations of positron annihilations in the melanin molecule. Carbon, oxygen, hydrogen, nitrogen, p-Ps and o-Ps atoms are indicated in colours explained in the legend. Dashed arrows indicate photons from direct electron–positron annihilation. Red arrows indicate photons from o-Ps atom self-annihilation. Blue arrows show photons from p-Ps self-annihilation. Green and brown arrows indicate o-Ps decay via the pick-off and conversion processes, respectively.
Figure 2
Figure 2
Workflow for investigation of spheroid viability after harvesting 3D spheroids from 5D microplates.
Figure 3
Figure 3
Spheroids surrounding the 22Na source are located in the dedicated chamber between two BaF2 detectors. Spheroids are adjacent to the 22Na source, and there is no space or bubble between them. For each measurement, 106 events with the coincident registration of 511 keV photons and 1274 keV photons were collected.
Figure 4
Figure 4
Example positronium lifetime spectrum. Experimental data (black histogram) with superimposed histograms resulting from the fit of the sum of the exponential function convoluted with the detector resolution, performed by means of the PALS Avalanche program,. The first component (yellow line) shows the contribution from p-Ps (mean lifetime: 0.125 ns), the second component (green line) originates from annihilations in the source (Kapton foil) (0.374 ns), the third component (light blue) shows the free annihilation lifetime (0.395 ns), and the fourth component (dark blue) illustrates the contribution from o-Ps. The sum of all contributions resulting from the fit is shown as a red curve.
Figure 5
Figure 5
Comparison of spheroids from different melanoma cell lines. (A) Microscopic images of two different cell lines, WM266-4 and WM115, on days 4 and 8 of culturing. The density and circularity of spheroids increased during the culture time. (B) As a function of culturing time, WM266-4 spheroids showed a higher volume than WM115 spheroids. (C) The number of cells in the plate was increased during the culture time for both cell lines. The number of cells in one plate was calculated using the Luna II cell counter after spheroid harvesting.
Figure 6
Figure 6
Determination of glucose distribution in melanoma spheroids. Glucose concentration is observed equally distributed in the proliferation rim in WM266-4 spheroids (A) and more dispersed WM115 cell lines (B) with significant differences in the larger and older spheroids. Plot of glucose distribution in WM266-4 (C) and WM115 (D) spheroids at two different culture time points as assessed with the 2-NBDG probe.
Figure 7
Figure 7
Determination of hypoxia progression in melanoma spheroids. The hypoxic region is observed in the center of spheroids in (A) WM266-4 and (B) WM115 cell lines with significant differences in the larger and older spheroids. Plot of hypoxia distribution in WM266-4 (C) and WM115 (D) spheroids at two different culture time points as assessed with the Image-IT™ Green Hypoxia probe.
Figure 8
Figure 8
Comparison of the mean o-Ps lifetime and intensity for different melanoma cell lines. (Left) The lifetime of o-Ps in WM266-4 (black squares) and WM115 (red dots) spheroids in two different ages, 4 and 8 days after cell seeding. (Right) Intensity of o-Ps production in WM266-4 spheroids (black squares) and WM115 spheroids (red dots) as a function of time. To compare the mean o-Ps in relation to spheroid metabolism, please see supplementary file 1.
Figure 9
Figure 9
Comparison of mean positronium lifetime in 2D and 3D cell culture of melanoma. The lifetime of o-Ps in WM266-4 2D cell culture (black square) according to Ref., the lifetime of o-Ps in WM266-4 2D cell culture (black triangle), and the lifetime of o-Ps in WM266-4 3D cell culture (black dots) show the o-Ps lifetime in spheroids of two different ages, 4 and 8 days after cell seeding.

References

    1. Stępień E, Karimi H, Leszczyński B, Szczepanek M. Melanoma spheroids as a model for cancer imaging study. Acta Phys. Pol. B. 2020;51:159–164. doi: 10.5506/APhysPolB.51.159. - DOI
    1. Kapałczyńska M, Kolenda T. 2D and 3D cell cultures—A comparison of different types of cancer cell cultures. Arch. Med. Sci. 2018;14:910–919. - PMC - PubMed
    1. Kunz-Schughart LA, Kreutz M, Knuechel R. Multicellular spheroids: A three-dimensional in vitro culture system to study tumour biology. Int. J. Exp. Pathol. 1998;79:1–23. doi: 10.1046/j.1365-2613.1998.00051.x. - DOI - PMC - PubMed
    1. Vörsmann H, Groeber F, Walles H, Busch S, Beissert S, Walczak H, Kulms D. Development of a human three-dimensional organotypic skin-melanoma spheroid model for in vitro drug testing. Cell Death Dis. 2013;4:e719. doi: 10.1038/cddis.2013.249. - DOI - PMC - PubMed
    1. Lagies S, Schlimpert M, Neumann S, Wäldin A, Kammerer B, Borner C, Peintner L. Cells grown in three-dimensional spheroids mirror in vivo metabolic response of epithelial cells. Commun. Biol. 2020;3(1):246. doi: 10.1038/s42003-020-0973-6. - DOI - PMC - PubMed

Publication types