. 2023 May;4(5):648-664.
doi: 10.1038/s43018-023-00556-5. Epub 2023 May 11.

GAP43-dependent mitochondria transfer from astrocytes enhances glioblastoma tumorigenicity

Affiliations

GAP43-dependent mitochondria transfer from astrocytes enhances glioblastoma tumorigenicity

Dionysios C Watson et al. Nat Cancer. 2023 May.

Abstract

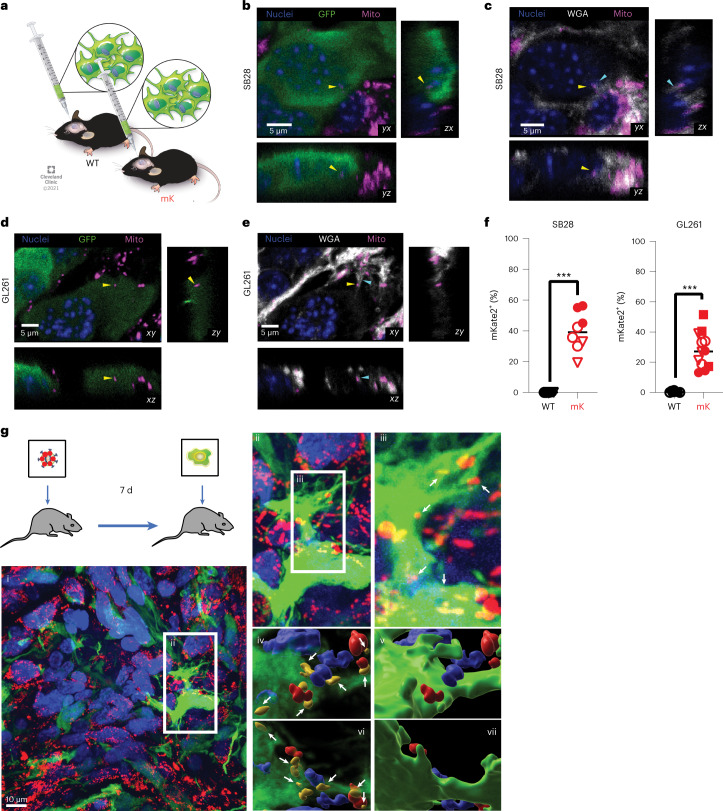
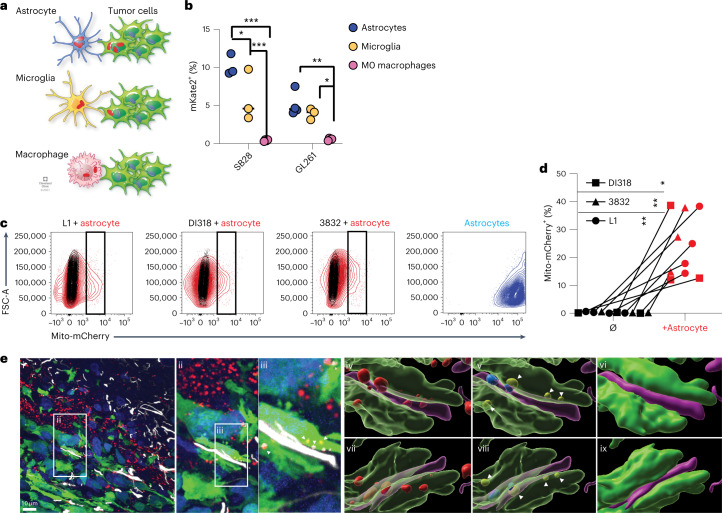
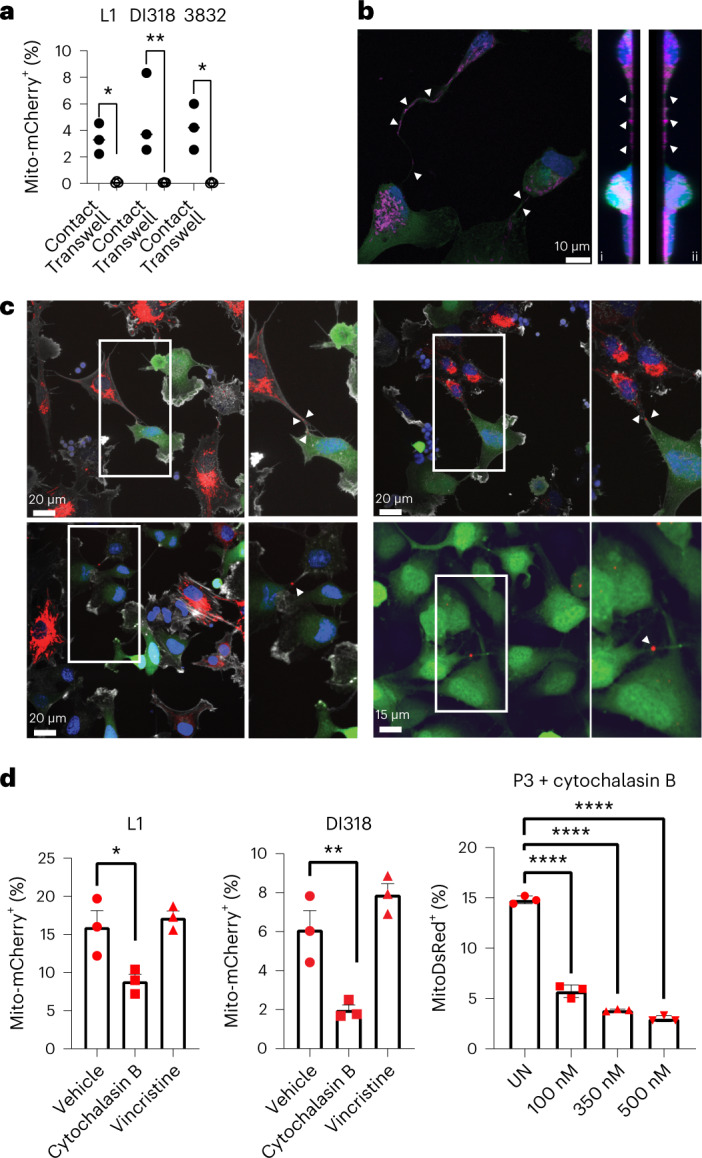
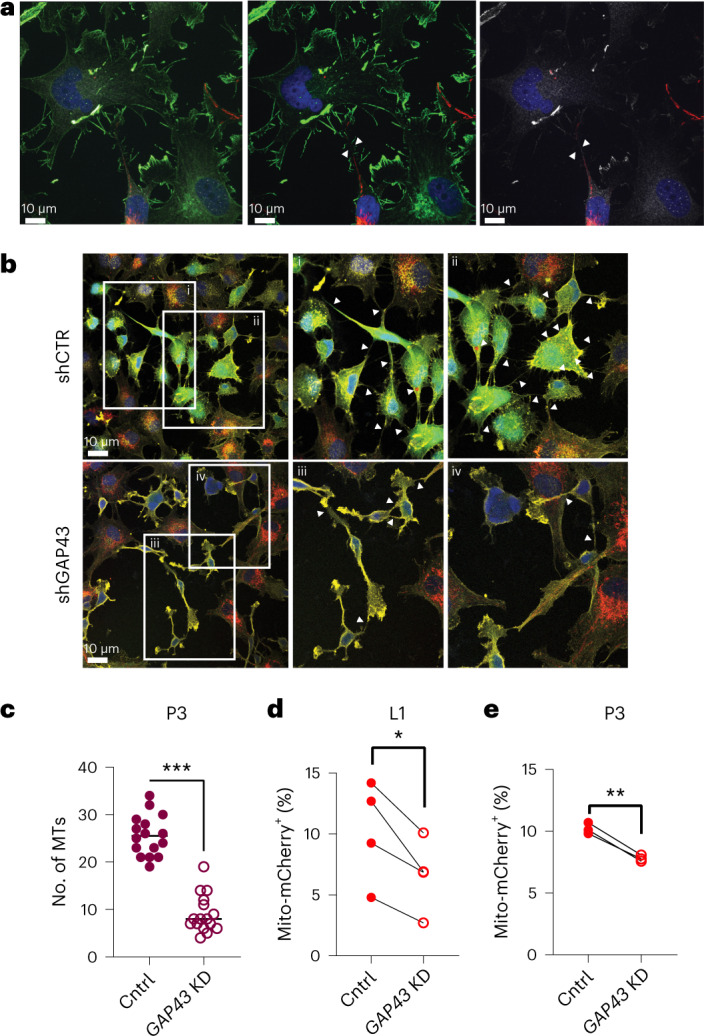
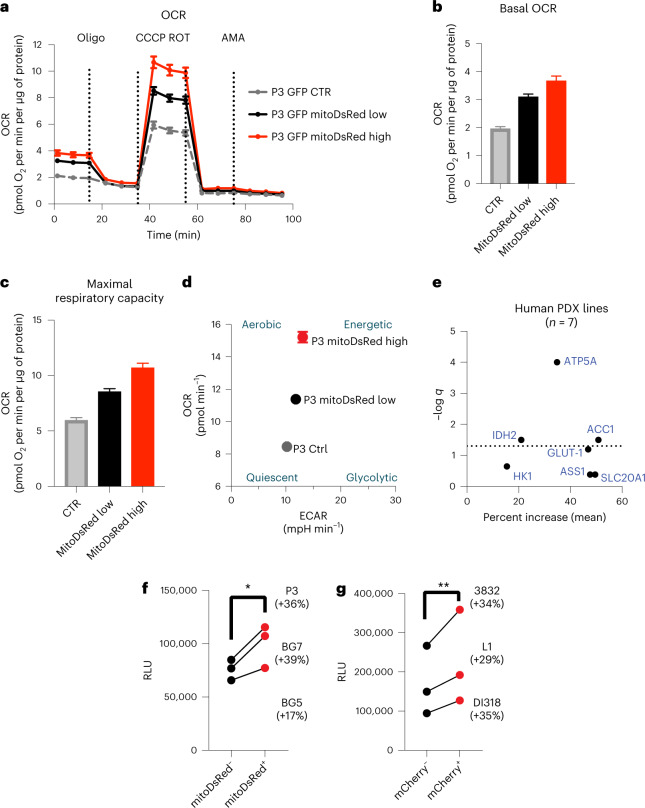
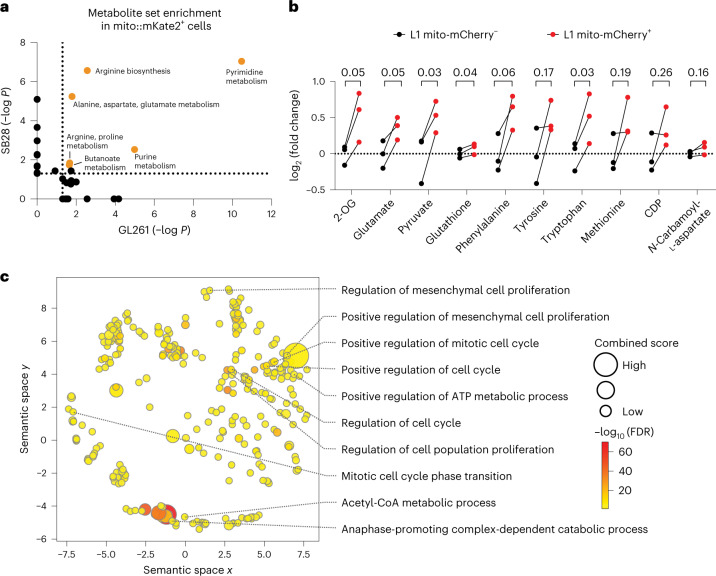
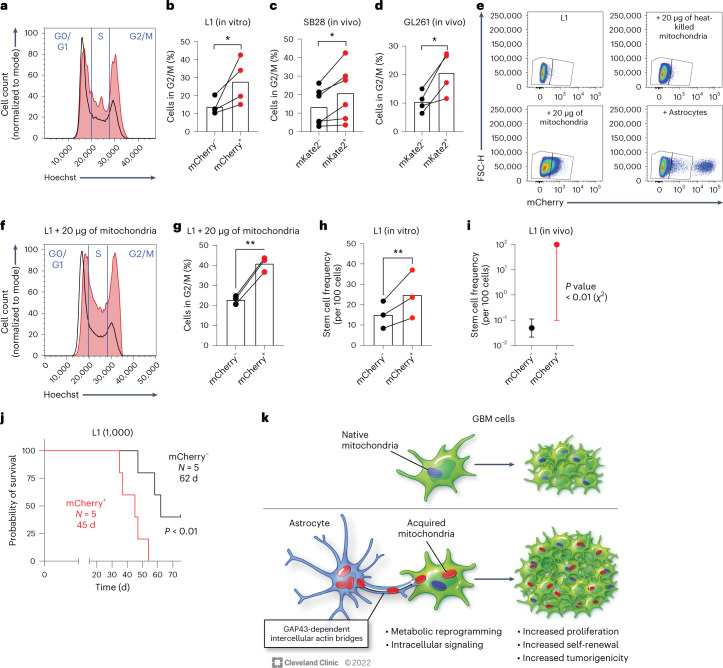
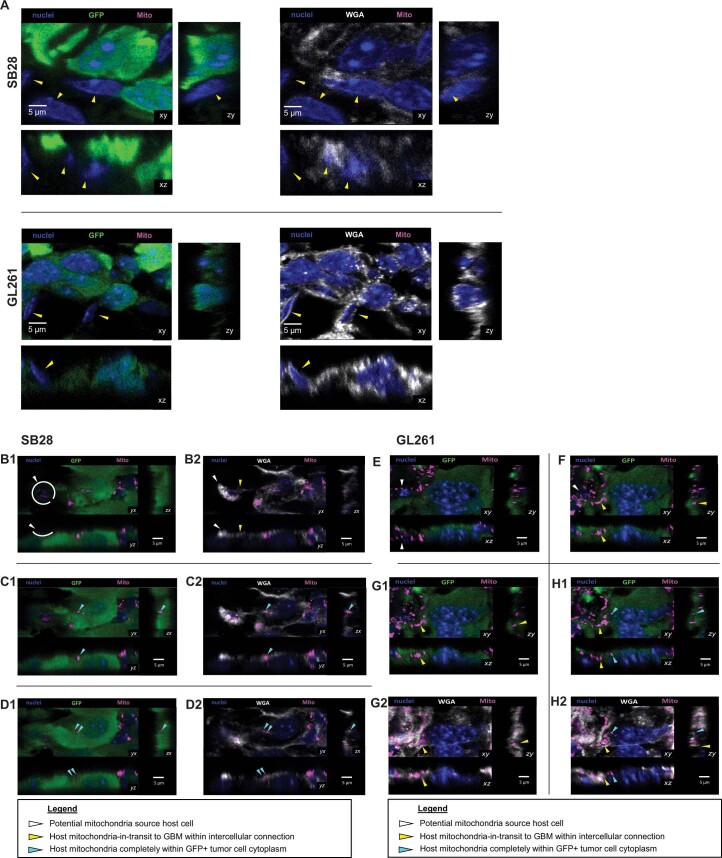
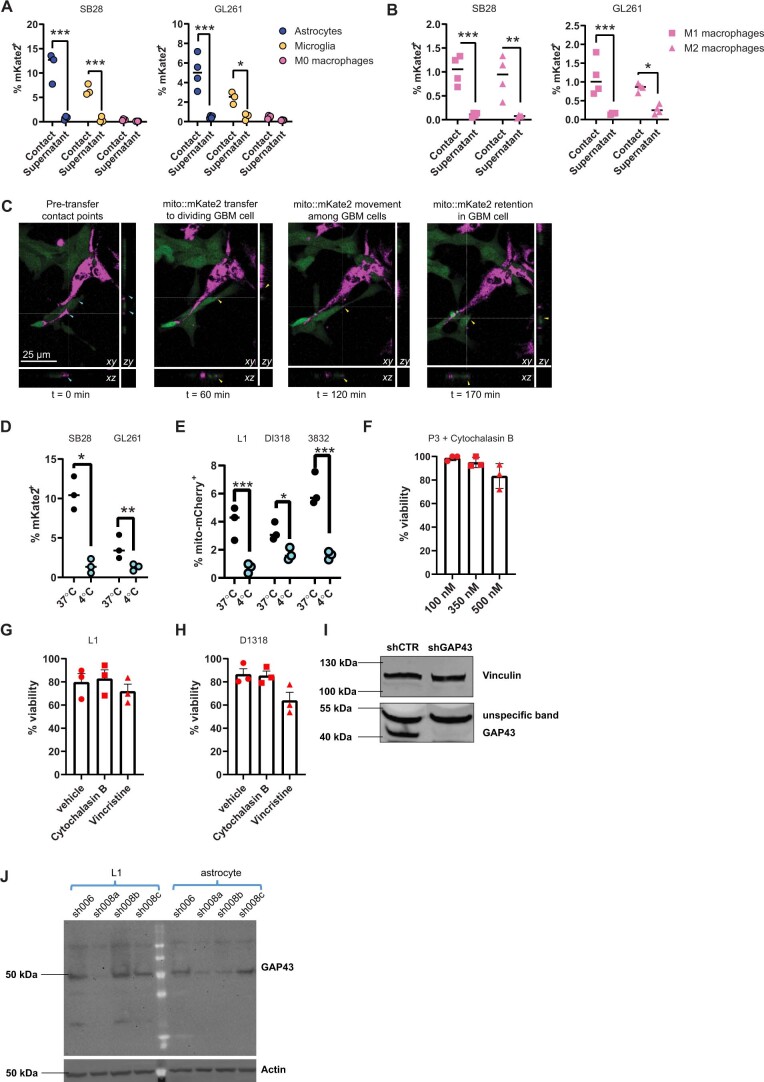
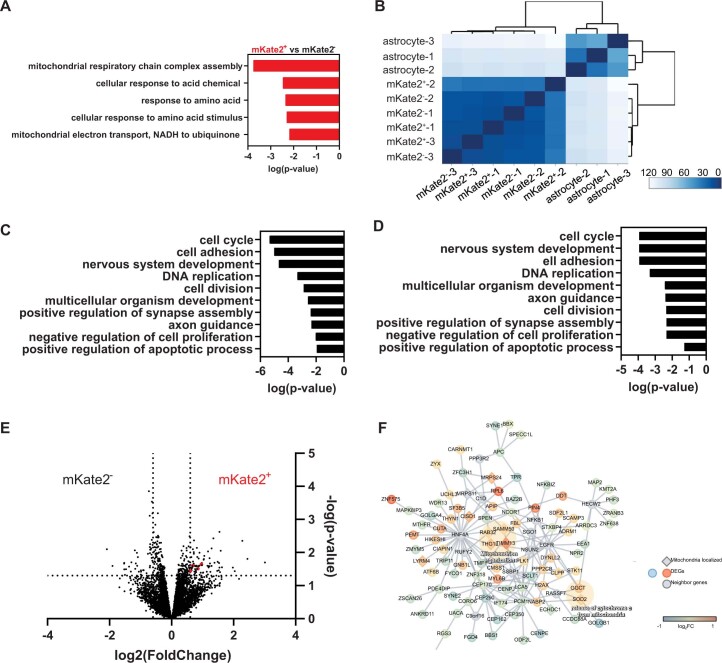
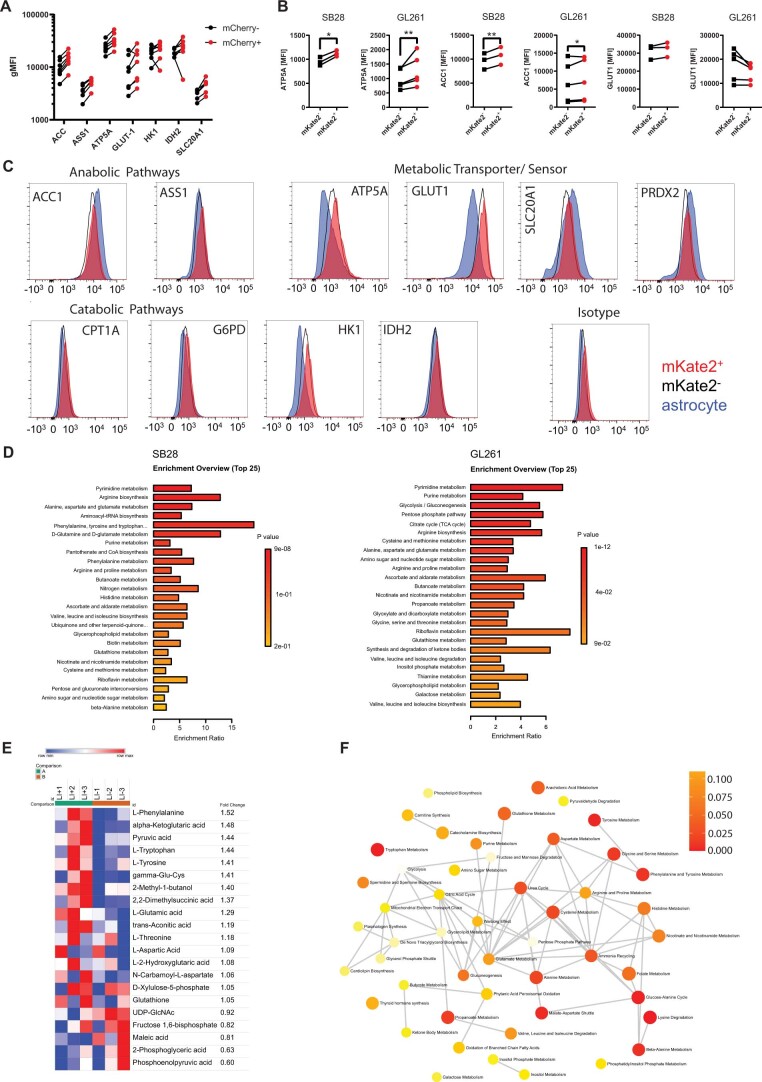
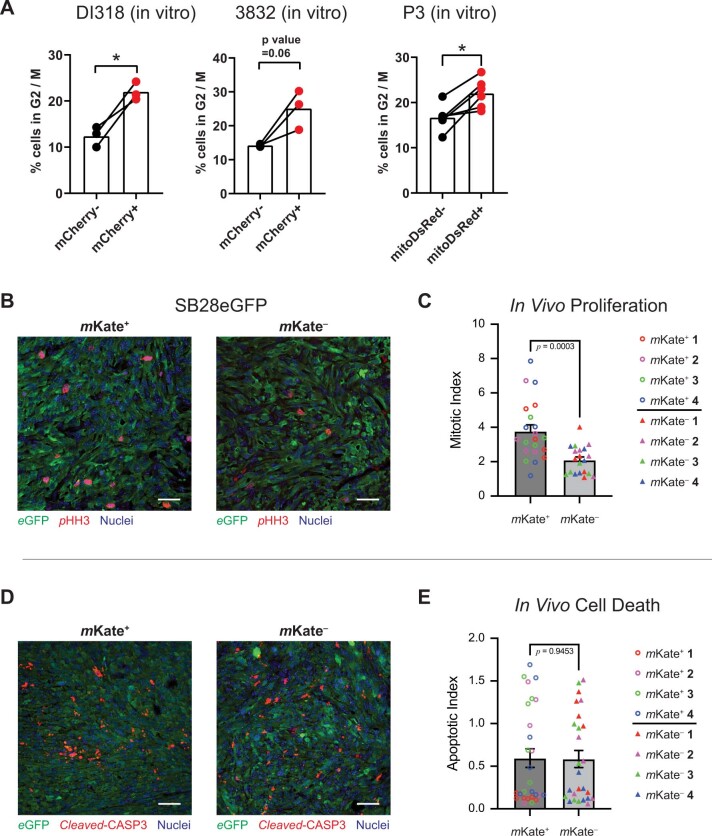
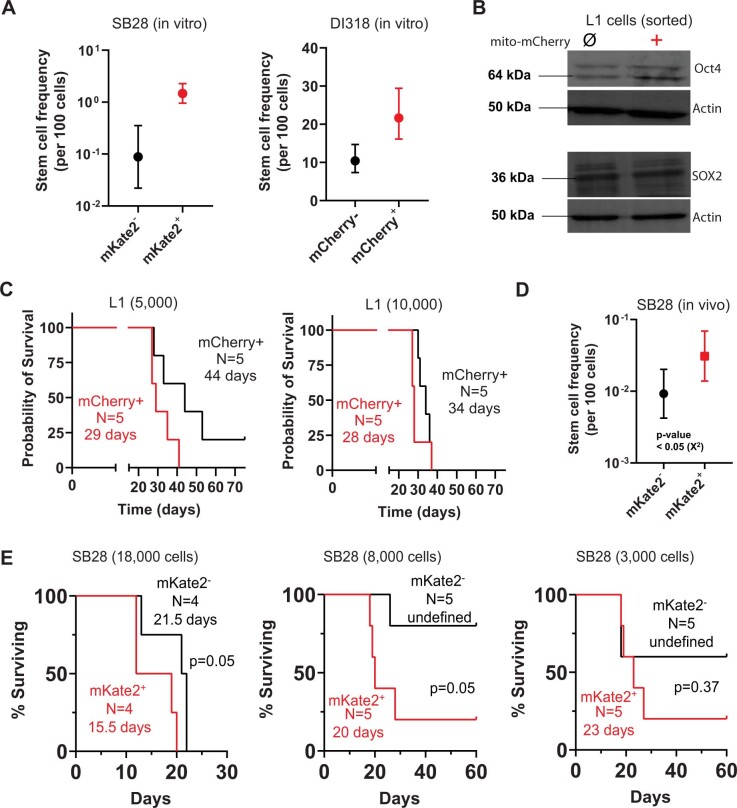
The transfer of intact mitochondria between heterogeneous cell types has been confirmed in various settings, including cancer. However, the functional implications of mitochondria transfer on tumor biology are poorly understood. Here we show that mitochondria transfer is a prevalent phenomenon in glioblastoma (GBM), the most frequent and malignant primary brain tumor. We identified horizontal mitochondria transfer from astrocytes as a mechanism that enhances tumorigenesis in GBM. This transfer is dependent on network-forming intercellular connections between GBM cells and astrocytes, which are facilitated by growth-associated protein 43 (GAP43), a protein involved in neuron axon regeneration and astrocyte reactivity. The acquisition of astrocyte mitochondria drives an increase in mitochondrial respiration and upregulation of metabolic pathways linked to proliferation and tumorigenicity. Functionally, uptake of astrocyte mitochondria promotes cell cycle progression to proliferative G2/M phases and enhances self-renewal and tumorigenicity of GBM. Collectively, our findings reveal a host-tumor interaction that drives proliferation and self-renewal of cancer cells, providing opportunities for therapeutic development.


Conflict of interest statement

The authors declare no competing interests.

Figures

Fig. 1
Fig. 1. GBM cells acquire host mitochondria from the TME.
a, GFP-expressing GL261 and SB28 cells were implanted intracranially into wild-type (WT) and mito::mKate2 (mK) mice, and tumors were analyzed at humane endpoint. be, Single focal planes (xy) and z-stack orthogonal reconstructions (xz, yz) at areas of SB28 (b,c) and GL261 (d,e) tumor–host cell interfaces. Yellow arrowheads indicate host mKate2+ mitochondria (Mito) within recipient tumor cells. Cyan arrowheads indicate WGA-labeled tether-like structures connecting tumor and host cells. f, Three-dimensional confocal imaging segmentation-based estimation of mKate2+GFP+ GBM cell frequency from two to three visual fields from n = 3 (SB28) and n = 2 (GL261) WT and n = 3 (SB28) and n = 4 (GL261) mK mice; ***P = 0.0003 (SB28) and P < 0.0001 (GL261). Data were analyzed by two-tailed t-test. See also Extended Data Fig. 1 for additional data, including technical controls. g, Mitochondria transfer between the TME (mitoDsRed+) and human GBM cells (GFP+) in vivo. MitoDsRed lentivirus was injected into the brains of nude rats. Seven days later, human P3 GFP+ GSCs were injected into the same area. Confocal microscopy images of P3 GFP+ xenograft tumors are representative of at least six ×100 images across three biologically independent animals. Details of the area along the tumor surface are shown in (i), with colocalization of GFP+ and mitoDsRed+ signal in (ii) and (iii). A 3D reconstruction of the mitoDsRed+ mitochondria (white arrows) seen from above, without (iv) and with (v) the GFP+ cell borders, is shown. From below, the mitoDsRed+ mitochondria are also visible in (vi) and reside within the cell in (vii). ii, ×1.5 magnification; iii–vii, ×3 magnification. Source data
Fig. 2
Fig. 2. GBM cells acquire mitochondria from astrocytes.
a, GBM cells were cocultured with astrocytes, microglia or macrophages from mK mice for 2 h, and mitochondria transfer was analyzed by flow cytometry. b, Relative frequency of mKate2+GFP+ GBM cells in co-cultures; n = 3 (SB28) and 4 (GL261) independent experiments; *P < 0.05, **P < 0.01, ***P < 0.001. Data were analyzed by two-way analysis of variance (ANOVA). c,d, Human-derived GSCs were cocultured with immortalized mito-mCherry+ human astrocytes for 4 d. Mito-mCherry+ GSCs (black rectangle gate) were quantified by flow cytometry (c), as summarized in d; n = 3 (3832), 3 (DI318) and 4 (L1) independent experiments. Data were analyzed by two-way ANOVA; P = 0.006 (L1), 0.03 (DI318) and 0.007 (3832). e, Mitochondria transfer between astrocytes (mitoDsRed+ and GFAP+) and human GBM cells (GFP+) in vivo. Confocal microscopy of a GFP+ P3 xenograft tumor immunostained with antibodies to GFAP (white color) was used to visualize astrocytes. Images are representative of at least six ×100 images across three biologically independent animals. Mitochondria transfer is highlighted in an invasive tumor area with colocalization of GFP+ and mitoDsRed+ signal in (i). Images in (ii) and (iii)–(ix) represent ×1.5 and ×3 magnifications, respectively. A 3D reconstruction of the mitoDsRed+ mitochondrial signal both within and around the GFP+ and GFAP+ surfaces is shown in (iv). The mitoDsRed+ mitochondria colocalized within the GFP+ tumor cell borders (yellow) and within the purple reconstructed GFAP+ astrocytic processes (blue), seen from above without (v) and with (vi) GFP+ and GFAP+ cell borders. From below, mitoDsRed+ mitochondria are also visible in (vii) and reside within the GFP+ and GFAP+ regions in (viii) and (ix). Source data
Fig. 3
Fig. 3. Astrocytes transfer mitochondria to GBM via actin-based intercellular connections.
a, Human-derived GSCs (L1, DI318 and 3832; bottom) and astrocytes (top) were separated from each other with 5-μm porous transwell inserts. Twenty-four hours later, mitochondria transfer was analyzed based on mito-mCherry signal; n = 3 independent experiments; P = 0.02 (L1), 0.007 (DI318) and 0.01 (3832). Data were analyzed by two-way ANOVA. b, Presence of mitochondria within MTs connecting P3 GFP+ cells. Immunostaining with TOMM20, representative of at least eight ×100 images across three biologically independent co-cultures, is shown. Intratubular location is confirmed by z stacking, seen from the left in (i) and the right in (ii) side. Arrows indicate TOMM20+ signal. c, Co-culture between mitoDsRed+ astrocytes and GFP+ P3 cells immunostained with F-actin (white) to visualize membrane extensions connecting the two cell types, emphasized with high magnification. Images are representative of at least 20 ×60 images across three biologically independent co-cultures. Arrows indicate mitoDsRed+ mitochondria in intercellular connections and transferred mitoDsRed+ mitochondria. MitoDsRed+ mitochondria are also observed in MT connections between two tumor cells, confirming the exchange of mitochondria within the whole network of tumor–tumor/tumor–astrocyte connections. Insets: ×1.5 magnification. d, Human-derived GSCs were cocultured for 24 h with immortalized mito-mCherry+ and mitoDsRed+ human astrocytes in the presence of actin (cytochalasin B) or microtubule (vincristine) polymerization inhibitors or vehicle control (UN). The frequency of mito-mCherry+ or mitoDsRed+ GSCs was assessed by flow cytometry; n = 3 independent experiments. Data are presented as mean ± s.e.m. (L1 and DI318) and mean ± s.d. (P3); *P = 0.03 (L1), **P = 0.01 (DI318), ***P < 0.0001 (P3). Data were analyzed by one-way ANOVA with Holm–Sidak multiple comparison correction. Source data
Fig. 4
Fig. 4. GAP43 facilitates mitochondria transfer via tumor–astrocyte MTs.
a, Presence of GAP43+ MT-like connections (arrows) between mitoDsRed+ astrocytes and P3 tumor cells. Immunostaining for GAP43 (white) and actin (green) is shown. Left: mitoDsRed (red), GAP43 and actin. Middle: mitoDsRed and actin. Right: mitoDsRed and GAP43. Images are representative of at least four ×100 images across three biologically independent co-cultures. b, Co-culture of mitoDsRed+ astrocytes and GFP+ P3 short hairpin GAP43 (shGAP43) cells indicates fewer membrane connections between donor and recipient cells than observed in GFP+ P3 short hairpin control (shCTR) cells. Immunofluorescence staining with F-actin (yellow) is shown and is further visualized at increased magnification (i–iv). Arrows indicate MTs. Insets: 2 × magnification. c, Quantification of MTs from b across 16 independent ×60 images across n = 4 independent co-culture experiments per group. Data are shown as the mean ± s.d.; ***P < 0.0001. Data were analyzed by two-tailed t-test; Cntrl, wild type; KD, knockdown. d, Wild-type or GAP43-knockdown L1 human-derived GSCs were cocultured for 24 h with matching wild-type or GAP43-knockdown mito-mCherry+ astrocytes. Astrocyte-derived mitochondria transfer to GSCs was quantified by flow cytometry; n = 4 independent experiments; *P = 0.01. Data were analyzed by two-tailed t-test. e, Wild-type or GAP43-knockdown P3 human-derived GSCs were cocultured for 24 h with mitoDsRed human astrocytes. Astrocyte-derived mitochondria transfer to GSCs was quantified by flow cytometry; n = 3 independent experiments; **P = 0.001. Data were analyzed by two-tailed t-test. Source data
Fig. 5
Fig. 5. Acquisition of astrocyte mitochondria enhances ATP production by mitochondrial respiration in recipient GBM cells.
a, Oxygen consumption rate (OCR) was measured in GFP+ P3 cells sorted after transfer with a high or low amount of mitoDsRed+ mitochondria from donor mitoDsRed+ astrocytes and was compared with that in sorted GFP+mitoDsRed P3 cells from the same co-culture. Following readings of basal respiration, the stepwise addition of 3 mM oligomycin (Oligo) to measure leak respiration, 1.5 mM CCCP to quantify maximal and reserve capacity and 1 mM rotenone (ROT) followed by 1 mM antimycin A (AMA) to measure non-mitochondrial respiration was performed; CTR, control. b, Basal oxygen consumption gradually increased with cumulative mitochondrial content in GFP+ P3 cells. c, Maximal respiratory capacity gradually increased with cumulative mitochondria content in GFP+ P3 cells. d, Energy map indicating that GFP+ P3 cells with a higher degree of mitochondria transfer from astrocytes have a more aerobic and energetic phenotype than GFP+ P3 cells with less and no mitochondria transfer. Data in ad are from a representative experiment from a total of three independent experiments. Data shown as mean ± s.e.m.; n = 18 (control), 22 (mitoDsRed low) and 9 (mitoDsRed high) technical replicates; statistical comparison of technical replicates is not shown. ECAR, extracellular acidification rate; mpH, milli pH. e, Seven distinct human-derived GSCs were cocultured for 4 d with immortalized mito-mCherry+ human astrocytes and stained with antibodies recognizing key metabolic proteins for downstream flow cytometry quantification. Protein expression was compared between mito-mCherry+ and mito-mCherry cells by mixed-effects model analysis. The dotted line represents the statistical significance threshold (false-discovery rate (FDR) < 0.05). f, ATP levels in sorted mitoDsRed+ versus mitoDsRed cells from distinct human-derived GSCs, measured with the CellTiter-Glo luminescence assay; n = 3 independent experiments; *P = 0.04. Data were analyzed by two-tailed ratio paired t-test; RLU, relative light units. g, ATP levels in sorted mito-mCherry+ versus mito-mCherry cells from three distinct human-derived GSC lines, assessed by CellTiter-Glo luminescence assay; n = 3 independent experiments; **P = 0.003. Data were analyzed by two-tailed t-test. Source data
Fig. 6
Fig. 6. Mitochondria transfer from astrocytes reprograms GBM metabolism.
a, Metabolic pathway analysis (MetaboAnalyst) of metabolites enriched by >20% in mito::mKate2+ versus mito::mKate2 mouse GBM cells. For each cell model, n = 3 independent co-culture experiments were pooled. Dotted lines represent the cutoff for statistical significance (P < 0.05). Pathways significantly enriched in both GBM models are highlighted with orange and are labeled with the pathway name. P values were calculated with the MetaboAnalyst 5.0 web tool using the one-tailed hypergeometric test for enrichment analysis (expected versus observed metabolites enriched in each pathway). b, L1 cells were cocultured with immortalized mito-mCherry+ human astrocytes for 4 d. Relative abundances of metabolites in mito-mCherry+ versus mito-mCherry L1 cells indicate higher amino acid and glutathione metabolism in mito-mCherry+ L1 cells; n = 3 independent co-culture experiments. Data were analyzed by paired two-tailed t-test; 2-OG, α-ketoglutarate; CDP, cytidine-5'-diphosphate. c, Phospho-array pathway analysis (Enrichr) of protein phosphorylation sites upregulated in mito-mCherry+ versus mito-mCherry L1 cells, depicted with dimensionality reduction in semantic xy space. Dots represent significantly upregulated pathways (FDR < 0.05). Selected pathways associated with cell metabolism and proliferation are labeled; n = 3 independent co-culture experiments were pooled and analyzed. Source data
Fig. 7
Fig. 7. Mitochondria transfer from astrocytes drives GBM cell proliferation, self-renewal and tumorigenicity.
a,b, Human-derived GSCs (L1) were cocultured with immortalized mito-mCherry+ human astrocytes. Representative histograms (a) and aggregate data (b) of n = 4 independent experiments depicting cell cycle analysis by flow cytometric DNA quantification in GSCs that acquired astrocyte mitochondria (mCherry+, red histogram/dots) versus those that did not (mCherry, black histogram/dots) are shown; *P = 0.04. Data were analyzed by two-tailed t-test. c,d, Cell cycle analysis by ex vivo flow cytometry DNA quantification in GFP-expressing mouse GBM cells obtained from orthotopic tumors in mito::mKate2 mice; n = 4–6 mice per tumor model and N = 6 (SB28; c) and 4 (GL261; d) mice per group; *P = 0.02 (SB28) and 0.03 (GL261). Data were analyzed by two-tailed paired t-test. eg, Cell-free mito-mCherry+ astrocyte mitochondria (intact or heat killed) were added to an L1 culture; vehicle (PBS) or live mito-mCherry+ astrocytes were added to control wells. e, Representative dot plots depicting the identification of L1 cells that acquired cell-free mitochondria or mitochondria from cocultured astrocytes. In the +astrocyte condition, the mCherryhi population outside of the gates is composed of the mito-mCherry+ astrocytes. Representative histograms (f) and aggregate data (g) depicting cell cycle analysis of GSCs that acquired cell-free astrocyte mitochondria (mCherry+, red histogram/dots) versus those that did not (mCherry, black histogram/dots) are shown; n = 3 independent experiments; **P = 0.003. Data were analyzed by two-tailed paired t-test. h,i, Estimated stem cell frequency in mCherry+ versus mCherry human-derived GBM models sorted from astrocyte co-cultures and subjected to in vitro limiting dilution sphere formation assay (h) or in vivo orthotopic tumor initiation assay (i); **P = 0.002, ratio paired t-test, n = 3 independent experiments (h); P = 0.005; compiled data from n = 15 NOD scid gamma (NSG) mice per group (distributed across three cell-dose levels). Data are shown as mean ± 95% confidence interval; χ2 test with 1 degree of freedom analyzed by Extreme Limiting Dilution Analysis (ELDA; i). j, Survival of mice injected orthotopically with 1,000 sorted L1 GSCs per animal; P = 0.009. Data were analyzed by log-rank test. Survival analysis of other dose levels is presented in Extended Data Fig. 8. k, Schematic overview of findings. Source data
Extended Data Fig. 1
Extended Data Fig. 1. Additional data for in vivo transfer of host mitochondria to orthotopic mouse GBM tumors.
(A) GFP-expressing GL261 and SB28 mouse GBM cells were implanted intracranially into wildtype mice (controls for Fig. 1B-F), and tumors were analyzed at animal humane endpoint. Representative confocal microscopy data from orthotopic SB28 and GL261 tumors in wildtype mice are shown. Yellow arrowheads point to GFPnegative (non-tumor) host cells. Shown are single focal planes (xy), as well as z-stacks (zy and xz). (BD) and (EH) Mitochondria in-transit from host to GBM cells in orthotopic tumors. Sequential confocal planes (xy) and accompanying orthogonal reconstructions (zy, xz) of SB28 (BD) and GL261 (EH) GBM tumors in mice, demonstrating an intercellular connection between a mito::mKate2+ host cell (white arrowheads) and GFP+ tumor cell. Host mKate2+ mitochondria within the intercellular connection are indicated by yellow arrowheads. The mitochondria at the end of the connection are surrounded by GFP signal, corresponding to incorporation in the recipient tumor cell cytoplasm (cyan arrowhead).
Extended Data Fig. 2
Extended Data Fig. 2. Mitochondria transfer from the TME to human GBM models is observed in vivo.
Mitochondria transfer between the TME (mitoDsRed + ) and tumor cells (mitoGFP+ and nestin + ) in vivo. Confocal microscopy of GG16 tumors immunostained with human-specific nestin antibodies, representative of at least four 100X images across 3 biologically independent animals. (i). Details of area along the tumor surface with co-localization of nestin + (yellow), mitoGFP+ and mitoDsRed+ signal (ii and iii). 3D reconstruction of the mitoDsRed+ mitochondria seen from above, without (a) and with (b) the nestin+ cell borders. From below, the mitoDsRed+ mitochondria are also visible (c) and reside within the cell (d). ii, 1.5x magnification; iii and a-d, 3x magnification.
Extended Data Fig. 3
Extended Data Fig. 3. Brain-resident cells transfer mitochondria to GBM cells in vivo.
(A-C) GFP-expressing SB28 and GL261 cells were implanted intracranially into wild-type (WT), mKate2::mito (mKate2) or WT mice with mito::mKate2 bone marrow (mito::mKate2→WT). (B) Representative contour plots and (C) aggregate data of relative frequency of mito::mKate2+GFP+ GBM cells by flow cytometry; n = SB28 (8 WT, 6 mito::mKate2, and 6 mito::mKate2→WT) and GL261 (6 WT, 6 mito::mKate2, and 4 mito::mKate2→>WT) mice per group. *** p < 0.0001, 2-way ANOVA with Tukey correction for multiple comparisons. Mitochondria transfer rate is negligible in mito::mKate2→WT mice, in which brain-resident cells do not express mito::mKate2. Source data
Extended Data Fig. 4
Extended Data Fig. 4. Additional data for in vitro mitochondria transfer in mouse and diverse patient-derived GBM models.
(A) Representative flow cytometry dot plots depicting mitochondria transfer frequency to mouse GBM cells from mito::mKate2 donor cells, summarized in Fig. 2B. (B) Mitochondria transfer from polarized (M1, M2) or non-polirized (M0) bone marrow-derived macrophages, assessed by flow cytometry. n = 4 independent experiments. Two-way ANOVA. (C) Flow cytometry of mitochondria transfer between mDsRed+ astrocytes and P3/BG5/GG16 GFP + cells at 24 h; mean ± SD. n = 3 independent experiments. *** p < 0.0001 (2-tailed t-test). (D) 3D reconstructions of confocal microscopy from patient-derived GBM and astrocyte co-cultures. mito-mCherry astrocytes (magenta); cyan cells CellTrace-labelled GSCs (cyan). Perpendicular cutaway planes (red and green outlines) reveal internalized astrocyte-derived mito-mCherry+ mitochondria in GSCs (yellow arrowheads). (E) Confocal microscopy of mitochondria transfer in P3/BG5/GG16 GFP + cells with mDsRed+ astrocyte mitochondria (arrows); representative of at least four 100x images across 3 biologically independent animals for each cell line. Scale bars 10 mm. Z stack locates mDsRed+ mitochondria (arrows) within acceptor cell cytoplasm, from the left side (i) and the right (ii). (F) Mitochondria transfer between astrocytes (mitoDsRed+GFAP+) and human GBM cells (GFP+) in vivo. Confocal microscopy of GFP+ P3 xenograft tumor immunostained for GFAP (white) to visualize astrocytes; representative of at least six 100X images across 3 biologically independent animals. (i) Mitochondria transfer highlighted at invasive tumor area with colocalization of GFP + and mitoDsRed+ signal (ii and iii, higher magnification). 3D reconstruction of the mitoDsRed+ mitochondrial signal within and around GFP + and GFAP + surfaces (a). mitoDsRed+ mitochondria colocalize within GFP + tumor cells (yellow) and within the purple reconstructed GFAP + astrocytic processes (blue), seen from above without (b) and with (c) GFP + and GFAP + cell borders. From below, mitoDsRed+ mitochondria are also visible (d) and reside within the GFP + and GFAP + regions (e-f). Scale bars 10 µm. (G-H) ImageStream depicting transferred mito-GFP astrocyte mitochondria to co-cultured (G) D456 and (H) JX22 patient-derived RFP+ GBM cells, representative across >imaged 100 cells per cell type and model. (I) Single-cell culture controls demonstrating the specificity of the RFP (tumor) and GFP (astrocyte mitochondria) signals. Top to bottom: Non-transduced GBM cells; mito-GFP astrocytes; RFP GBM cells. Source data
Extended Data Fig. 5
Extended Data Fig. 5. Astrocyte mito-mCherry+ structures internalized by patient-derived GSCs comprise Tomm20+ mitochondria.
Co-cultures of patient-derived GSCs (L1 and DI318) and mito-mCherry (magenta) human astrocytes were fixed and stained for the mitochondrial outer membrane protein Tomm20 (cyan). (A) Confocal microscopy, including z-stacks, depicting distribution of internalized astrocyte-derived mito-mCherry+ mitochondria (yellow arrowheads) in relation with intrinsic mCherrynegativeTomm20+ mitochondria in GSCs; representative of at least 3 different optical fields with evidence of mitochondria transfer, across 3 experiments (per model). Animation of the 3D reconstructions can be seen in Supplementary Videos 1-2. (B) Z-stacks of L1 cells with internalized astrocyte-derived mito-mCherry+ mitochondria (yellow arrowheads) were utilized to perform linear colocalization analysis of mito-mCherry with Tomm20 (analyzed pixels denoted with horizontal white line in the “merged” channel micrograph. (C) Linear colocalization analysis from Panel B data. Magenta mito-mCherry peaks coincide with cyan Tomm20 peaks, indicating colocalization. Source data
Extended Data Fig. 6
Extended Data Fig. 6. Transfer of host mitochondria to GBM cells is contact-, energy-, actin-, and GAP43-dependent: additional data.
(A-B) GBM cells were co-cultured in direct contact with astrocytes, microglia, or M0/M1/M2 macrophages from mito::mKate2 mice for 2 hours (“contact”). Alternatively, culture supernatant conditioned by donor cells for 48 hours was transferred to GBM cell cultures (“supernatant”). Mitochondria transfer was analyzed by flow cytometry. n = SB28 (3 astrocytes, 3 microglia, 4 macrophages, 4 M1 macrophages, 4 M2 macrophages and GL261 (4 astrocytes, 3 microglia, 4 macrophages, 4 M1 macrophages, 4 M2 macrophages) independent experiments. * p = 0.03 (GL261 microglia), 0.02 (GL261 M2 macrophages), ** p < 0.02, *** p = <0.0001 (astrocytes), 0.001 (SB28 microglia), 0.0007 (SB28 M1 macropahges), 0.0004 (GL261 M1 macrophages), two-way ANOVA. (C) Confocal time-lapse images demonstrating real-time acquisition of astrocyte mitochondria (magenta) by SB28 cells (green). Cyan arrowheads point to contact points between SB28 cells and astrocytes. Yellow arrowheads point to transferred mito-mCherry+ astrocyte mitochondria inside SB28 cells. Video footage provided in Supplementary Video S3. (D) Mouse and (E) patient-derived GBM cells were co-cultured with mito::mKate2 or mito-mCherry (respectively) astrocytes for 2 hours at 37 °C or 4 °C. Graphs depict astrocyte mitochondria transfer to GBM cells. n = 3 independent experiments for each model. (D) * p = 0.04, ** p < 0.0003, (E) p = 0.0004 (L1), 0.03 (DI318), < 0.0001 (3832), two-way ANOVA with Sidak multiple comparison correction. (F) WST (viability) assay of P3 cells treated with cytochalasin B at indicated concentrations normalized to control. n = 3 independent experiments; mean ± SD. (G-H) Patient-derived GSCs were co-cultured for 24 h with mito-mCherry+ human astrocytes in the presence of actin (cytochalasin B) or microtubule (vincristine) polymerization inhibitors or vehicle control. Viability of GSCs was assessed by flow cytometry. n = 3 independent experiments; mean ± SEM. * p < 0.05, ** p < 0.01, ANOVA. (I) Knockdown of GAP43 in P3 GBM cells. Western blot for GAP43 in shGAP43 and shCTR P3 cells, representative of 2 independent experiments. Vinculin was used as a loading control. (J) Western blot of patient-derived GSCs (L1) and immortalized mito-mCherry human astrocytes, confirming knockdown of GAP43 in cell cultures (once) prior to use for experiment series in Fig. 4D (L1-sh008a and astrocytes-sh008b). Source data
Extended Data Fig. 7
Extended Data Fig. 7. Mitochondria transfer alters expression of metabolism gene pathways in recipient GBM cells.
(A-F) RNAseq analysis from n = 3 independent co-culture experiments. (A) Top 5 pathways enriched in RNAseq data from sorted mKate2+ versus mKate2SB28 cells based on genes upregulated >1.5 fold with p < 0.05 (one-tailed hypergeometric enrichment test, unadjusted p-values). (B-D) Data supporting purity of sorted cell populations in RNAseq experiments, given distinct transcriptomic signature of sorted astrocytes vs. GBM cells. (B) Heatmap demonstrating separate unsupervised hierarchical clustering of astrocytes from mKate2 and mKate2+ tumor cells based on gene expression profiling. GO pathway analysis of differentially expressed genes between (C) mKate2 cells and astrocytes and (D) mKate2+ cells and astrocytes. One-tailed hypergeometric enrichment test, unadjusted p-values. (E) Volcano plot representing differential gene expression signature of mKate2+ versus mKate2 cells. Dashed lines mark fold change > 1.5 and p-value < 0.05. Negative binomial distribution DESeq2 testing, unadjusted p-value. Genes that are mapped to mitochondria-related networks are shown in red. (F) Differentially up-regulated genes are enriched in the mitochondrial network. Protein-protein interaction network for the differentially expressed genes. Mouse genes were mapped to human genes according to NCBI HomoloGene. Protein-protein interactions were extracted for these genes/proteins using our human protein interactome. Diamond-shaped nodes indicate that these genes are mitochondrially localized based on the Human MitoCarta2.0 database. Node color shows the log2 fold change of the genes. Source data
Extended Data Fig. 8
Extended Data Fig. 8. Mitochondria transfer alters GBM metabolism at protein and metabolomic levels.
(A) Aggregate data that is summarized in Fig. 5E. Graph depicts gMFI of metabolic protein expression assessed by flow cytometry in seven distinct patient-derived GSCs co-cultured with immortalized human mito-mCherry astrocytes for 4 days. Results of statistical analysis by mixed-effects model is summarized in Fig. 5E. (B) Mouse GBM cell lines were co-cultured with mito::mKate2+ astrocytes for 24 h and stained with antibodies against key metabolic proteins, as denoted. Expression levels were assessed by flow cytometry. Aggregate data from n = 3 (SB28) and 5 (GL261) independent experiments. Panels depict isotype background-corrected, geometric mean fluorescence intensity (gMFI) of the expression of the indicated metabolic proteins. * p = 0.02 (SB28), 0.03 (GL261), ** p = 0.004 (SB28), 0.009 (GL261), paired 2tailed t-test. (C) Representative histograms of data summarized in Panel B, depicting differential expression of critical metabolic proteins by astrocytes and mKate2+ and mKate2- SB28 cells. Astrocytes had higher levels of acetyl-CoA carboxylase (ACC1), SLC20A1 and peroxiredoxin-2 (PRDX2), indicative of more oxidative phosphorylation. In contrast, tumor cells had higher levels of glucose transporter 1 (GLUT 1) and hexokinase 1 (HK1), pointing to a more glycolytic metabolism. (D) Mouse GBM cells were sorted from co-cultures with mouse mito::mKate2 astrocytes and analyzed by targeted metabolomics. Analysis depicts metabolic pathways upregulated in mito::mKate2+ vs. mito::mKate2- GBM cells (MetaboAnalyst 5.0 one-tailed hypergeometric test; unadjusted p-values). This data was used in the combined analysis identifying mutually upregulated pathways in both models, shown in Fig. 6A. (E) L1 cells were co-cultured with immortalized human mito-mCherry astrocytes for 4 days and sorted for metabolite analysis. Heat map showing comparison of abundance of metabolites in mito-mCherry+ L1 cells (L1 + ) when compared to mito-mCherry L1 cells (L1-). (F) Network of metabolites enriched more in mito-mCherry+ L1 cells when compared to mito-mCherry L1 cells (MetaboAnalyst 5.0 one-tailed hypergeometric test; unadjusted p-values). Source data
Extended Data Fig. 9
Extended Data Fig. 9. GBM cells that acquire astrocyte mitochondria are more proliferative.
(A) Three additional patient-derived GSC specimens were co-cultured with immortalized human mito-mCherry or mitoDsRed astrocytes for cell cycle analysis by flow cytometry DNA quantification. GBM cells that acquired astrocyte mitochondria (mCherry+ or mitoDsRed+) were more likely to be in G2/M phase. N = 3 (DI318), 3 (3832) and 6 (P3) biologically independent samples. * p = 0.04 (DI318), 0.01 (P3), 2-tailed t-test. (B-E) mKate2+ and mKate2- SB28 cells were sorted from co-cultures with mito::mKate2 astrocytes and implanted orthotopically in C57BL/6 mice. At humane endpoint, animals were euthanized and their brains fixed for subsequent histologic analysis. (B) Representative micrographs and (C) aggregate data from n = 4 mice per group assessing tumor mitotic index by phospho-histone H3 (pHH3) staining. p = 0.0003. (D) Representative micrographs and (E) aggregate data from n = 4 mice per group assessing apoptotic cell death of GBM cells by cleaved caspase-3 (cleaved-CASP3) staining. p = 0.9. Scale bar denotes 25 µm. Mean ± SEM, 2-tailed t-test. Source data
Extended Data Fig. 10
Extended Data Fig. 10. Acquisition of astrocyte mitochondria enhances self-renewal and tumorigenicity in mouse and human models of disease.
(A) Mouse GBM cells (SB28) and additional patient-derived GBM cells (DI318) were sorted from co-cultures and assayed for self-renewal by in vitro limiting-dilution sphere-formation assay. Representative experiments from 3 (SB28) and 2 (DI318) independent experiments are shown. Mean ± 95% confidence interval; analyzed by ELDA; p-value of individual experiments not shown. (B) mito-mCherry+ and mito-mCherrypatient-derived GSCs (L1) sorted from one of the astrocyte co-cultures were analyzed by western blotting of stem cell transcription factors Oct4 and SOX2. (C) Additional survival curves of animals implanted with sorted L1 cells from co-cultures for the in vivo orthotopic tumor-initiation assay summarized in Fig. 7I. Log-rank test. (D) In vivo orthotopic tumor-initiation assay using mouse SB28 GBM cells sorted from mito::mKate2 astrocyte co-cultures. n = 14 mice per group (total 28 mice). Mean ± 95% confidence interval. p = 0.03, χ2 test with 1 degree of freedom, analyzed by ELDA analysis. (E) Animal survival and tumor penetrance data at 3 different cell doses; used to calculate tumor initiating cell frequency in Panel D. Log-rank test. Source data

Comment in

References

    1. Bock FJ, Tait SWG. Mitochondria as multifaceted regulators of cell death. Nat. Rev. Mol. Cell Biol. 2020;21:85–100. doi: 10.1038/s41580-019-0173-8. - DOI - PubMed
    1. Giacomello M, Pyakurel A, Glytsou C, Scorrano L. The cell biology of mitochondrial membrane dynamics. Nat. Rev. Mol. Cell Biol. 2020;21:204–224. doi: 10.1038/s41580-020-0210-7. - DOI - PubMed
    1. Jones W, Bianchi K. Aerobic glycolysis: beyond proliferation. Front. Immunol. 2015;6:227. doi: 10.3389/fimmu.2015.00227. - DOI - PMC - PubMed
    1. Hay N. Reprogramming glucose metabolism in cancer: can it be exploited for cancer therapy? Nat. Rev. Cancer. 2016;16:635–649. doi: 10.1038/nrc.2016.77. - DOI - PMC - PubMed
    1. Poteet E, et al. Reversing the Warburg effect as a treatment for glioblastoma. J. Biol. Chem. 2013;288:9153–9164. doi: 10.1074/jbc.M112.440354. - DOI - PMC - PubMed

Publication types