. 2023 Jun;26(6):1008-1020.
doi: 10.1038/s41593-023-01326-3. Epub 2023 May 11.

ARG1-expressing microglia show a distinct molecular signature and modulate postnatal development and function of the mouse brain

Affiliations

ARG1-expressing microglia show a distinct molecular signature and modulate postnatal development and function of the mouse brain

Vassilis Stratoulias et al. Nat Neurosci. 2023 Jun.

Abstract

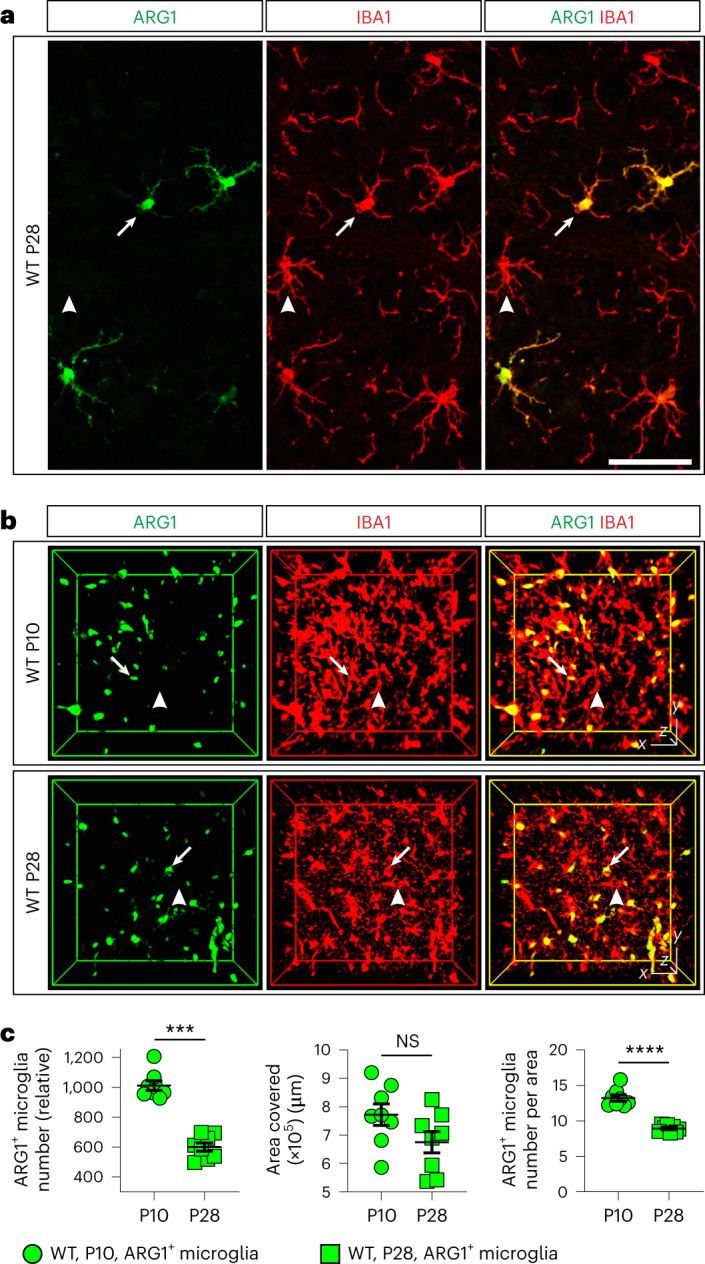
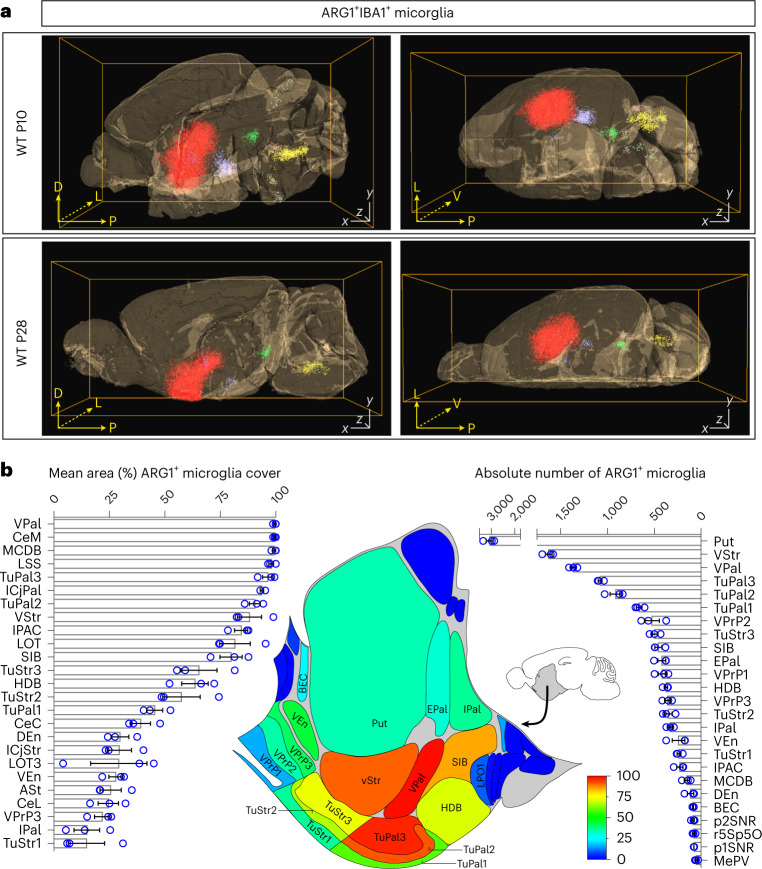
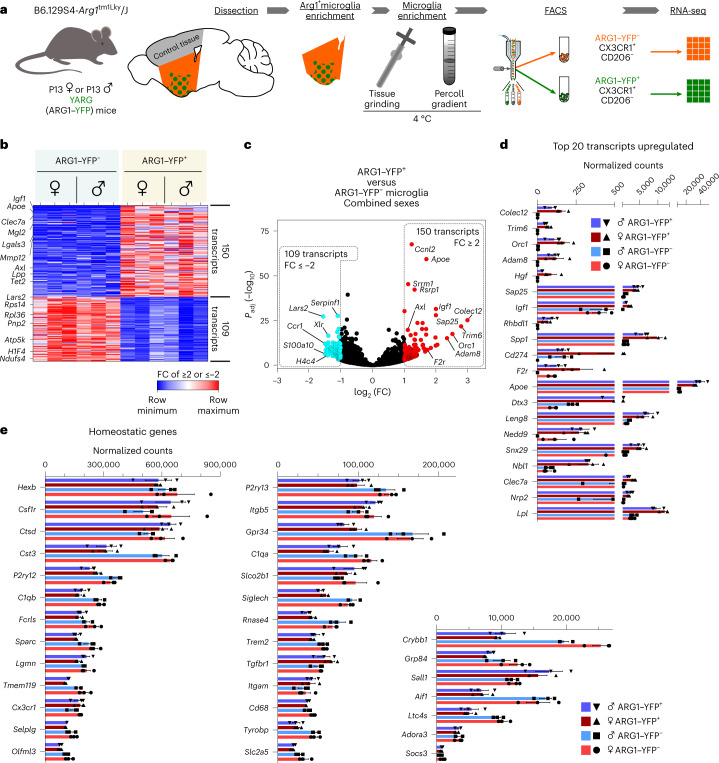
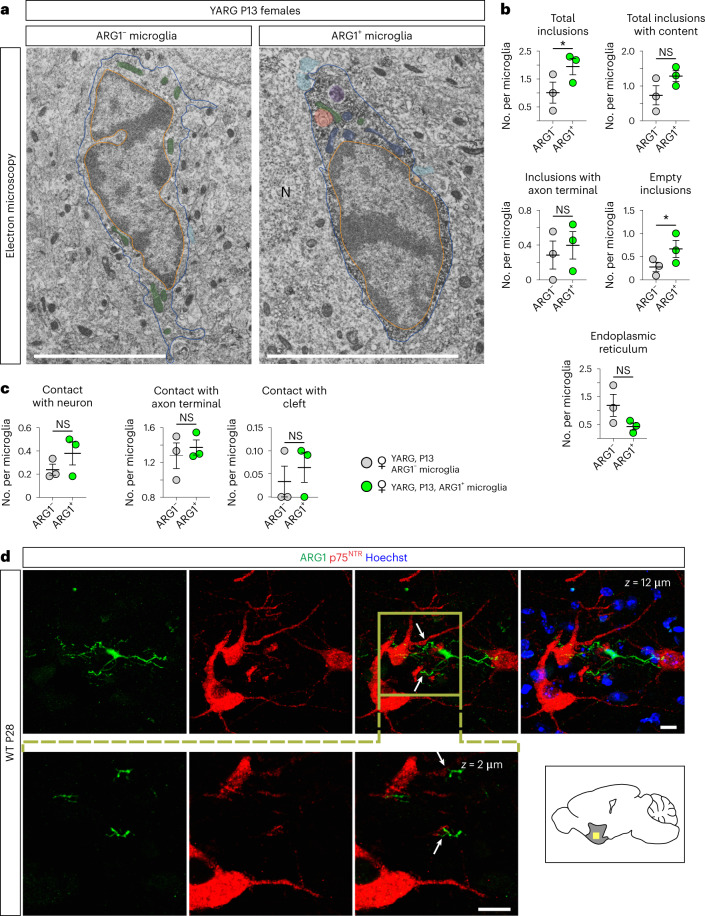
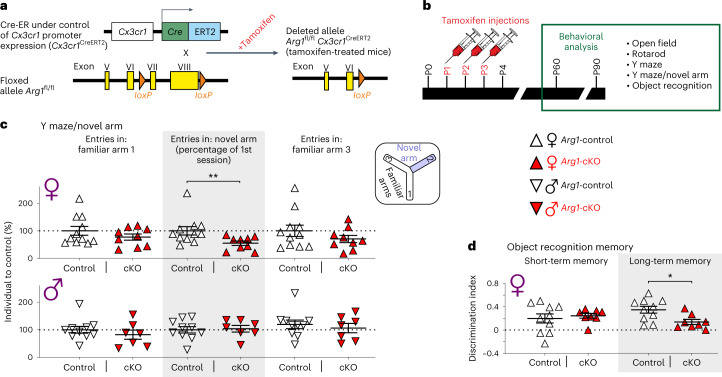
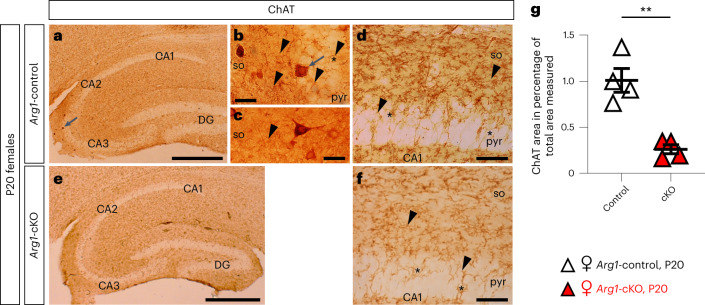
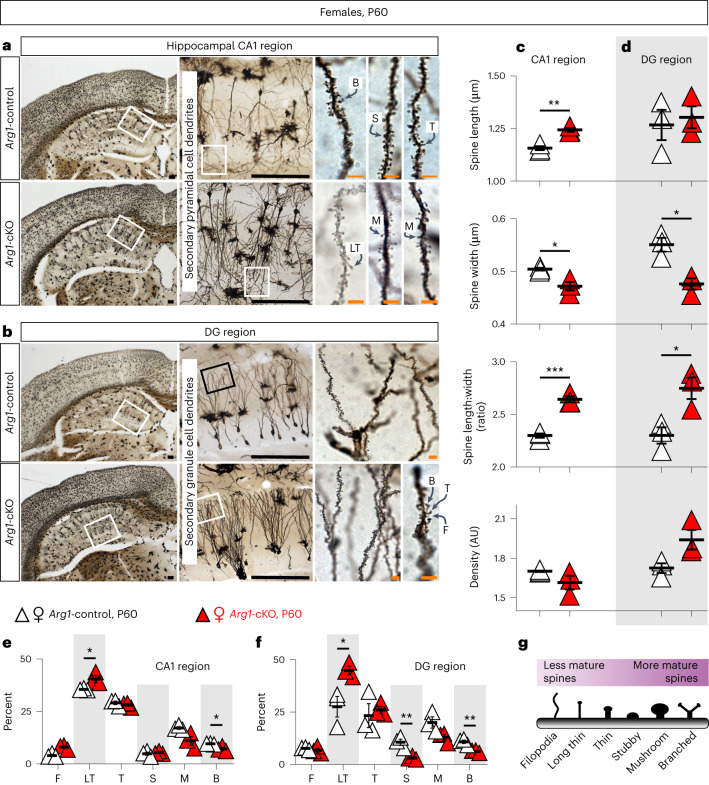
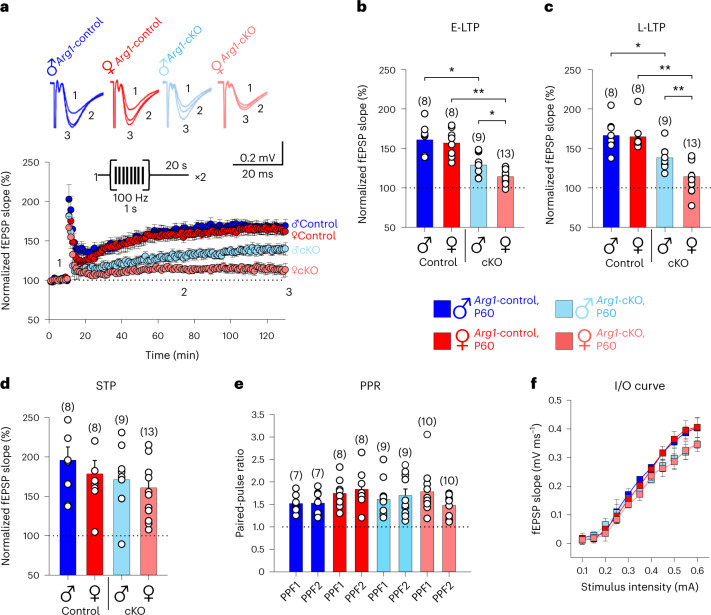
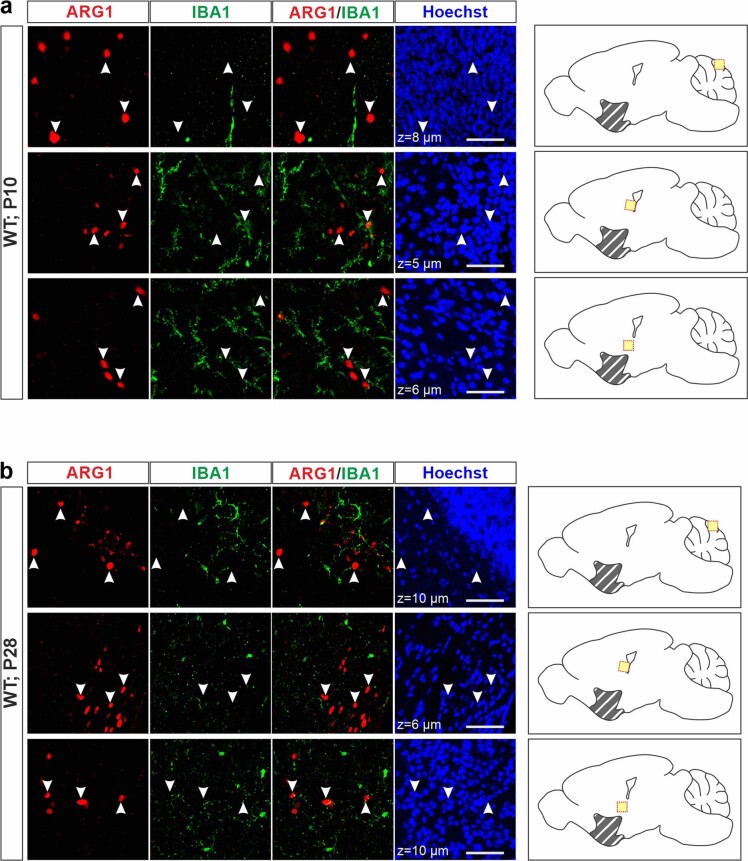
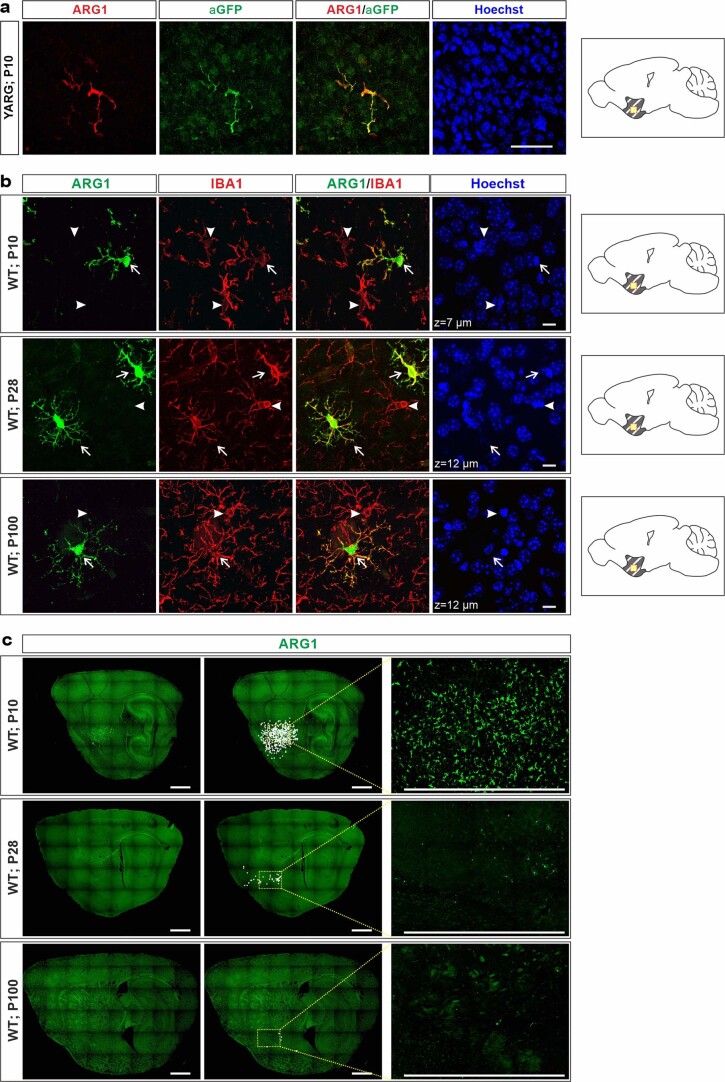
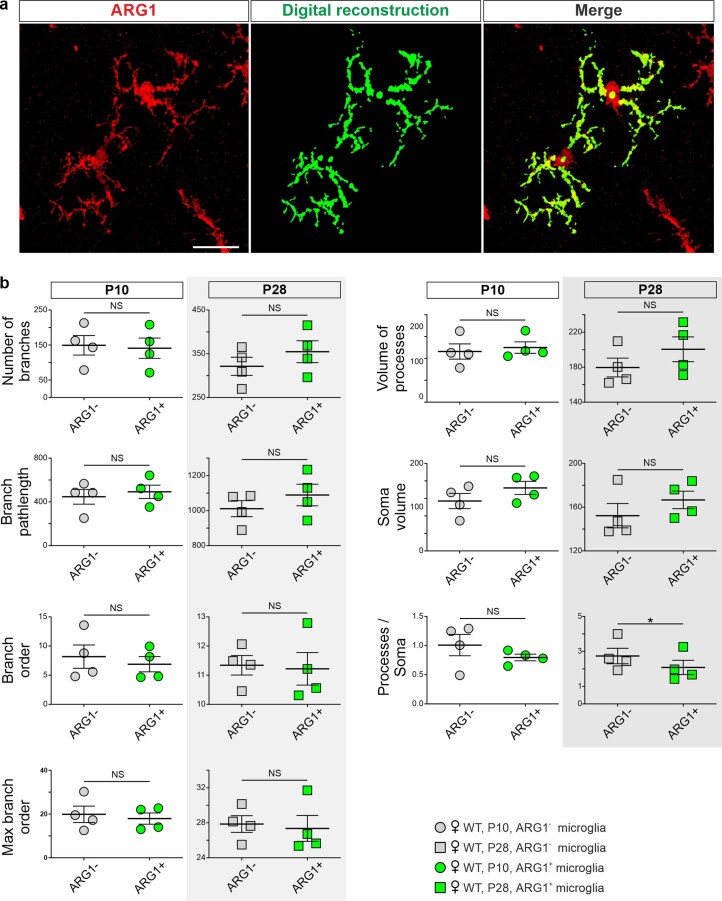
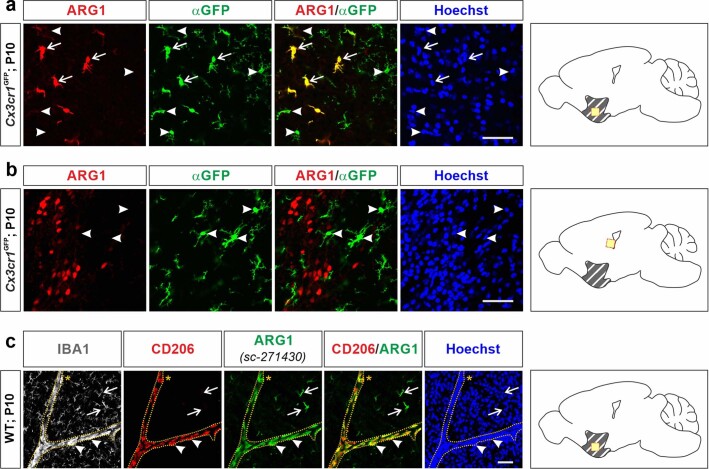
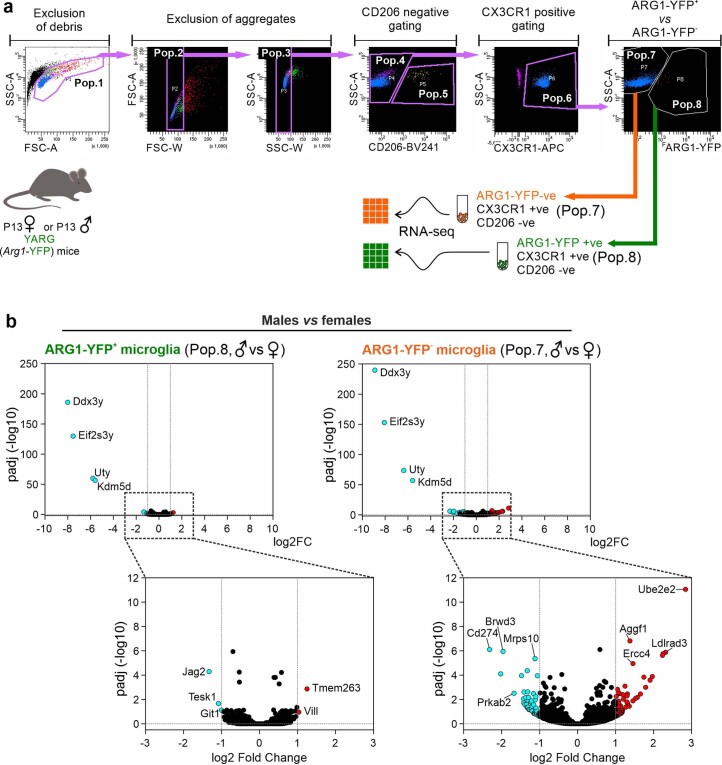
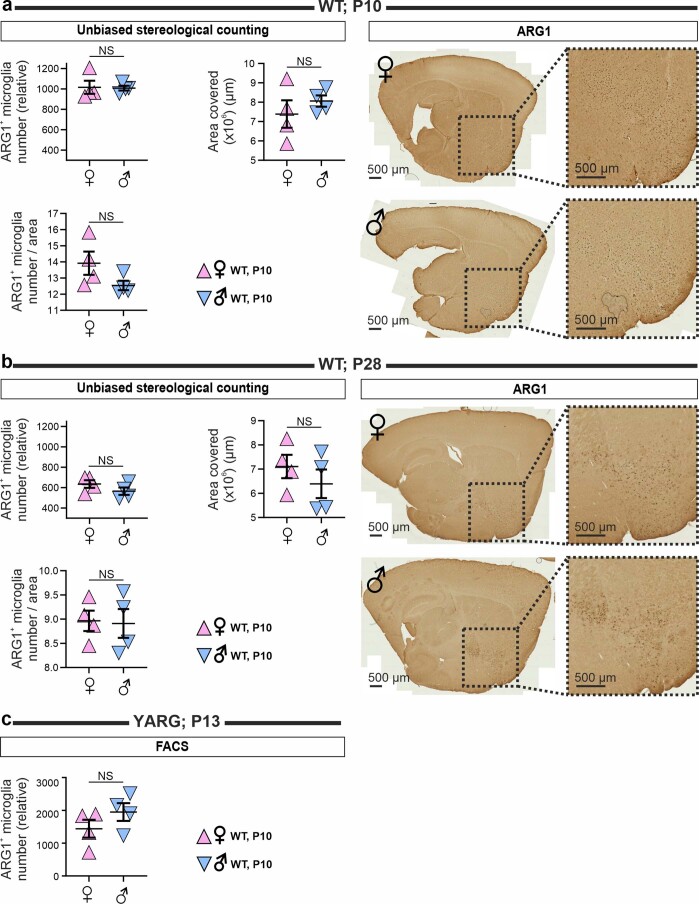
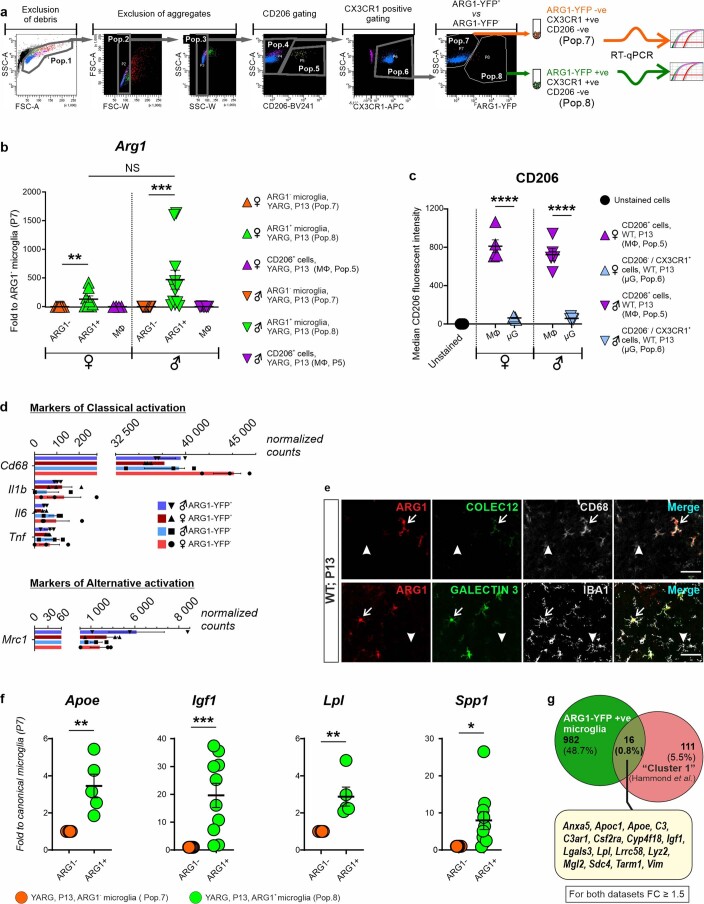
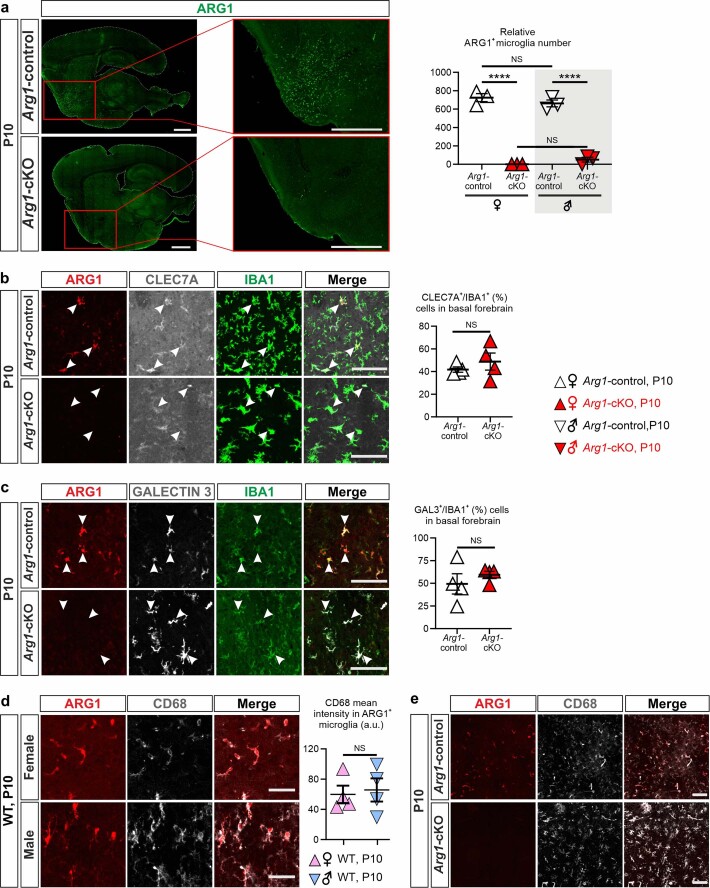
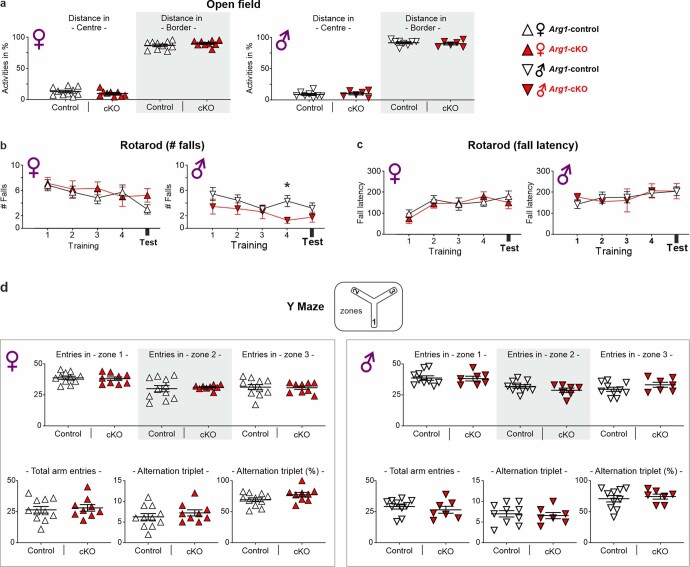
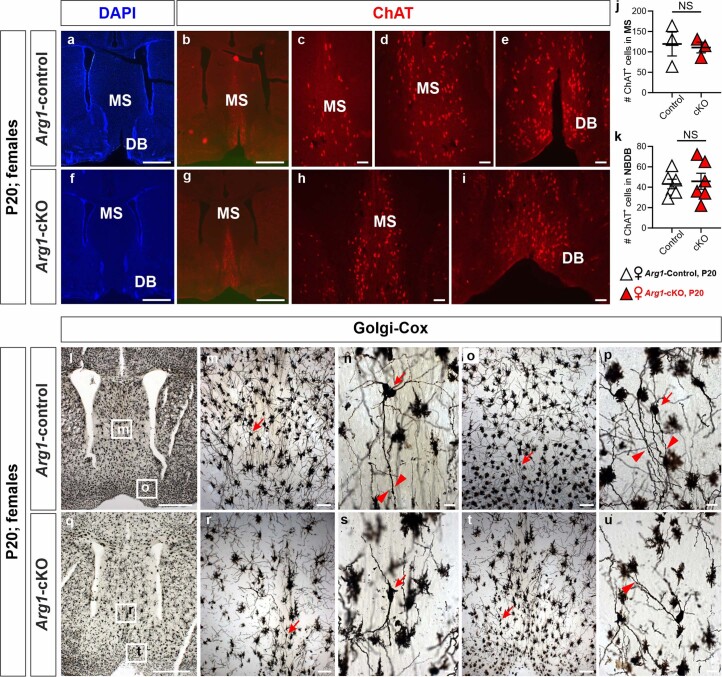
Molecular diversity of microglia, the resident immune cells in the CNS, is reported. Whether microglial subsets characterized by the expression of specific proteins constitute subtypes with distinct functions has not been fully elucidated. Here we describe a microglial subtype expressing the enzyme arginase-1 (ARG1; that is, ARG1+ microglia) that is found predominantly in the basal forebrain and ventral striatum during early postnatal mouse development. ARG1+ microglia are enriched in phagocytic inclusions and exhibit a distinct molecular signature, including upregulation of genes such as Apoe, Clec7a, Igf1, Lgals3 and Mgl2, compared to ARG1- microglia. Microglial-specific knockdown of Arg1 results in deficient cholinergic innervation and impaired dendritic spine maturation in the hippocampus where cholinergic neurons project, which in turn results in impaired long-term potentiation and cognitive behavioral deficiencies in female mice. Our results expand on microglia diversity and provide insights into microglia subtype-specific functions.


Conflict of interest statement

The authors declare no competing interests.

Figures

Fig. 1
Fig. 1. ARG1+ microglia coexist in the same vicinity as ARG1 microglia in the BF of P10 and P28 female and male mice.
a,b, ARG1+ microglia (arrows) and ARG1 microglia (arrowheads) in WT female (a; confocal) and WT male (b; iDISCO) mouse brains. Scale bars, x = 50 μm and z = 8.25 μm (a) and x = y = 50 μm and z = 150 μm (b). c, The ARG1+ microglia population declines with age (n = 4 female and 4 male animals). Each circle (P10) or square (P28) corresponds to one animal; ***P = 0.0002, ARG1+ microglia number (relative); ****P < 0.0001, ARG1+ microglia number per area; NS, not significant. Data are shown as mean ± s.e.m. Statistically significant differences were determined by unpaired two-sided t-tests (for area covered and ARG1+ microglia number per area) and two-sided Mann–Whitney U-test (for ARG1+ microglia number). Source data
Fig. 2
Fig. 2. ARG1+ microglia have a site-specific distribution in the brains of P10 and P28 WT mice.
a, ARG1+ microglia are found in defined locations in the brain, forming clusters. The largest cluster is found in the BF/vStr (red cluster). Each dot corresponds to a single ARG1+IBA1+ cell (n = 1 animal). Scale bars, x = y = 1,000 μm and z = 5,580 μm (a; P10) and z = 5,845 μm (a; P28). D, dorsal; V, ventral; P, posterior; L, lateral. b, Registration of iDISCO+ to the Allen Mouse Brain map of the BF/striatum (n = 3 P28 male animals). The percentage of area (pixels) that ARG1+ microglia occupy, accompanied by a graphical illustration and absolute number of ARG1+ microglia in each brain area, as quantified by iDISCO+ is shown. Each circle corresponds to one animal. Data are shown as mean ± s.e.m. The schematic in b was adapted from the Allen Brain Institute Reference Atlas (http://mouse.brain-map.org). Source Data Fig. 2b contains definitions for the abbreviations used. Source data
Fig. 3
Fig. 3. The ARG1+ microglia transcriptome is substantially different than that of neighboring ARG1 microglia in female and male P13 mice.
a, ARG1+ microglia were isolated from P13 YARG mice. Three to five brains were dissected from either female or male mice per biological replicate (n = 3 litters per sex). Tissues were ground on ice before performing Percoll gradient centrifugation. ARG1 microglia and ARG1+ microglia were sorted by flow cytometry, followed by RNA-seq. b,c, Heat map (b) and volcano plot (c) of up- and downregulated (at least twofold) genes in ARG1–YFP+ and ARG1–YFP microglia. Only validated genes are included in this list. d, List of the 20 most upregulated genes in ARG1–YFP+ microglia. e, ARG1–YFP+ (and ARG1–YFP) microglia express high numbers of transcripts of homeostatic microglial genes. Data in d and e are shown as mean ± s.e.m. P values (two sided) attained by the Wald test are corrected for multiple testing using the Benjamini–Hochberg method (Padj). Statistically significant differences were not measured for d and e. Source data
Fig. 4
Fig. 4. ARG1+ microglia contain more inclusions than ARG1 microglia in the BF of P13 YARG mice.
a, Representative transmission electron microscopy images showing the ultrastructure of ARG1 and ARG1+ microglia from P13 YARG female brains in the BF/vStr. b,c, Quantitative analysis of intracellular features (b) and intracellular relationships (c; n = 3 female animals); total inclusions, P = 0.0283; empty inclusions, P = 0.0454. d, In the WT P28 BF/vStr, ARG1+ microglia are in close proximity to cholinergic neurons, as detected with an antibody to p75NTR (n = 3). Scale bars, 5 μm. The yellow square indicates the location of the corresponding images below; cyan, axon terminals; red, inclusion with content; orange, empty inclusion; green, mitochondria; blue, holy mitochondria; purple, secondary lysosome; N, neuron; asterisk, endoplasmic reticulum; blue line, cell membrane; orange line, nuclear membrane. Data are shown as mean ± s.e.m. Statistically significant differences were determined by paired two-sided t-tests (for total inclusions, total inclusion with content, inclusion with axon terminal, empty inclusion, endoplasmic reticulum, contact with neuron and contact with axon terminal) or two-sided Wilcoxon matched-pairs signed-rank test (for contact with cleft); *P ≤ 0.05. Source data
Fig. 5
Fig. 5. Arg1 microglial cKO leads to an impaired cognition phenotype in 2- to 3-month-old female mice.
a,b, Strategy for Arg1-cKO and subsequent behavioral studies. c, Percentage of entries in each arm in relation to the percentage of the first session was determined; entries in novel arm, P = 0.0058. d, Short-term memory and long-term memory were expressed as a discrimination index (number novel – number familiar)/(number novel + number familiar) taking into account the training index; long-term memory, P = 0.0148. Each triangle corresponds to one animal; female Arg1-control n = 11 (c) and n = 10 (d) and Arg1-cKO n = 9 (c) and n = 8 (d); male Arg1-control n = 10 (c) and Arg1-cKO n = 6 (c). Data are shown as mean ± s.e.m. Statistically significant differences were determined by two-sided Mann–Whitney U-test (for females Y maze/novel arm) and unpaired two-sided t-tests (for males Y maze/novel arm and females object recognition memory); *P < 0.05 and **P ≤ 0.01. Source data
Fig. 6
Fig. 6. The Arg1-cKO hippocampi of 2- to 3-month-old female mice receive reduced cholinergic innervation.
af, Microphotographs of sagittal sections of Arg1-control (ad) and Arg1-cKO (e,f) P20 female hippocampi. ChAT immunoreactivity was revealed by using DAB as a chromogen. Triangular or ovoid immunoreactive ChAT interneurons were observed in the CA3 field of the Arg1-control hippocampus (a,b, arrows). Cholinergic axons show the characteristic varicosities (bd,f, arrowheads) of the boutons of en passant synapses. At the pyramidal cell layer (pyr), immunoreactive fibers delineate the pyramidal neuronal somata (so; d,f, asterisk). g, Quantitative analysis demonstrates that the female Arg1-cKO hippocampus receives less cholinergic innervation than the Arg1-control hippocampus; P = 0.0016. Each triangle corresponds to one animal (n = 4). Scale bars, 500 µm (a,e), 50 µm (d,f) and 20 µm (b,c). Data are shown as mean ± s.e.m. Statistically significant differences were determined by an unpaired two-sided t-test; **P ≤ 0.01. Source data
Fig. 7
Fig. 7. Arg1 microglial cKO affects dendrite maturation in the hippocampus of 2- to 3-month-old female mice.
a,b, Coronal Golgi–Cox-stained sections of female P60 Arg1-cKO and control brains. Hippocampal CA1 and DG regions in which secondary pyramidal and secondary granule cell dendrites arise from the main one, respectively, were used for spine counts. cf, Graphical representation of differences between spines in the hippocampal CA1 (c,e) and DG (d,f). CA1 length, P = 0.0023; CA1 width, P = 0.0191; CA1 length:width, P = 0.0006; DG width, P = 0.0114; DG length:width, P = 0.0251; CA1 long thin (%), P = 0.0571; CA1 branched (%), P = 0.0273; DG long thin (%), P = 0.0318; DG stubby (%), P = 0.0087; DG branched (%), P = 0.0066; AU, arbitrary units. g, The six main spine categories according to their morphological characteristics, including filopodia (F), long thin (LT), thin (T), stubby (S), mushroom (M) and branched (B). Each triangle corresponds to one animal (female Arg1-control n = 3; female Arg1-cKO n = 3; male Arg1-control n = 2; male Arg1-cKO n = 3). Black scale bars, 200 μm. Orange scale bars, 5 μm. Data are shown as mean ± s.e.m. Statistically significant differences were determined by unpaired two-sided t-tests or two-sided Mann–Whitney U-test (for filopodia); *P ≤ 0.05, **P ≤ 0.01 and **P = 0.0006. Source data
Fig. 8
Fig. 8. LTP is prevented in 2- to 3-month-old female Arg1-cKO mice.
a, Time course of fEPSPs before and after LTP induction in male Arg1-control (blue circles; n = 8), female Arg1-control (red circles; n = 8), male Arg1-cKO (light blue circles; n = 9) and female Arg1-cKO (light red circles; n = 13) mice. The inset traces show fEPSPs before (1) and 60 min (2) and 120 min (3) after the plasticity protocol. Arg1-control male: 161 ± 7% (E-LTP) and 167 ± 7 % (L-LTP); Arg1-control female: 157 ± 6% (E-LTP) and 165 ± 6% (L-LTP); Arg1-cKO male: 129 ± 6% (E-LTP) and 139 ± 6% (L-LTP); Arg1-cKO female: 114 ± 3% (E-LTP) and 112 ± 4% (L-LTP). b,c, Histograms show a summary of the results for E-LTP (b) and L-LTP (c). E-LTP, Arg1-control male versus Arg1-cKO male, P = 0.003; E-LTP, Arg1-control female versus Arg1-cKO female, P < 0.001; E-LTP, Arg1-cKO male versus Arg1-cKO female, P = 0.015; L-LTP, Arg1-control male versus Arg1-cKO male, P = 0.006; L-LTP, Arg1-control female versus Arg1-cKO female, P < 0.001; L-LTP, Arg1-cKO male versus Arg1-cKO female, P < 0.001. d, Short-term synaptic potentiation (STP) is not affected in any of the groups studied. Arg1-control male: 196 ± 17%, n = 8; Arg1-control female: 178 ± 17%, n = 8; Arg1-cKO male: 171 ± 16%, n = 9; Arg1-cKO female: 161 ± 14%, n = 13. e, PPR summary data. Arg1-control male: 1.53 ± 0.1 after LTP versus 1.52 ± 0.08 at baseline, n = 7; Arg1-control female: 1.84 ± 0.15 after LTP versus 1.75 ± 0.12 at baseline, n = 8; Arg1-cKO male: 1.69 ± 0.14 after LTP versus 1.61 ± 0.13 at baseline, n = 9; Arg1-cKO female: 1.49 ± 0.08 after LTP versus 1.78 ± 0.16 at baseline, n = 10; PPF, paired-pulse facilitation. f, Input–output (I/O) curves for Arg1-control male (n = 6), Arg1-control female (n = 6), Arg1-cKO male (n = 6) and Arg1-cKO female (n = 6) mice. The number of slices is shown in parentheses. Data are shown as mean ± s.e.m. Statistically significant differences were determined by unpaired two-sided t-tests, with P values corrected using the Bonferroni method for multiple comparisons; *P < 0.05 and **P < 0.01. Source data
Extended Data Fig. 1
Extended Data Fig. 1. ARG1-positive cells that are not microglia in WT mouse brain.
a-b, ARG1+/IBA1cells in the cerebellum and around the ventricles (arrowheads) both at P10 (a) and at P28 (b) (representative images from 3 female animals per group). Scale bars, x = 50 μm. Yellow squares indicate location of the corresponding images on their left; grey lines indicate the BF/vStr region.
Extended Data Fig. 2
Extended Data Fig. 2. Arg1+microglia co-exist with Arg1negative-microglia in the same vicinity in P10, P28 and P100 WT mouse brain.
a, Arg1-YFP-positive microglia in male YARG mice, as recognised by α-GFP and α-ARG1 antibodies (representative image from 3 female animals). b, Arg1+microglia (arrows) and Arg1-negative-microglia (arrowheads) during mouse brain development. c, Arg1+microglia in BF/vStr at P10, P28 and P100 (representative images from 3 female animals per group). Each white dot represents a single Arg1+microglia and has been manually annotated. Scale bars, x = 50 μm, z = 10 μm (a), x = 10 μm (b), x = 1000 μm, z = 4 μm (c). Yellow squares indicate location of the corresponding images on their left; grey lines indicate the BF/vStr region.
Extended Data Fig. 3
Extended Data Fig. 3. Morphometric comparison of P10 and P28 Arg1-negative-microglia versus Arg1+microglia from basal forebrain.
a, Illustration of digital reconstruction of two Arg1+microglia. b, Morphometric comparisons of Arg1+microglia and Arg1-negative-microglia from P10 and P28 mouse brain. Each circle or square represents data from a single animal (n = 4 female animals per group). P28, Processes/Soma, P = 0.0259. Scale bar, x = 10 μm, z = 15 μm. Data in b represented as mean ± s.e.m. Statistical significances were determined by paired two-sided t tests; *P < 0.05, n.s. indicates not significant. Source data
Extended Data Fig. 4
Extended Data Fig. 4. Arg1+microglia co-localize with CX3CR1-GFP but not with CD206 in P10 mouse brains.
a, CX3CR1-GFP+/ARG1 + microglia (arrows) coexist with CX3CR1-GFP+/ARG1microglia (arrowheads) in P10 BF/vStr (representative image from 3 female animals). b, ARG1-positive cells around the ventricles (triple arrows) are not CX3CR1-GFP-positive (see also Extended Data Fig. 1) (representative image from 3 female animals). c, Arg1+microglia do not express the perivascular macrophage marker CD206 (arrows), while perivascular macrophages in this brain area express ARG1 (arrowheads). Note that Arg1+microglia are always ramified, while perivascular macrophages are amoeboid (representative image from 3 female animals). Scale bars, x = 50 μm, z = 10 and 8.5 μm (for a and c, respectively). Yellow squares indicate location of the corresponding images on their left; grey lines indicate the BF/vStr region.
Extended Data Fig. 5
Extended Data Fig. 5. P13 Arg1+microglia from basal forebrain do not have sex-specific signatures.
a, Gating strategy for fluorescent-activated cell sorting of ARG1-YFP-positive (population, Pop.8) and ARG1-YFP-negative (Pop.7) microglia. b, Volcano plots of differentially expressed genes between males and females in ARG1-YFP-positive (Pop.8) and ARG1-YFP-negative (Pop.7) sorted microglia. Three to five brains were dissected from either female or male animals per biological replicate (n = 3 litters per sex). P-values (two-sided) attained by the Wald test are corrected for multiple testing using the Benjamini and Hochberg method.
Extended Data Fig. 6
Extended Data Fig. 6. P10, P13 and P28 female and male mice do not have notable differences in Arg1+microglia numbers.
a-b, Quantification of Arg1+microglia from matching sections of P10 (a) and P28 (b) wild type animals (n = 4 animals per sex) and representative DAB stainings. c, Quantification of ARG1-YFP-positive microglia (Pop.8, as described in Extended Data Fig. 5a) from P13 Arg1-YFP female and male animals (n = 4 animals per sex). Each arrow corresponds to one animal. Scale bars, 500 μm. Data represented as mean ± s.e.m. Statistical significances were determined by two-sided unpaired t tests (a, b, and c) or two-sided Mann-Whitney U test (for Arg1+microglia number in a). n.s. indicates not significant. Source data
Extended Data Fig. 7
Extended Data Fig. 7. P13 Arg1+microglia cannot be classified as either classical or alternative activated microglia.
a, Gating strategy for RT-qPCR was identical to gating for sorting prior to RNA-Seq (Extended Data Fig. 5a). b, RT-qPCR indicates that Arg1 gene expression is restricted to the ARG1-YFP + /CX3CR1-/CD206 (Pop.8) population. Three to five brains were dissected from either female or male animals per biological replicate (females, n = 8 litters; males, n = 12 litters). Female, ARG1negative - ARG1positive, P = 0.0096; male, ARG1negative - ARG1positive, P < 0.0001. c, Microglia (μG) are known to express low levels of Mrc1 (gene expressing CD206) (a, reference), in substantially lower levels than macrophages (MΦ) (females, n = 6 litters; males, n = 5 litters). Female, macrophages - microglia, P < 0.0001; male, macrophages - microglia, P < 0.0001. d, Although ARG1 is long been considered a marker of alternative activation, P13 Arg1+microglia (and P13 Arg1-negative-microglia), express both classical and alternative activation markers (females, n = 3 litters; males, n = 3 litters, data derived from RNA-Seq). e-f, Differentially expressed genes from RNA-Seq validated by immunohistochemistry (representative image from 3 female animals) (e) and RT-qPCR (n= min. 5 litters) (f). Apoe, P = 0.0049; Igf1, P = 0.0005; Lpl, P = 0.0062; Spp1, P = 0.0101. Scale bars, 50 μm. g, Venn diagram showing overlaps between Arg1+microglia and Arg1-negative-microglia presented here and “cluster 1” (reference) (FC ≥ 1.5). Note: only validated genes have been included in this list. Data in b, c and f are represented as mean ± s.e.m. Statistical significances were determined by Kruskal-Wallis test (b, Arg1), ANOVA (c, CD206), and unpaired t tests (f); all P-values are two-sided, and P-values for multiple comparisons were corrected using Dunn’s method (b) and Bonferroni’s method (c), respectively. *P < 0.05; **P < 0.01; ***P < 0.001; ****P < 0.0001, n.s. indicates not significant. Source data
Extended Data Fig. 8
Extended Data Fig. 8. Arg1+microglia are efficiently knocked down in female and male Arg1-cKO.
a, Staining of matching sections shows that in Arg1-cKO animals, only few Arg1+microglia remain when compared to Arg1-Control. Quantification of Arg1+microglia from matching sections (n = 3 animals per group). Female, Arg1ControlArg1cKO, P < 0.0001; male, Arg1ControlArg1cKO, P < 0.0001. Scale bar, x = 1000 μm. b, Arg1+microglia co-localize with the marker GALECTIN-3, as inferred by our RNA-Seq analysis. Scale bar, x = 100 μm, z = 10 μm. In Arg1-cKO basal forebrain, the percentage of CLEC7A +/IBA1 + cells is not statistically significant different to the percentage of CLEC7A + /IBA1 + cells in the basal forebrain of Arg1-Control animals. c, Similar for GALECTIN-3 + /IBA1 + cells. d, Mean intensity of the lysosomal marker CD68 in female and male Arg1+microglia in BF. The images in b, c and e are representative of 4 female animals per group. Scale bars, x = 50 μm, z = 5 μm. e, CD68 expression in BF of Arg1-Control and Arg1-cKO basal forebrain. Scale bars, x = 100 μm, z = 5 μm. Data in a-d are represented as mean ± s.e.m. Statistically significant differences were determined by ANOVA (a), Mann-Whitney U (b), or unpaired t tests (c and d). All P-values are two-sided, and P-values for multiple comparisons were corrected using Bonferroni’s method (a). ****P < 0.0001, n.s. indicates not significant. Source data
Extended Data Fig. 9
Extended Data Fig. 9. Arg1-cKO female and male animals do not show motoric phenotypes.
a-e, Arg1-cKO animals and controls were assessed for motoric (a-c) and memory (d) phenotypes. Each triangle corresponds to one animal. Female Arg1-Control n = 10 (a-c), n = 11 (d) and Arg1-cKO n = 9 (a-d); male Arg1-Control n = 8 (a-c), n = 10 (d) and Arg1-cKO n = 6 (a-c), n = 7 (d). Males, rotarod #falls, training 4, P = 0.0184. Data represented as mean ± s.e.m. Statistically significant differences were determined by unpaired two-sided t tests. *P < 0.05. Source data
Extended Data Fig. 10
Extended Data Fig. 10. P20 female medial septum and Broca’s diagonal band do not show differences in number of ChAT positive neurons between Arg1-Control and Arg1-cKO brains.
a-i, Microphotographs of coronal sections of Arg1-Control (a-e and l-p) and Arg1-cKO (f-i and q-u) P20 forebrain. Choline acetyltransferase immunoreactive cells somata are uniformly distributed through the medial septum (MS; b-d and g-h) and the Broca’s diagonal band (DB; e and i). j-k, ChAT positive neuron cell count in MS and NBDN did not reveal differences between the two genotypes (j, n = 3 and k, n = 6 animals). l-u, Golgi-Cox method shows the morphology of the neurons of the medial septum (m-n and r-s) and the diagonal band of Broca (o-p and t-u). Dendrites with long spines (arrowheads) arose from fusiform or triangular-shaped neuronal bodies (arrows), and not differences between Arg1-Control and Arg1-cKO neurons are evident. Microphotographs a and f are DAPI counterstained to help in the identification of anatomical landmarks. Low magnification l and q microphotographs illustrate the medial septum (squares, m and r) and the diagonal band of Broca (squares, o and t) areas. Scale bars, 1000 µm (a, f, l and q), 100 µm (b, c, g, h, m, o, r, t), and 20 µm (d, e, h, i, n, p, s, u). Data in j and k are in mean ± s.e.m. Statistical significances were determined by unpaired two-sided t tests. n.s. indicates not significant. Source data

References

    1. Tau GZ, Peterson BS. Normal development of brain circuits. Neuropsychopharmacology. 2010;35:147–168. doi: 10.1038/npp.2009.115. - DOI - PMC - PubMed
    1. Monier A, et al. Entry and distribution of microglial cells in human embryonic and fetal cerebral cortex. J. Neuropathol. Exp. Neurol. 2007;66:372–382. doi: 10.1097/nen.0b013e3180517b46. - DOI - PubMed
    1. Ginhoux F, et al. Fate mapping analysis reveals that adult microglia derive from primitive macrophages. Science. 2010;330:841–845. doi: 10.1126/science.1194637. - DOI - PMC - PubMed
    1. De S, et al. Two distinct ontogenies confer heterogeneity to mouse brain microglia. Development. 2018;145:dev152306. doi: 10.1242/dev.152306. - DOI - PMC - PubMed
    1. Squarzoni P, et al. Microglia modulate wiring of the embryonic forebrain. Cell Rep. 2014;8:1271–1279. doi: 10.1016/j.celrep.2014.07.042. - DOI - PubMed

Publication types