. 2023 May;29(5):1146-1154.
doi: 10.1038/s41591-023-02343-2. Epub 2023 May 11.

Accelerated waning of the humoral response to COVID-19 vaccines in obesity

Affiliations

Accelerated waning of the humoral response to COVID-19 vaccines in obesity

Agatha A van der Klaauw et al. Nat Med. 2023 May.

Abstract

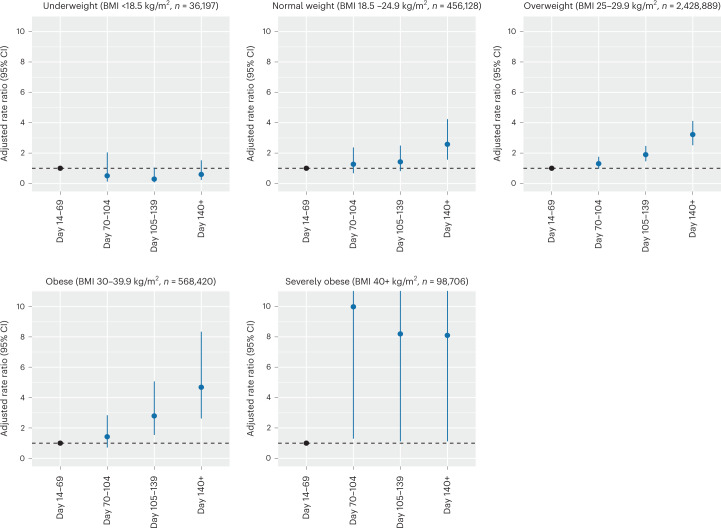
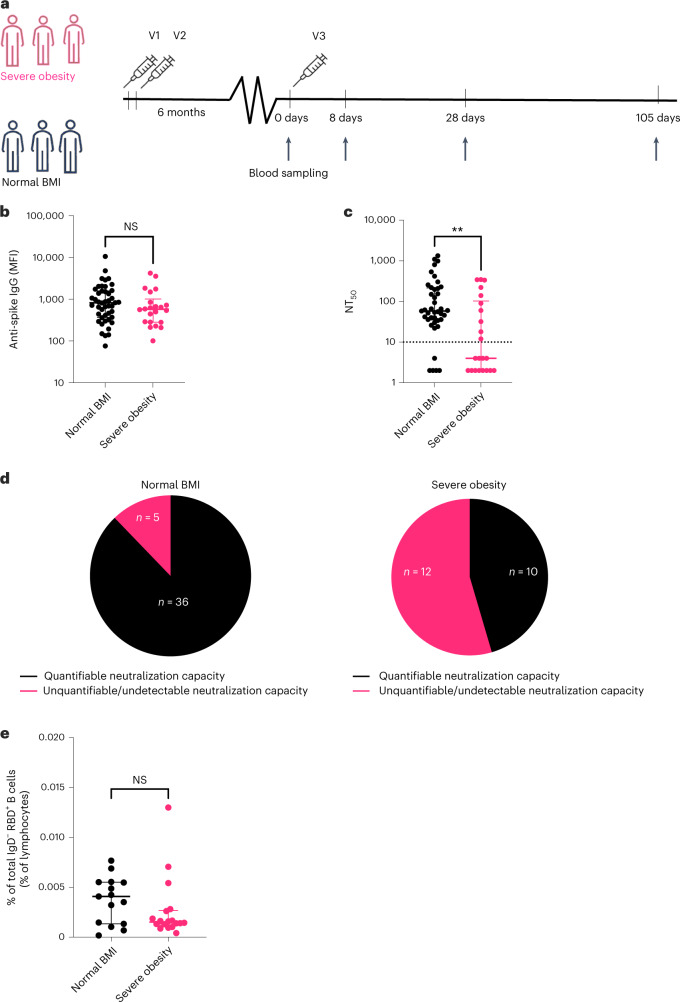
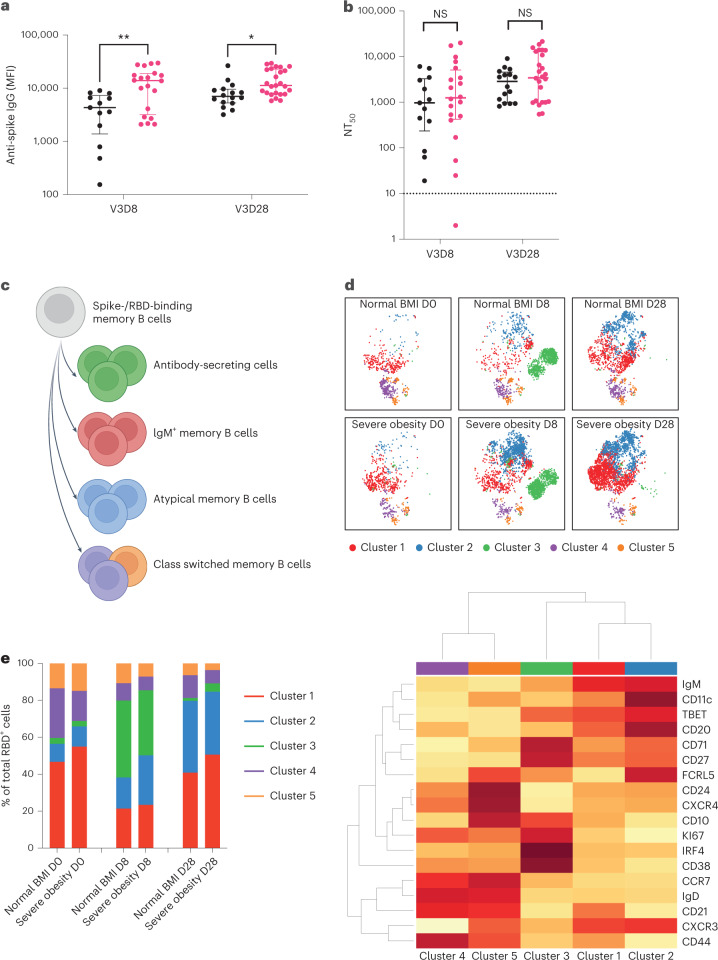
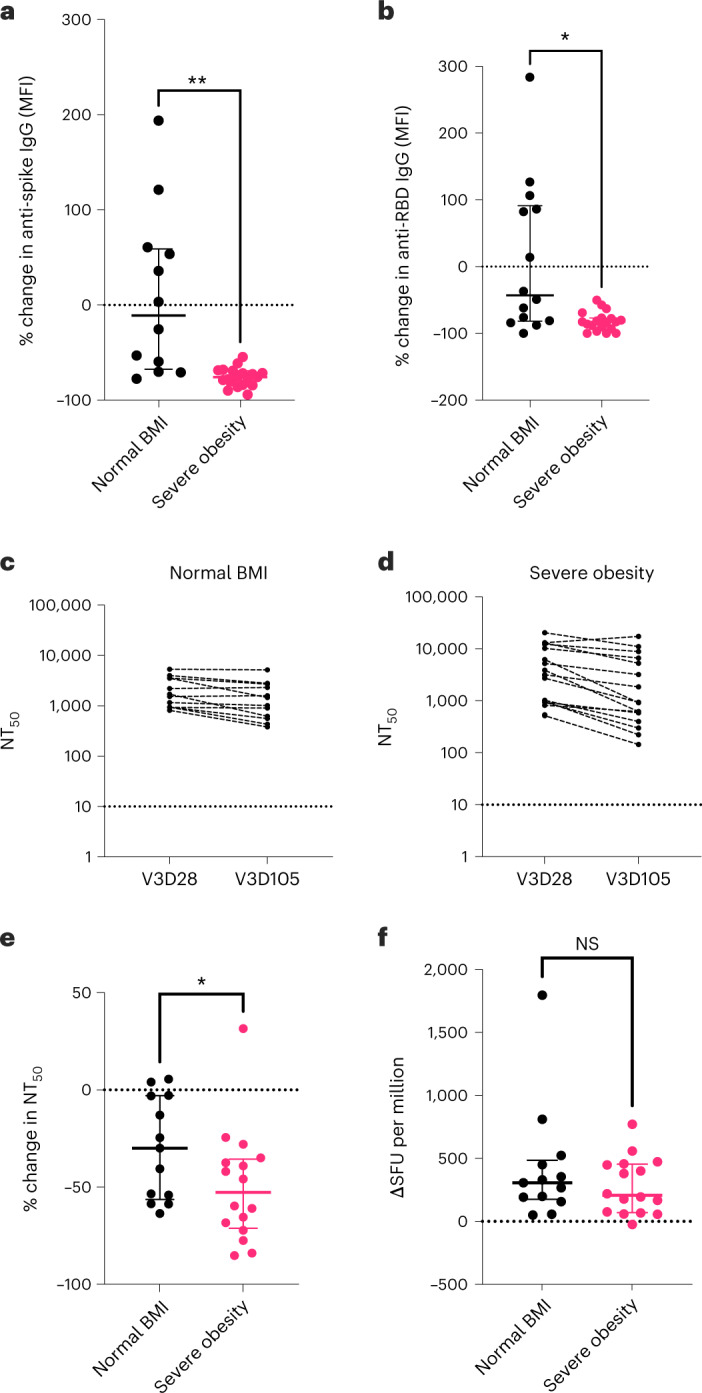
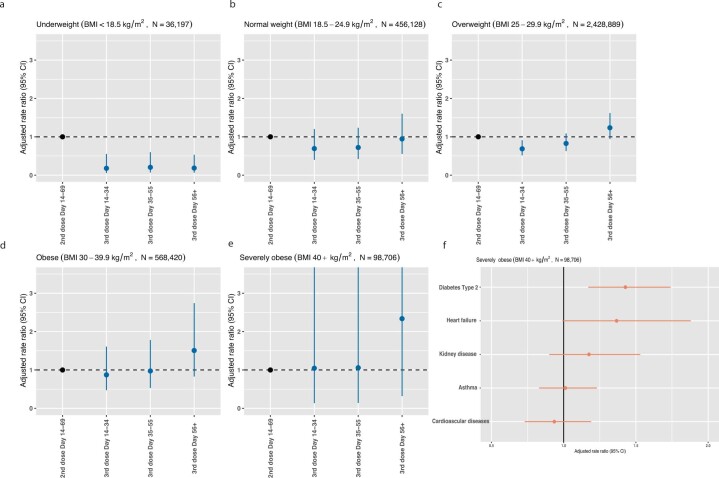
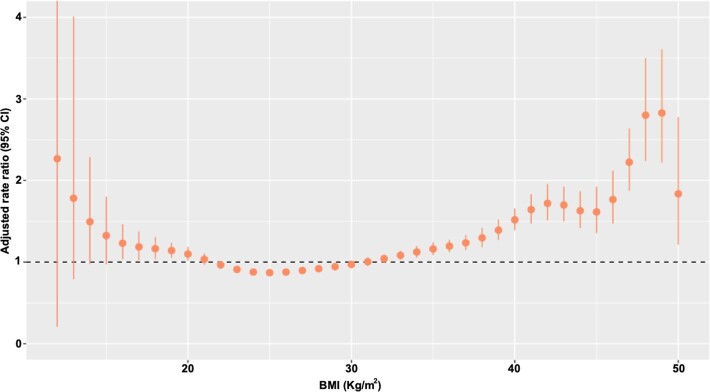
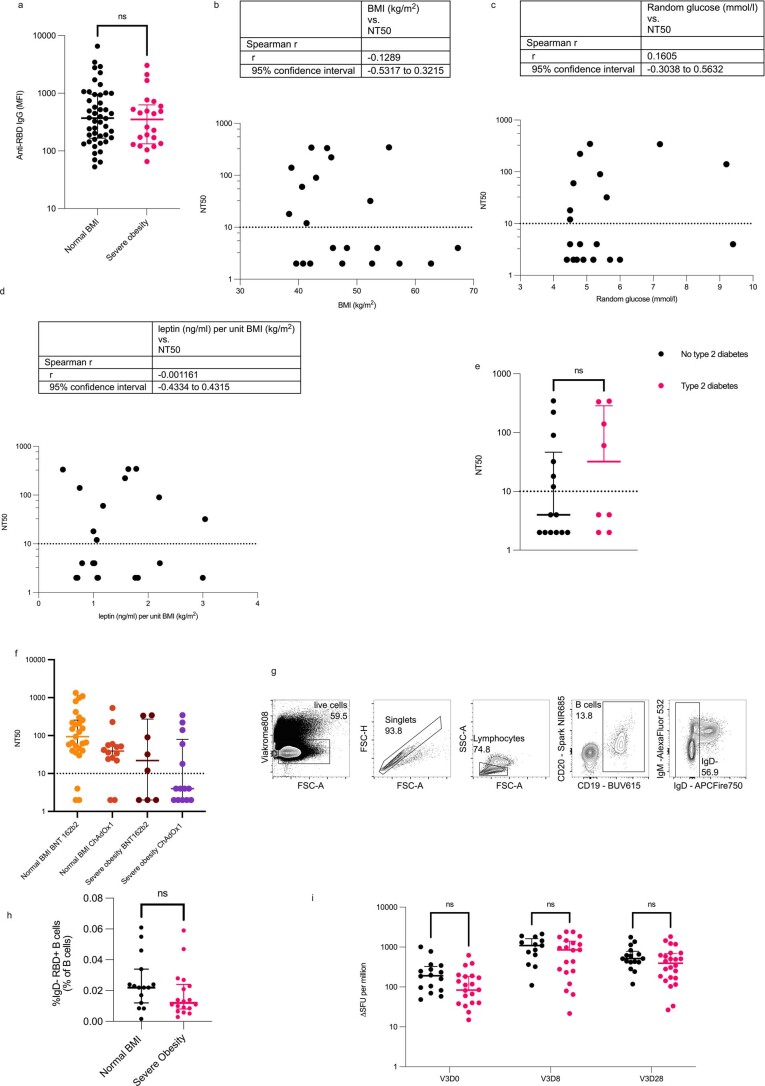
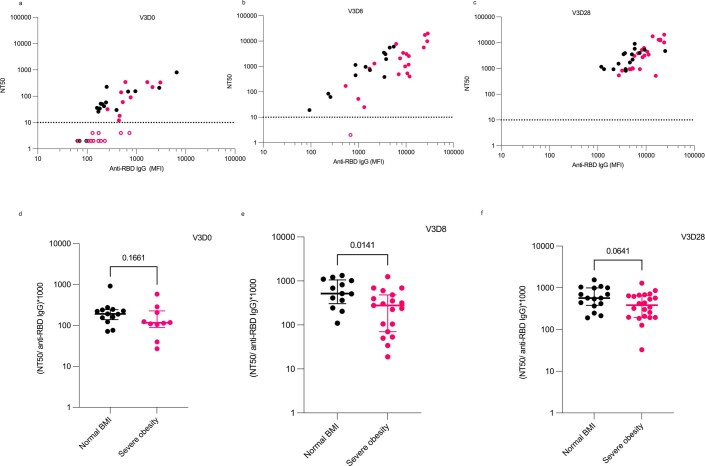
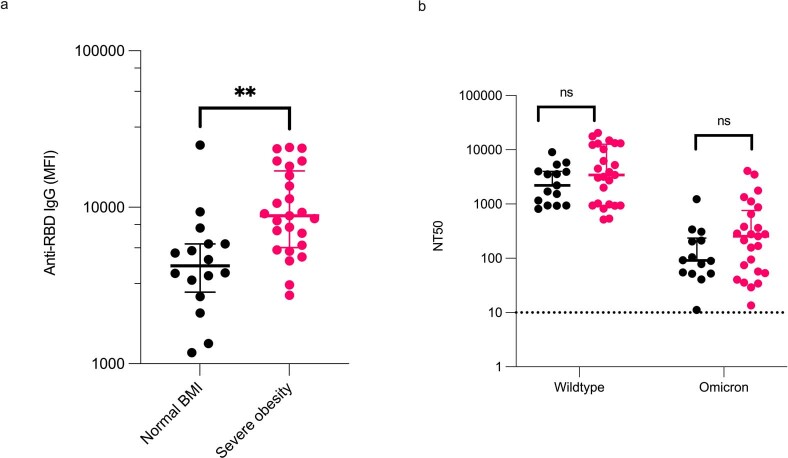
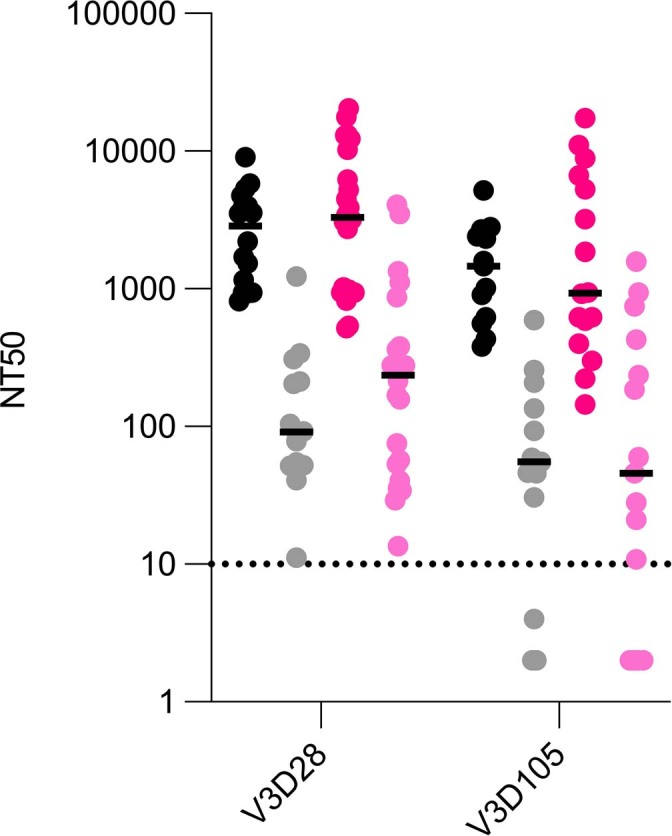
Obesity is associated with an increased risk of severe Coronavirus Disease 2019 (COVID-19) infection and mortality. COVID-19 vaccines reduce the risk of serious COVID-19 outcomes; however, their effectiveness in people with obesity is incompletely understood. We studied the relationship among body mass index (BMI), hospitalization and mortality due to COVID-19 among 3.6 million people in Scotland using the Early Pandemic Evaluation and Enhanced Surveillance of COVID-19 (EAVE II) surveillance platform. We found that vaccinated individuals with severe obesity (BMI > 40 kg/m2) were 76% more likely to experience hospitalization or death from COVID-19 (adjusted rate ratio of 1.76 (95% confidence interval (CI), 1.60-1.94). We also conducted a prospective longitudinal study of a cohort of 28 individuals with severe obesity compared to 41 control individuals with normal BMI (BMI 18.5-24.9 kg/m2). We found that 55% of individuals with severe obesity had unquantifiable titers of neutralizing antibody against authentic severe acute respiratory syndrome coronavirus 2 (SARS-CoV-2) virus compared to 12% of individuals with normal BMI (P = 0.0003) 6 months after their second vaccine dose. Furthermore, we observed that, for individuals with severe obesity, at any given anti-spike and anti-receptor-binding domain (RBD) antibody level, neutralizing capacity was lower than that of individuals with a normal BMI. Neutralizing capacity was restored by a third dose of vaccine but again declined more rapidly in people with severe obesity. We demonstrate that waning of COVID-19 vaccine-induced humoral immunity is accelerated in individuals with severe obesity. As obesity is associated with increased hospitalization and mortality from breakthrough infections, our findings have implications for vaccine prioritization policies.


Conflict of interest statement

A.S. is a member of the Scottish Government’s Standing Committee on Pandemic Preparedness and the Risk Stratification Subgroup of the UK Government’s New and Emerging Respiratory Virus Threats Advisory Group (NERVTAG). He was a member of AstraZeneca’s Thrombotic Thrombocytopenic Task Force. All roles are unremunerated. S.J.D. is a Scientific Advisor to the Scottish Parliament on COVID-19, for which she receives a fee. I.S.F. has consulted for Eli Lilly, Novo Nordisk and Rhythm Pharmaceuticals on weight loss drugs. All other authors have no conflicts of interest to declare.

Figures

Fig. 1
Fig. 1. Risk of severe COVID-19 outcomes after primary vaccination and relationship with BMI.
Panels depict the aRRs for hospitalization or death (severe COVID-19 outcomes) with time after the second COVID-19 vaccine dose for individuals in each BMI category in the EAVE-II cohort, Scotland. aRRs were estimated from five different models, one for each BMI category. aRRs were calculated against baseline risk at 14–69 d after the second vaccine dose. Error bars indicate 95% CIs. The number (n) of individuals in each BMI category is indicated. Hospitalization and mortality from breakthrough infections after the second vaccine dose presented more quickly in individuals with severe obesity (after 10 weeks; that is, 70 d) and obesity (15 weeks; that is; 105 d) than in individuals with normal weight (20 weeks; that is, 140 d). aRRs are provided as mean with 95% CIs. Source data
Fig. 2
Fig. 2. COVID-19 vaccine-induced immunity in individuals with severe obesity and individuals with normal weight 6 months after primary vaccination.
a, Detailed longitudinal immunophenotyping studies were performed on individuals with severe obesity (magenta, n = 22) and normal BMI control individuals (black, n = 46). Samples were obtained 6 months after the second dose of COVID-19 vaccine (V2) administered as part of their primary vaccination course and at several timepoints after the third dose (V3) as indicated. b, Anti-spike IgG titers are similar in individuals with severe obesity (n = 22, magenta) and individuals with normal weight (n = 41, black) 6 months after primary vaccination course. Horizontal bars indicate the median and interquartile range. c, NT50 against wild-type SARS-CoV-2, with the dotted line indicating the limit of quantification. Horizontal bars indicate the median and interquartile range. **P = 0.061 in two-sided Mann–Whitney test. d, Proportion of individuals in both groups with unquantifiable or undetectable versus quantifiable titers of neutralizing antibodies. e, Frequency of antigen-experienced (IgD) RBD-binding (RBD+) B cells 6 months after the primary vaccination course. Data are expressed as a percentage (%) of the total number of lymphocytes in individuals with severe obesity (n = 18, magenta) and individuals with normal weight (n = 15, black). Horizontal bars indicate the median and interquartile range. P values are from Mann–Whitney U-tests. NS, not significant. Source data
Fig. 3
Fig. 3. Immune response to third (booster) dose COVID-19 vaccination.
Individuals with severe obesity (n = 25, magenta) and normal BMI controls (n = 16, black) were studied at day 8 (D8) and day 28 (D28) after the third vaccine dose (V3). a, Levels of anti-spike IgG antibodies (MFI) at day 8 (**P = 0.0024, mixed-effects analysis with Sidak’s multiple comparisons tests) and day 28 (*P = 0.0199, mixed-effects analysis with Sidak’s multiple comparisons tests). Horizontal bars indicate the median and interquartile range. b, NT50 against wild-type SARS-CoV-2 at days 8 and 28, with the dotted line indicating the limit of quantification. Horizontal bars indicate the median and interquartile range. c, Schematic depicting the differentiation of B cells in response to vaccine administration. d, High-dimensional spectral flow cytometry of SARS-CoV-2 RBD-binding B cells. tSNE and FlowSOM analyses of multi-parameter flow cytometry of CD19+ RBD-binding B cells from individuals with normal weight and individuals with severe obesity before (V3D0), 8 d after (V3D8) and 28 d after (V3D28) a booster mRNA vaccine (top panel). Bottom panel: heat map of row-normalized mean protein expression on different clusters of cells; red indicates high expression, and yellow indicates low expression. e, Frequency of RBD-binding B cells between groups over time. NS, not significant. Source data
Fig. 4
Fig. 4. Third-dose COVID-19 vaccine-induced immunity in individuals with severe obesity.
Individuals with severe obesity (n = 19, magenta) and normal BMI controls (n = 14, black) were studied at day 28 and day 105 after the third vaccine dose. a, Percentage (%) change in anti-spike IgG antibody levels (MFI). Horizontal bars indicate the median and interquartile range (**P = 0.0057 in Welch’s t-test). b, Percentage (%) change in anti-RBD IgG antibody levels between these two timepoints. Horizontal bars indicate the median and interquartile range (*P = 0.0102 in Welch’s t-test). c,d, NT50 measured at 28 d (V3D28) and 105 d (V3D105) after third-dose vaccination (V3) in normal BMI controls (c) and individuals with severe obesity (d). e, Percentage (%) change in NT50 against wild-type SARS-CoV-2, with the dotted line indicating the limit of quantification. Horizontal bars indicate the median and interquartile range (*P = 0.0448 in Mann–Whitney test). Dotted line indicates no change. f, T cell responses quantified by ELISpot. Horizontal bars indicate the median and interquartile range. Individuals who reported a positive SARS-CoV-2 RT–PCR test between day 28 and day 105 or who had positive anti-nucleocapsid antibodies at day 105 were excluded from these analyses. NS, not significant. Source data
Extended Data Fig. 1
Extended Data Fig. 1. Adjusted rate ratios for hospitalization and death due to COVID-19 in vaccinated people.
a-e, Adjusted rate ratios for hospitalization or death following third (booster) doses per BMI category (n = 36197 BMI < 18.5 kg/m2, n = 456128 BMI 18.5-24.9 kg/m2, n = 2428889 BMI 25-29.9 kg/m2, n = 568420 BMI 30-39.9 kg/m2, n = 98706 BMI > 40 kg/m2). Adjusted Rate Ratios (aRR) for hospitalisation or death following third (booster) dose for different body mass index (BMI) categories. Error bars indicate 95% confidence intervals. N indicates number of people in each category. f, adjusted rate ratios for hospitalisation and death in severely obese individuals with obesity-associated comorbidities (n = 98706 BMI > 40 kg/m2). aRR are provided as mean with error bars indicating 95% confidence intervals. Source data
Extended Data Fig. 2
Extended Data Fig. 2. Adjusted rate ratios for hospitalization and death due to COVID-19 in vaccinated people using individual BMI values.
Association between BMI (kg/m2) as a continuous trait and adjusted rate ratios (with 95% CI, confidence intervals) for severe COVID-19 outcomes. aRR are provided as mean with error bars indicate 95% confidence intervals.
Extended Data Fig. 3
Extended Data Fig. 3. SARS-CoV-2 vaccine-induced immunity in people with severe obesity and normal BMI.
a, Anti-RBD (receptor binding domain) IgG titres are comparable in 6 months after primary vaccination course (P = 0.5801 in Mann-Whitney U test) in people with severe obesity (N = 22) and normal BMI (46). b-e, Correlation between body mass index (BMI), random blood glucose, leptin levels per unit BMI in people with severe obesity (n = 22) and the presence (=8) or absence of type 2 diabetes (n = 14) and neutralizing capacity (NT50) 6 months after second dose. Non-parametric Spearman’s Rho correlations were calculated between NT50 and clinical parameters. Dotted line indicates the limit of quantification. A Mann-Whitney test was used to compare people with severe obesity with and without diabetes mellitus. f, Neutralizing capacity (NT50) 6 months after second dose by primary vaccination course - Pfizer-BioNTech BNT162b2 mRNA or AstraZeneca ChAdOx1. Dotted line indicates the limit of quantification. g, shows the B cell Pre-gating used in the flow cytometry analysis. h, shows the frequency of antigen-experienced (IgD-) Receptor Binding Domain binding (RBD + ), 6 months after the primary vaccination course; data expressed as a percentage (%) of the total number of B-cells in people with severe obesity (n = 15) and normal BMI (n = 18). Compared in Mann-Whitney U test. i, Antigen-specific T cell responses were measured by ELISpot. Interferon gamma spot forming units (SFU) were quantified. Analysed in mixed effects model. Each symbol represents an individual person and line indicates the median with interquartile range; black symbols indicate people with normal BMI (n = 16) and magenta people with severe obesity (n = 22). Ns, not significant. V3D0 is before third dose vaccination (V3), V3D8 is 8 days after third dose and V3D28 is 28 days after third dose vaccination. Source data
Extended Data Fig. 4
Extended Data Fig. 4. Relationship between anti-RBD IgG antibody levels and neutralizing capacity.
a-c, Correlation between NT50 and anti-RBD IgG (MFI) before (V3D0, a), 8 days after (V3D8, b) and 28 days after (V3D28, c) third dose booster vaccination. d-f, Ratio of (NT50/anti-RBD IgG (MFI))*1000 before (V3D0, d), 8 days after (V3D8, e) and 28 days after (V3D28, f) third dose booster vaccination. Each symbol represents an individual person (controls with normal BMI (n = 16), black; severe obesity (n = 22), magenta). Open symbols represent individuals with unquantifiable or undetectable neutralizing activity. For d-f, median values and interquartile ranges are shown. P-values from Mann-Whitney U tests. Source data
Extended Data Fig. 5
Extended Data Fig. 5. Response to third dose booster vaccination in severe obesity.
a, Anti-RBD (Receptor Binding Domain) IgG levels (MFI, mean fluorescence intensity) were higher in people with severe obesity (magenta, n = 25) compared to individuals with normal BMI (black, n = 16) (**P = 0.0013 in Mann-Whitney U test). Each symbol represents an individual person studied at Day 28; line indicates the median. b, Neutralizing antibody titres (NT50) against the Omicron variant of SARS-CoV-2 were markedly reduced compared with wild type virus (Day 28), but no difference was observed between groups (severe obesity (magenta, n = 15) compared to normal BMI controls (n = 25, black)). Each symbol represents an individual person, horizontal bar indicates the median and interquartile range and p-values are from a Mann-Whitney U test. ns, not significant. Source data
Extended Data Fig. 6
Extended Data Fig. 6. B and T cell response to third dose booster vaccination in severe obesity.
a, Representative high dimensional spectral flow cytometry analysis in participant with severe obesity. Flow cytometric plots of RBD-binding in a patient with severe obesity, prior to (V3D0), eight days after (V3D8) and 28 days after (V3D28) a booster mRNA vaccine. b, Flow cytometric quantification of RBD-binding B cells of activated phenotype in normal BMI individuals (black, n = 20) and participants with severe obesity (magenta, n = 13) 8 days after (V3D8) a third dose mRNA vaccine. Each symbol represents an individual person, horizontal bars indicate the median and interquartile range and p-value is from a Mann-Whitney U test. *P = 0.0333 c, Representative flow cytometric plot-CD71 + IgD CD20 + CD38- gating strategy for S4b. d-e, Flow cytometric quantification of circulating T follicular helper (cTfh) cells (CXCR5 + ICOS + CD38 + FOXP3- CD25- CD4 + cells) in normal BMI individuals (black, n = 13 V3D8, n = 15 V3D28) and participants with severe obesity (magenta, n = 17 V3D8, n = 25 V3D28) 8 days (d) and 28 days (e) after a third dose mRNA vaccine. Each symbol represents an individual person, horizontal bars indicate the median and p-value is from a Mann-Whitney U test. f-g, Flow cytometric quantification of circulating T regulatory cells (FOXP3 + CD25 + CD4 + cells) in normal BMI individuals (black, n = 13 V3D8, n = 15 V3D28) and participants with severe obesity (magenta n = 18 V3D8, n = 25 V3D28) 8 days (f) and 28 days (g) after a third dose mRNA vaccine. h, Representative flow cytometry T cell gating, pre-gated on live, single, lymphocytes. Circulating TFH are gated as (CD19- CD20- CD3 + CD4 + FOXP3- CD25- CXCR5 + ICOS + CD38 + ) and T regulatory cells are gated as (CD19- CD20- CD3 + CD4 + FOXP3 + CD25 + ). Tonsil staining was performed alongside PBMC samples to identify bona fide Tfh cells. Each symbol represents an individual person, horizontal bars indicate the median and interquartile range and p-value is from a Mann-Whitney U test. Source data
Extended Data Fig. 7
Extended Data Fig. 7. Neutralizing capacity against wildtype and Omicron (BA.1) variant SARS-CoV-2 at day 28 and day 105 post-third dose booster vaccination.
NT50s against wildtype (black and magenta symbols) and Omicron (BA.1) variant SARS-CoV-2 (grey and pink) at day 28 and day 105 post-third dose booster vaccination in normal BMI individuals (black and grey, n = 15) and participants with severe obesity (n = 22, magenta and pink). Each symbol represents an individual person, horizontal bars indicate medians. Dotted line, limit of quantification. Source data
Extended Data Fig. 8
Extended Data Fig. 8. Quality assurance and calibration of assays for neutralizing antibodies to SARS-CoV-2.
a-b, Linearity of the assay. Neutralization curves (a) and corresponding expected/obtained NT50s (b) against wildtype SARS-CoV-2 for a dilution series of high titre positive control serum. Infection of reporter cells is quantified as % maximum luminescence at 16 h. Mean values ± SEM are shown for experiments performed in duplicate (a). Solid line, line of best fit (dilutions above the limit of quantification). R2, coefficient of determination (dilutions above the limit of quantification). Dotted line, limit of quantification. c, Precision of the assay. NT50s against wildtype SARS-CoV-2 for a medium titre positive control serum sample from 18 independent experiments are summarised as a Tukey boxplot. CV, inter-assay coefficient of variation. Dotted line, limit of quantification. d, External validation of the assay. Comparison of NT50s against both wildtype (blue) and Omicron (BA.1) variant (orange) SARS-CoV-2 from this paper (reporter cells, Cambridge) with results of Focus Reduction Neutralization Tests (FRNTs, Oxford) for a panel of 28 serum samples from convalescent plasma donors. rho, Spearman’s rank correlation coefficient. Dotted line, limit of quantification. e-f, Calibration of the assay. Neutralization curves (e) and corresponding NT50s (f) against wildtype SARS-CoV-2 for WHO International Standard 20/136 (WHO IS 20/136) from 5 independent experiments. Infection of reporter cells is quantified as % maximum luminescence at 16 h. Mean values ± SEM are shown for experiments performed in duplicate (e). NT50s are summarised as a Tukey boxplot (e Minimum: 654, Maximum: 1550, Median: 1006, 25% percentile: 718. 75% percentile: 1157 and f Minimum: 1315, Maximum: 3634, Median: 1851, 25% percentile: 1485, 75% percentile: 2822, Geometric Mean: 1967). GM, geometric mean. Dotted line, limit of quantification. Source data

References

    1. Popkin BM, et al. Individuals with obesity and COVID-19: a global perspective on the epidemiology and biological relationships. Obes. Rev. 2020;21:e13128. doi: 10.1111/obr.13128. - DOI - PMC - PubMed
    1. Gao M, et al. Associations between body-mass index and COVID-19 severity in 6.9 million people in England: a prospective, community-based, cohort study. Lancet Diabetes Endocrinol. 2021;9:350–359. doi: 10.1016/S2213-8587(21)00089-9. - DOI - PMC - PubMed
    1. Arbel R, et al. BNT162b2 vaccine booster and mortality due to Covid-19. N. Engl. J. Med. 2021;385:2413–2420. doi: 10.1056/NEJMoa2115624. - DOI - PMC - PubMed
    1. Barron E, et al. Associations of type 1 and type 2 diabetes with COVID-19-related mortality in England: a whole-population study. Lancet Diabetes Endocrinol. 2020;8:813–822. doi: 10.1016/S2213-8587(20)30272-2. - DOI - PMC - PubMed
    1. Grasselli G, et al. Baseline characteristics and outcomes of 1591 patients infected with SARS-CoV-2 admitted to ICUs of the Lombardy Region, Italy. JAMA. 2020;323:1574–1581. doi: 10.1001/jama.2020.5394. - DOI - PMC - PubMed

Publication types