. 2023 May;29(5):1201-1210.
doi: 10.1038/s41591-023-02325-4. Epub 2023 May 11.

Machine learning for diagnosis of myocardial infarction using cardiac troponin concentrations

Collaborators, Affiliations

Machine learning for diagnosis of myocardial infarction using cardiac troponin concentrations

Dimitrios Doudesis et al. Nat Med. 2023 May.

Abstract

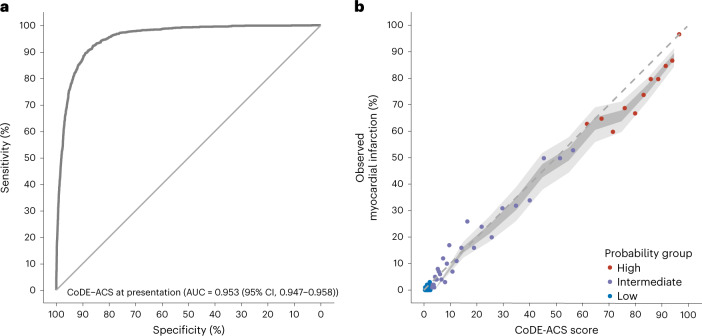
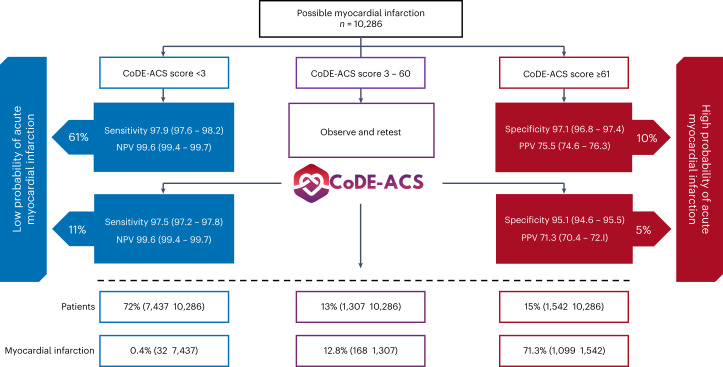
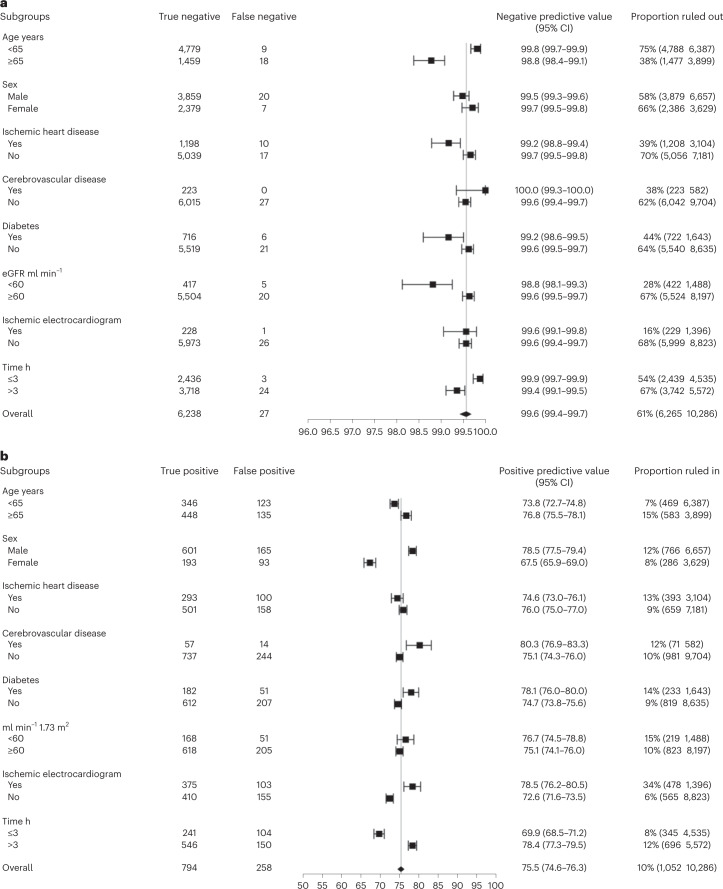
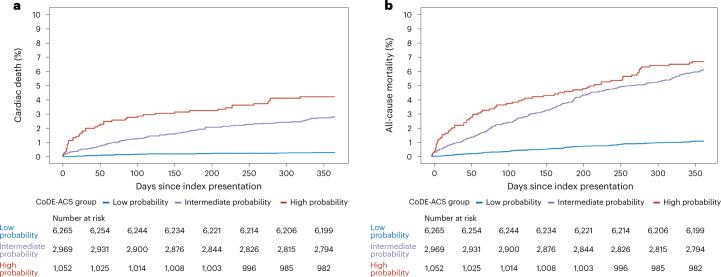
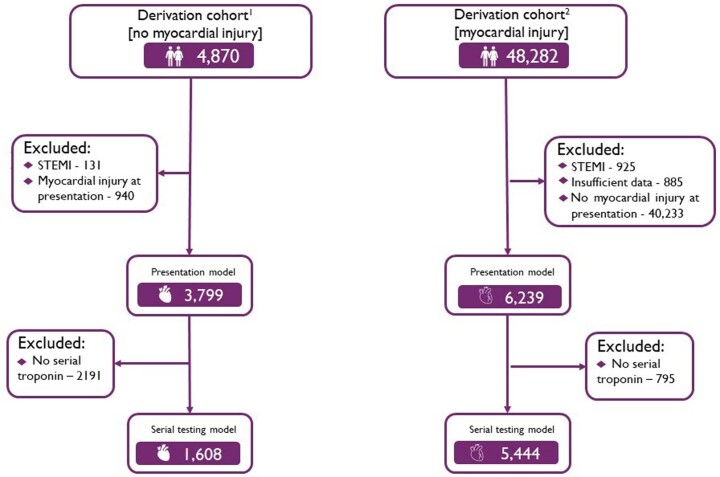
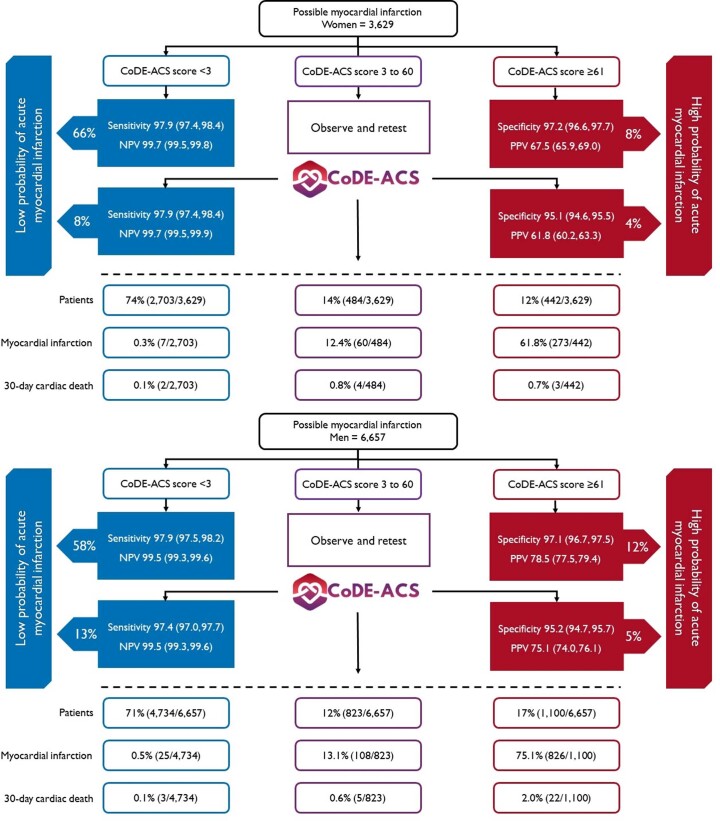
Although guidelines recommend fixed cardiac troponin thresholds for the diagnosis of myocardial infarction, troponin concentrations are influenced by age, sex, comorbidities and time from symptom onset. To improve diagnosis, we developed machine learning models that integrate cardiac troponin concentrations at presentation or on serial testing with clinical features and compute the Collaboration for the Diagnosis and Evaluation of Acute Coronary Syndrome (CoDE-ACS) score (0-100) that corresponds to an individual's probability of myocardial infarction. The models were trained on data from 10,038 patients (48% women), and their performance was externally validated using data from 10,286 patients (35% women) from seven cohorts. CoDE-ACS had excellent discrimination for myocardial infarction (area under curve, 0.953; 95% confidence interval, 0.947-0.958), performed well across subgroups and identified more patients at presentation as low probability of having myocardial infarction than fixed cardiac troponin thresholds (61 versus 27%) with a similar negative predictive value and fewer as high probability of having myocardial infarction (10 versus 16%) with a greater positive predictive value. Patients identified as having a low probability of myocardial infarction had a lower rate of cardiac death than those with intermediate or high probability 30 days (0.1 versus 0.5 and 1.8%) and 1 year (0.3 versus 2.8 and 4.2%; P < 0.001 for both) from patient presentation. CoDE-ACS used as a clinical decision support system has the potential to reduce hospital admissions and have major benefits for patients and health care providers.


Conflict of interest statement

K.K.L. has received honoraria from Abbott Diagnostics. J.B. has received honoraria from Siemens, Roche Diagnostics, Ortho Clinical Diagnostics and Quidel Corporation. P.L.-A. has received speaker’s honoraria or consultancy from Quidel paid to the institution outside the submitted work. L.K. has received honoraria from Roche Diagnostics and Siemens outside the submitted work. F.S.A. has consulted, advised or received honoraria from HyTest Ltd., AWE Medical, Werfen, Siemens Healthineers, Qorvo, Siemens Healthineers and Beckman Coulter. Hennepin Healthcare Research Institute has received research grants from Abbott Diagnostics, Abbott POC, Beckman Dickenson, Beckman Coulter, Ortho Clinical Diagnostics, Roche Diagnostics, Siemens Healthineers and Quidel outside the submitted work. L.C. has received honoraria or consultancy from Abbott Diagnostics, Beckman Coulter and Siemens Healthineers. J.W.P. has undertaken consultancy for Abbott Diagnostics. M.P.T. has received consulting fees or honoraria from Abbott Diagnostics, Roche Diagnostics and Siemens Healthineers; received funding for clinical research from Radiometer; and participated on a Data Safety Monitoring Board/Advisory Board for Abbott Diagnostics, Roche Diagnostics, Siemens Healthineers and Radiometer. C.M. has received research support from Abbott, Beckman Coulter, Brahms, Idorsia, LSI Medience Corporation, Novartis, Ortho Diagnostics, Quidel, Roche, Siemens, Singulex and Sphingotec outside the submitted work as well as speaker honoraria/consulting honoraria from Amgen, Astra Zeneca, Bayer, Boehringer Ingelheim, BMS, Idorsia, Novartis, Osler, Roche and Sanofi all paid to the institution. N.L.M. has received honoraria or consultancy from Abbott Diagnostics, Roche Diagnostics, Siemens Healthineers and LumiraDx. D.D., K.K.L. and N.L.M. are employed by the University of Edinburgh, which has filed a patent on the Collaboration for the Diagnosis and Evaluation of Acute Coronary Syndrome score (patent reference: GB2212464). The remainign authors declare no competing interests. All other authors have reported that they have no relationships relevant to the contents of this paper to disclose.

Figures

Fig. 1
Fig. 1. Positive predictive value of the sex-specific 99th percentile cardiac troponin threshold in the derivation cohort across patient subgroups.
Data are presented as a central estimate with 95% CIs based on the Clopper–Pearson method. eGFR, estimated glomerular filtration rate.
Fig. 2
Fig. 2. Diagnostic performance of the CoDE-ACS score in the external validation cohort using the presentation troponin concentration alone.
a, Receiver-operating characteristic curve illustrating the discrimination of the CoDE-ACS for myocardial infarction. b, Calibration of the CoDE-ACS score with the observed proportion of patients with myocardial infarction. The dashed line represents perfect calibration. Each point represents 100 patients. Patients are grouped as low (<3), intermediate (3–60) or high probability (≥61) of myocardial infarction. The darker shaded area represents the 95% CI, while the lighter shaded area represents the 99% CI. AUC, area under curve.
Fig. 3
Fig. 3. External validation of the performance of the CoDE-ACS pathway in 10,286 patients with possible myocardial infarction.
Diagnostic performance of CoDE-ACS models in 10,286 patients from seven international cohorts. Sensitivity, negative predictive value (NPV), specificity and positive predictive value (PPV) with 95% CIs of the CoDE-ACS scores were used to identify patients as low probability (<3) or high probability (≥61) of myocardial infarction at presentation and after serial troponin testing if required.
Fig. 4
Fig. 4. Diagnostic performance of the CoDE-ACS score in the external validation cohort for identifying patients as having a low or high probability of myocardial infarction across patient subgroups.
Data are presented as a central estimate with 95% CIs based on the Clopper–Pearson method. a, Negative predictive value of the low-probability CoDE-ACS score using the presentation troponin concentration alone across patient subgroups. b, Positive predictive value of the high-probability CoDE-ACS score using the presentation troponin concentration alone across patient subgroups. eGFR, estimated glomerular filtration rate.
Fig. 5
Fig. 5. Cumulative incidence of cardiac death and all-cause mortality as stratified by the CoDE-ACS score at presentation in the external validation cohort.
a,b, Data for cardiac death (a) and all-cause mortality (b).
Extended Data Fig. 1
Extended Data Fig. 1. Flow diagram illustrating the populations used to train CoDE-ACS models in patients with and without myocardial injury.
1Lancet. 2015 Dec 19;386(10012):2481-8. 2Lancet. 2018 Sep 15;392(10151):919–928.
Extended Data Fig. 2
Extended Data Fig. 2. Negative predictive value of the 5 ng/L risk stratification threshold at presentation in the derivation cohort across patient subgroups.
Data are presented as a central estimate with 95% confidence intervals based on the Clopper-Pearson method.
Extended Data Fig. 3
Extended Data Fig. 3. Importance permutation rank of the features in the XGBoost model.
(a) In patients without myocardial injury. (b) In patients with myocardial injury.
Extended Data Fig. 4
Extended Data Fig. 4. Diagnostic performance of CoDE- ACS scores at presentation in the derivation cohort across patient subgroups.
Data are presented as a central estimate with 95% confidence intervals based on the Clopper-Pearson method. (a) CoDE-ACS low probability score of less than 3. (b) CoDE-ACS high probability score of 61 or more.
Extended Data Fig. 5
Extended Data Fig. 5. Diagnostic performance of CoDE- ACS scores on serial troponin testing in the derivation cohort across patient subgroups.
Data are presented as a central estimate with 95% confidence intervals based on the Clopper-Pearson method. (a) CoDE-ACS low probability score of less than 3. (b) CoDE-ACS high probability score of 61 or more.
Extended Data Fig. 6
Extended Data Fig. 6. Diagnostic performance of CoDE- ACS in the external validation cohort using serial troponin results.
(a) Receiver-operating- characteristic (ROC) curve illustrating discrimination of the CoDE-ACS for myocardial infarction. (b) Calibration of the CoDE-ACS score with the observed proportion of patients with myocardial infarction. The dashed line represents perfect calibration. Each point represents 100 patients. Patients are grouped as low- (<3), intermediate- (3 to 60) or high-probability (≥61) of myocardial infarction. The darker shaded area represents the 95% confidence interval, while the lighter shaded area the 99% confidence interval.
Extended Data Fig. 7
Extended Data Fig. 7. Diagnostic performance of CoDE- ACS scores on serial troponin testing in the external validation cohort across patient subgroups.
Data are presented as a central estimate with 95% confidence intervals based on the Clopper-Pearson method. (a) CoDE-ACS low probability score of less than 3. (b) CoDE-ACS high probability score of 61 or more.
Extended Data Fig. 8
External validation of the performance of the CoDE-ACS pathway in 3,629 women (a) and 6,657 men (b) with possible myocardial infarction.
Extended Data Fig. 9
Extended Data Fig. 9. Diagnostic performance of the CoDE-ACS score in the external validation cohorts by region (Europe, Australia, New Zealand and United States).
Receiver-operating-characteristic (ROC) curve illustrating discrimination of the CoDE-ACS for myocardial infarction. (a) Using the presentation cardiac troponin measurement. (b) Using the serial cardiac troponin measurement.
Extended Data Fig. 10
Extended Data Fig. 10. Diagnostic performance in 5,634 patients of the external validation cohort who had cardiac troponin measurements at presentation and 1 hour to enable (A) CoDE-ACS score to identify patients as low-probability of myocardial infarction and (B) the 0/1-hour pathway to rule out myocardial infarction at presentation in subgroups.
Data are presented as a central estimate with 95% confidence intervals based on the Clopper-Pearson method.

Comment in

References

    1. Than M, et al. A 2-h diagnostic protocol to assess patients with chest pain symptoms in the Asia-Pacific region (ASPECT): a prospective observational validation study. Lancet. 2011;377:1077–1084. - PubMed
    1. Body R, et al. Rapid exclusion of acute myocardial infarction in patients with undetectable troponin using a high-sensitivity assay. J. Am. Coll. Cardiol. 2011;58:1332–1339. - PubMed
    1. Reichlin T, et al. One-hour rule-out and rule-in of acute myocardial infarction using high-sensitivity cardiac troponin T. Arch. Intern. Med. 2012;172:1211–1218. - PubMed
    1. Shah AS, et al. High-sensitivity cardiac troponin I at presentation in patients with suspected acute coronary syndrome: a cohort study. Lancet. 2015;386:2481–2488. - PMC - PubMed
    1. Chapman AR, et al. Comparison of the efficacy and safety of early Rule-Out pathways for acute myocardial infarction. Circulation. 2017;135:1586–1596. - PMC - PubMed

Publication types