. 2023 Jun;55(6):1022-1033.
doi: 10.1038/s41588-023-01395-x. Epub 2023 May 11.

Clonal evolution during metastatic spread in high-risk neuroblastoma

Affiliations

Clonal evolution during metastatic spread in high-risk neuroblastoma

Gunes Gundem et al. Nat Genet. 2023 Jun.

Erratum in

  • Author Correction: Clonal evolution during metastatic spread in high-risk neuroblastoma.
    Gundem G, Levine MF, Roberts SS, Cheung IY, Medina-Martínez JS, Feng Y, Arango-Ossa JE, Chadoutaud L, Rita M, Asimomitis G, Zhou J, You D, Bouvier N, Spitzer B, Solit DB, Dela Cruz F, LaQuaglia MP, Kushner BH, Modak S, Shukla N, Iacobuzio-Donahue CA, Kung AL, Cheung NV, Papaemmanuil E. Gundem G, et al. Nat Genet. 2025 Sep;57(9):2338. doi: 10.1038/s41588-025-02320-0. Nat Genet. 2025. PMID: 40764844 No abstract available.

Abstract

Patients with high-risk neuroblastoma generally present with widely metastatic disease and often relapse despite intensive therapy. As most studies to date focused on diagnosis-relapse pairs, our understanding of the genetic and clonal dynamics of metastatic spread and disease progression remain limited. Here, using genomic profiling of 470 sequential and spatially separated samples from 283 patients, we characterize subtype-specific genetic evolutionary trajectories from diagnosis through progression and end-stage metastatic disease. Clonal tracing timed disease initiation to embryogenesis. Continuous acquisition of structural variants at disease-defining loci (MYCN, TERT, MDM2-CDK4) followed by convergent evolution of mutations targeting shared pathways emerged as the predominant feature of progression. At diagnosis metastatic clones were already established at distant sites where they could stay dormant, only to cause relapses years later and spread via metastasis-to-metastasis and polyclonal seeding after therapy.


Conflict of interest statement

Competing Interests Statement

G.G. is a consultant in Isabl Inc. E.P., A.L.K. and J.S.M-M are founders, equity holders and hold fiduciary roles in Isabl Inc. N-K.V.C reports receiving commercial research grants unrelated to this study, from Y-mabs Therapeutics and Abpro-Labs Inc.; holding ownership interest/equity in Y-Mabs Therapeutics Inc., holding ownership interest/equity in Abpro-Labs, and owning stock options in Eureka Therapeutics. N-K.V.C. is the inventor and owner of issued patents, some licensed by MSK to Ymabs Therapeutics, Biotec Pharmacon, and Abpro-labs. N-K.V.C. is an advisory board member for Abpro-Labs and Eureka Therapeutics. MSK also has financial interest in Y-mabs. The remaining authors declare no competing interests.

Figures
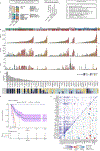
Extended Data Figure 1
Extended Data Figure 1. Tumor cohort, summary of mutation calling and genomic landscape.
(a) (left) Barplots give a breakdown of the tumors sequenced by WGS (n = 247) and MSK-IMPACT panel (n = 223) according to sample types and disease subtypes. (Middle) Barplot gives a breakdown of 94 patients with > =2 tumors according to the availability of WGS and/or MSK-IMPACT data. (Right) Panel lists the number of patients included in the evolutionary analyses. For n = 247 WGS tumors, barplots show (b) the number of SNVs, indels and SVs and (c) the prevalence of segmental CNAs and genes affected by mutations and SVs. Only genes affected in > =2 patients are shown. Bottom barplot gives a summary of the mutation types for each CNA/gene. CNA, copy-number aberration. Complex, small complex insertion/deletion. Del, small deletion. Ins, small insertion. SNV, single-nucleotide variant. SV, structural variant. (d) Survival plot shows the clinical outcome of MYCN-A patients (n = 68) with TERTp substitutions, TERT-SV or no TERT events with 95% confidence intervals shown as the shaded area. P-value from a multivariate analysis taking into account age at diagnosis is shown (coxph function in R). (e) Heatmap gives a summary of co-mutation patterns in the current cohort (n = 470 tumors) with the frequency of events in the upper triangle and odds ratios in the lower triangle, respectively. Only odds ratios with p-values <0.05 are colored in shades of blue for co-mutation or red for mutually exclusive interactions. Significant interactions after multiple testing correction are indicated with a star or a dot according to the significance level of different correction metrics: FDR, false discovery rate. FWER, family-wise error rate. The data and script for the figure are available in Supplementary Tables 1 and 2 and at the GitHub repository.
Extended Data Figure 2
Extended Data Figure 2. Summary of mutational signature analyses in WGS data.
(a) 96 mutational contexts for the single-nucleotide variant (SNV) signatures identified de novo are shown as the barplots on the left while the reference signatures from COSMIC.v3 are shown in the barplot in the middle. Right barplot shows the prevalence of different types of indels amongst the indel signatures identified de novo. (b) Heatmap shows the proportions of substitutions at 96 mutational contexts for each WGS tumor (n = 247) shown in rows together with sample type, disease subtype, platinum, temozolomide and radiotherapy status on the left and number of SNVs and indels and exposure to identified signatures in substitution and indel data on the right. The data and script for the figure are available in Supplementary Table 1 and at the GitHub repository.
Extended Data Figure 3
Extended Data Figure 3. Biological and clinical correlates of mutational patterns.
(a) Scatter plots show the association between exposure to SBS18 (left) or SBS40 (right) and age at diagnosis amongst the diagnostic/t-resection tumors (n = 132) (Pearson correlation). (b) Box plot shows the mean expression of the genes in glutaminolysis signature associated with ROS accumulation across diagnostic tumors (n = 59) of different disease subtypes (left) and MYCN-A tumors (n = 56) from diagnosis, t-resection and relapse and further relapses (right). Median, upper and lower quartiles as well as comparisons with significant p-values from a two-sided Wilcoxon test are shown according to the significance levels in the legend. (c) For n = 151 tumors, scatterplots (left) shows correlation between number of SNVs and the number of predicted neoantigens, and (right) shows the relationship between the number of predicted neoantigens and immune infiltrates in the surrounding tumor microenvironment as assessed from RNAseq (Pearson correlation). (d) Barplots show the proportion of genome-wide SNVs for n = 45 tumors (left) and oncogenic driver SNVs for n = 54 tumors (right) attributed to different mutational signatures broken down by presence in post-therapy relapse tumors. For all scatterplots Pearson correlation and associated p-value with a blue linear regression line and 95% confidence interval in grey is shown. The data and script for the figure are available in Supplementary Table 1 and at the GitHub repository.
Extended Data Figure 4
Extended Data Figure 4. Subclone trees for MYCN-A, ATRX and MDM2-CDK4 patients.
Each tree shows the subclonal structure in an individual patient. Patients are organized according to disease subtype and the availability of tumors from primary site (diagnosis/reresection/t-resection) and relapses. Branches are annotated with recurrent CNAs and oncogenic mutations/SVs and colored according to the latest tumor they were identified in 1) blue for subclones specific to a diagnostic tumor 2) light blue for subclones seen in reresections 3) green for subclones seen in a t-resection tumor 4) orange for subclones seen in a relapse tumor and 5) red for subclones seen in a further relapse tumor. Subclonal events at MYCN, TERT and ATRX loci are shown in red font. Events with which clonal status cannot be determined are indicated with a question mark. Different evolutionary patterns are indicated with an icon next to the patient id. Tumor sites and the type of sequencing are indicated below the trees. G, whole-genome sequencing. T, targeted sequencing. B, both. For H103207, H118706 and H134819 a simplified version of the tree is shown due to space. Detailed analysis of subclonal structure for 94 patients is provided in Supplementary Data Files 1–69. The data for the figures are available in Supplementary Table 5 and the scripts are available through the ISABL platform.
Extended Data Figure 5
Extended Data Figure 5. Subclone trees for TERT-SV, SEG-CNA and NUM-CNA patients.
Each tree shows the subclonal structure in an individual patient. Patients are organized according to disease subtype and the availability of tumors from primary site (diagnosis/reresection/t-resection) and relapses. Branches are annotated with recurrent CNAs and oncogenic mutations/SVs and colored according to the latest tumor they were identified in 1) blue for subclones specific to a diagnostic tumor 2) light blue for subclones seen in reresections 3) green for subclones seen in a t-resection tumor 4) orange for subclones seen in a relapse tumor and 5) red for subclones seen in a further relapse tumor. Subclonal events at MYCN, TERT and ATRX loci are shown in red font. Events with which clonal status cannot be determined are indicated with a question mark. Different evolutionary patterns are indicated with an icon next to the patient id. Tumor sites and the type of sequencing are indicated below the trees. G, whole-genome sequencing. T, targeted sequencing. B, both. For H103207, H118706 and H134819 a simplified version of the tree is shown due to space. Detailed analysis of subclonal structure for 94 patients is provided in Supplementary Data Files 1–69. The data for the figures are available in Supplementary Table 5 and the scripts are available through the ISABL platform.
Extended Data Figure 6
Extended Data Figure 6. CN state and SVs at MYCN locus.
For each patient, integrated CN/SV plots showing the details of MYCN locus, boxplots showing the aberrant read support for SV clusters across all tumors, barplots showing the number SVs in each SV cluster and body maps with the tumors are shown. The data for this figure are available as raw data at the dbGAP and scripts are available through the ISABL platform.
Extended Data Figure 7
Extended Data Figure 7. CN state and SVs at MYCN locus.
For each patient, integrated CN/SV plots showing the details of MYCN locus, boxplots showing the aberrant read support for SV clusters across all tumors, barplots showing the number SVs in each SV cluster and body maps with the tumors are shown. The data for this figure are available as raw data at the dbGAP and scripts are available through the ISABL platform.
Extended Data Figure 8
Extended Data Figure 8. CN state and SVs at MYCN locus.
For each patient, integrated CN/SV plots showing the details of MYCN locus, boxplots showing the aberrant read support for SV clusters across all tumors, barplots showing the number SVs in each SV cluster and body maps with the tumors are shown. The data for this figure are available as raw data at the dbGAP and scripts are available through the ISABL platform.
Extended Data Figure 9
Extended Data Figure 9. Timing of metastasis.
Signatures trees as described in Figure 6 are shown for 13 patients with one or more tumors from the primary site and two or more tumors from locoregional and/or distant metastasis. Patients in the top row have at least one tumor from distant metastatic site while patients in the bottom row have locoregional relapses only. The subclones involved in disease spread from the primary are indicated with a black arrow while the daughter clones are shown with red arrows. The data for the figure are available in Supplementary Table 4 and the scripts are available through the ISABL platform.
Extended Data Figure 10
Extended Data Figure 10. Complex seeding patterns in H132374.
Subclonal structure for patient H132374 is shown with treatment timeline and signature tree as described in Figs. 4a and 6, respectively. Body maps depict two different scenarios that explain the subclonal structure in H132374: The left body map shows possible polyclonal seeding in the CNS by a mixture of subclones 3 and 4. In this scenario lung metastasis is caused by subclone-4 after platinum chemotherapy. Shown on the right body map is the second scenario of met-to-met seeding from CNS to lung by subclone-4 after therapy. Detailed description of the patient is provided in Supplementary Information and Supplementary Data File 19. The data for the figure are available in Supplementary Table 4 and as raw data at dbGAP and scripts are available through ISABL platform.
Figure 1.
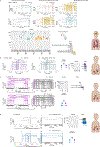
Figure 1.. Patient cohort and genome-wide mutational landscape.
(a) Tileplot shows the number of tumors (n=281) analyzed from 94 patients with >=2 samples color-coded by type of sample and sequencing performed. Patients are organized by the disease subtype: 1) MYCN, patients with MYCN amplification. 2) TERT, patients with TERT SVs. 3) ATRX, patients with ATRX events. 4) MDM2-CDK4, patients with MDM2-CDK4 co-amplifications. 5) SEG-CNA and 6) NUM-CNA, patients with segmental or numeric CNAs but without the aforementioned alterations. (SV, structural variants. CNA, copy number aberration. WGS, whole genome sequencing.). Information about age and INSS (The International Neuroblastoma Staging System) stage at diagnosis is provided as tile plots at the bottom. Box plots show comparison of the proportion of SNVs (single nucleotide substitutions) attributed to SBS18 and SBS40 (b) and tumor mutation burden (TMB) (c) across diagnostic tumors of different disease subtypes (n=72 tumors). (d) Box plots shows (left) the increase in TMB across samples collected at different time points: diagnosis, therapy resection (t-resection), relapse and further relapse (f. relapse) (n=129 patients) and (right) the fold change in TMB in relapse and further relapse samples compared to the matched diagnostic tumor of the same patient (n=22 patients). (e) Box plots show the proportion of SNVs attributed to SBS31, SBS35 and temozolomide (TMZ) signatures across samples collected at different time points (n=129 patients). (f) Boxplots show the number of SNVs attributed to therapy-related mutational signatures for tumors from patients with stage-4 disease who were exposed to increasing numbers of rounds of platinum or temozolomide-based chemotherapy (n=145 tumors). For all boxplots, median, upper and lower quartile as well as significance levels of p-values from two-sided Wilcoxon test are shown (for significant comparisons only). The data and script for the figure are available in Supplementary Table 1 and the GitHub repository.
Figure 2.
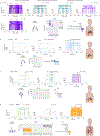
Figure 2.. Timing of emergence of the first malignant clone.
For n=39 patients of different disease subtypes (a) scatter plot shows the relationship between the number of single nucleotide variants (SNVs) on the trunk (trunk length) and age at diagnosis (Pearson correlation) with a blue linear regression line and 95% confidence intervals shown in grey while (b) barplots show the breakdown of upper, middle and lower tertiles of the trunk length distribution by stage at diagnosis (high stage, patients with stage-4 and low stage, all other patients). (c) Timeline plot shows the time of diagnosis and the predicted time of emergence of the most recent common ancestor (MRCA) with 95% confidence intervals (CI) for n=39 patients. Number of SBS40-associated SNVs on the trunk is shown next to the patient id. Shaded area from −9 to 0 on the x-axis shows the period in utero. The predicted time of emergence of the MRCA is shown with a filled circle (pre-natal), a filled triangle (post-natal) or empty circle (CI overlap both pre-natal and post-natal). Detailed explanation of the subclonal structures of the patients is available in Supplementary Info and Supplementary Data. The data and script for the figure are available in Supplementary Tables 1 and 4 and the GitHub repository.
Figure 3.
Figure 3.. Subtype-specific evolutionary trajectories.
For n=92 patients with >=2 tumors (a) ternary plot shows the proportion of putative oncogenic events that are shared by all tumors of a patient (top corner), seen in a subclone specific to a sample from the primary site (left corner) or metastatic/relapse site (right corner). Dots are color-coded red or green to indicate a tendency to be shared or metastasis/relapse-specific with a size proportional to the total number of events. (b) Heatmap shows the number of truncal and subclonal genetic changes identified in 94 patients with >=2 tumors with colors indicated in the legend. Mutations and SVs are collapsed to the affected pathways except for those hitting the most recurrent disease-defining genes (MYCN, TERT and ATRX). Black dots indicate >=2 events happening in different subclone as parallel evolution while crosses indicate the loci affected by continuous subclonal SVs when there is already an SV event on the trunk of the patient. Lowermost tile plot shows the availability of multi-WGS data, number of tumors and the timepoints studied for each patient. Barplot on the left shows the frequency of the events per row. CNA, copy number aberration. SV, structural variant. +, gain. −, loss. Clone trees for all 94 patients are available in Extended Data Figures 4–5. Detailed explanation of the subclonal structures of the patients is available in Supplementary Info and Supplementary Data. The data and script for the figure are available in Supplementary Tables 2 and 5 and the GitHub repository.
Figure 4.
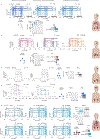
Figure 4.. Evolutionary trajectories in MYCN-A and MDM2-CDK4 subtypes.
(a) Subclonal structure for patient H103207 is summarized across multiple panels. Treatment timeline gives a summary of the therapies administered, the sequenced tumors color-coded by sample type and the survival status at last follow-up. Body map shows the location of the tumor sites sequenced. WGS-based subclone tree shows the lineage relationships amongst the subclones identified in a patient. Subclones are designated by branches with non-informative lengths with trunk shown in gray at the top of the tree. Terminal nodes are annotated with tumors where the corresponding clone is present. Branches are annotated with putative oncogenic events. Different types of MYCN amplicons are indicated by a number after gene name (i.e. MYCN.1). Continuous accumulation of SVs at MYCN loci is indicated by stars (*). On the right, MYCN locus for each tumor is shown with an integrated copy number (CN)/structural variant (SV) plot with absolute copy number (ACN) on the y-axis and SVs drawn as arcs color-coded by the subclones they were assigned to. ALKECD-, ALK with a deletion of exons encoding the extra-cellular domain. (b) Treatment timeline, subclone tree and body map as described in Figure 4a are shown for patient H132384. Evolution at MDM2, CDK4 and TERT loci are shown in the integrated CN/SV plot as described in Figure 4a. Barplot shows the increase in expression in the tumors with TERT SVs. Detailed explanation of the subclonal structures of H103207 and H132384 are available in Supplementary Info and Supplementary Data. The data for the figure are available in Supplementary Table 4 and as raw data at dbGAP and scripts are available through ISABL platform.
Figure 5.
Figure 5.. Subclonal structure in patients with ATRX events and TP53 mutations.
(a) Treatment timeline and body maps as described in Figure 4a are shown for two different ATRX-mutant patients. WGS-based subclone tree for H134817 and MSK-IMPACT-based subclone tree for H135089 are shown with non-informative branch lengths, annotated with putative oncogenic events and tumors as described in Figure 4a. LN, lymph node. (b) Treatment timeline, and body maps as described in Figure 4a are shown for two patients with TP53 mutations. WGS-based subclone tree for H116987 and MSK-IMPACT-based subclone tree for H134722 are shown as described in Figure 4a. Detailed description of the subclonal structure of each patient is provided in Supplementary Information and Supplementary Data. The data for the figure are available in Supplementary Tables 5 and as raw data at dbGAP and scripts are available through ISABL platform.
Figure 6.
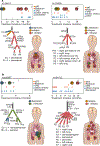
Figure 6.. Timing of metastasis with respect to therapy.
(a) Subclonal structure for patient H118706 is shown. Treatment timeline is as described in Figure 4a. On the right is the signature tree with the results from the subclone-specific mutational signature analysis across the WGS-based subclone tree of the patient. Each subclone is shown as a stacked bar plot showing the proportion of the SNVs attributed to the six different mutational signatures and with total length proportional to the number of SNVs in the corresponding subclone. Branches are separated by a dashed line and annotated with the putative oncogenic changes assigned to the corresponding subclone. Terminal nodes are annotated with tumors where the corresponding clone is present. Triangles denote the subclones involved in metastatic spread where gray and white indicate spread before and after therapy, respectively. The id of the metastatic subclones is annotated next to the corresponding branch. Body maps show the possible movement of subclones involved in spread before and after therapy indicated by the subclone ids next to the body maps. Subclones are color-coded according to the WGS-based clonal phylogeny shown in the ‘phylogeny’ legend. Detailed description of the subclonal structure of the patient is provided in Supplementary Information and Supplementary Data. The data for the figure are available in Supplementary Tables 4 and 5 and as raw data at dbGAP and scripts are available through ISABL platform.
Figure 7.
Figure 7.. Clonal transitions during disease progression across multiple time points.
(a) Barplots shows the proportion of different types of clonal transitions from diagnosis (Dx) to first relapse (n=47) and between consecutive relapses (n=67) (left) and broken down across different disease subtypes (right). Clonal transition types are 1) ‘same’, relapse is caused by the same clone as the previous time point with no new genetic changes acquired. 2) ‘earlier’, relapse is caused by an earlier clone in the phylogenetic tree. 3) ‘linear’, relapse is caused by a clone with new CNAs and oncogenic mutations/SVs while no such events are seen in the clone specific to the previous time point. 4) ‘branched, clones from both time points have genetic changes. (b) Barplot shows the number of different types of clonal transitions where the relapsing clone has genetic changes affecting the listed CNAs and oncogenic mutations collapsed to pathways affected except for those mutations affecting the most frequent disease-defining genes (MYCN, TERT and ATRX). The inner plot shows the pathways affected by parallel events across clonal transitions that switch between lineages. (c) and (d) Subclonal structure for patients H134819 and H134821 are shown. Body maps/treatment timelines and signature tree are as described in Figures 4a and 6, respectively. For H134821 the left body map shows the local-regional spread before therapy while the right body map shows the spread 9 years after diagnosis with subclones color-coded according to the WGS-based phylogeny shown in the ‘phylogeny legend. Detailed description of the subclonal structure of H134819 and H134821 is provided in Supplementary Information and Supplementary Data. The data for panels c and d are available in Supplementary Tables 4 and 5 and as raw data at dbGAP and scripts are available through ISABL platform while data and scripts for panels a-b are available in Supplementary Table 6 and the GitHub repository.
Figure 8.
Figure 8.. Complex seeding patterns after therapy.
Subclonal structures for patients H103207 (a) and H134722 (b) are shown with treatment timeline and signature tree as described in Figures 4a and 6, respectively. (a) Body map on the left shows the seeding events before diagnosis. Body map on the right depicts the polyclonal seeding after therapy amongst liver and bilateral lungs involving subclones 5 and 8. (b) The left body map shows the spread before therapy. The black arc indicates the distinct subclone in R1 left lung metastasis sequenced with MSK-IMPACT. The right body map shows subclones 2, 3, 4, 7 and 10 involved in polyclonal seeding across locoregional and metastatic sites in H134722. TP53 substitution assigned to subclone-7 is also found in PDX modeling of R3, R4, R8, R9, R10 and R11. Met, metastasis. For both patients, subclones in the body maps are color-coded according to the WGS-based phylogeny shown in the ‘phylogeny legend. Detailed description of the subclonal structure of H103207 and H134722 is provided in Supplementary Information and Supplementary Data. The data for the figure are available in Supplementary Tables 4 and 5 and as raw data at dbGAP and scripts are available through ISABL platform.

References

    1. Maris JM Recent Advances in Neuroblastoma. New England Journal of Medicine vol. 362 2202–2211 Preprint at 10.1056/nejmra0804577 (2010). - DOI - PMC - PubMed
    1. London WB et al. Historical time to disease progression and progression‐free survival in patients with recurrent/refractory neuroblastoma treated in the modern era on Children’s Oncology Group early‐phase trials. Cancer vol. 123 4914–4923 Preprint at 10.1002/cncr.30934 (2017). - DOI - PMC - PubMed
    1. Abbasi MR et al. Impact of Disseminated Neuroblastoma Cells on the Identification of the Relapse-Seeding Clone. Clin. Cancer Res 23, 4224–4232 (2017). - PMC - PubMed
    1. Eleveld TF et al. Relapsed neuroblastomas show frequent RAS-MAPK pathway mutations. Nat. Genet 47, 864–871 (2015). - PMC - PubMed
    1. Schramm A et al. Mutational dynamics between primary and relapse neuroblastomas. Nat. Genet 47, 872–877 (2015). - PubMed

Methods-only references

    1. Diolaiti D et al. A recurrent novel MGA–NUTM1 fusion identifies a new subtype of high-grade spindle cell sarcoma. Molecular Case Studies vol. 4 a003194 Preprint at 10.1101/mcs.a003194 (2018). - DOI - PMC - PubMed
    1. Zehir A et al. Mutational landscape of metastatic cancer revealed from prospective clinical sequencing of 10,000 patients. Nat. Med 23, 703–713 (2017). - PMC - PubMed
    1. Chakravarty D et al. OncoKB: Annotation of the oncogenic effect and treatment implications of somatic mutations in cancer. Journal of Clinical Oncology vol. 34 11583–11583 Preprint at 10.1200/jco.2016.34.15_suppl.11583 (2016). - DOI
    1. Medina-Martínez JS et al. Isabl Platform, a digital biobank for processing multimodal patient data. BMC Bioinformatics vol. 21 Preprint at 10.1186/s12859-020-03879-7 (2020). - DOI - PMC - PubMed
    1. Landrum MJ et al. ClinVar: public archive of interpretations of clinically relevant variants. Nucleic Acids Res 44, D862–8 (2016). - PMC - PubMed

Publication types