. 2023 May 11;13(1):7697.
doi: 10.1038/s41598-023-34825-1.

Comparison of the effects of oxidative and inflammatory stresses on rat chondrocyte senescence

Affiliations

Comparison of the effects of oxidative and inflammatory stresses on rat chondrocyte senescence

Misaki Yagi et al. Sci Rep. .

Abstract

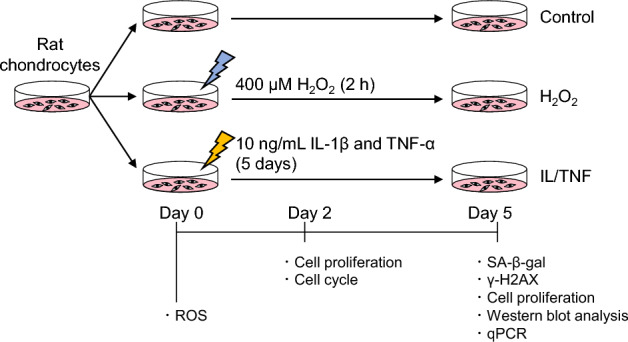
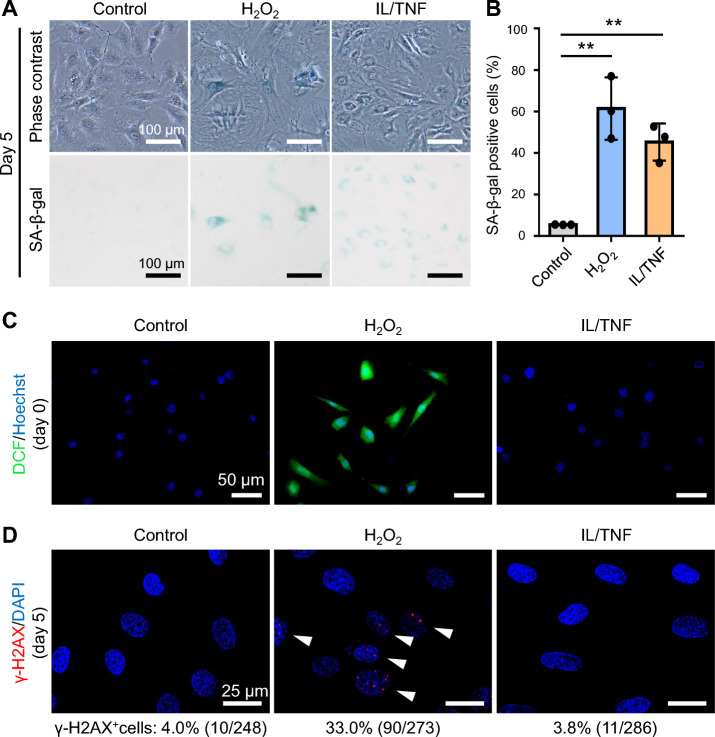
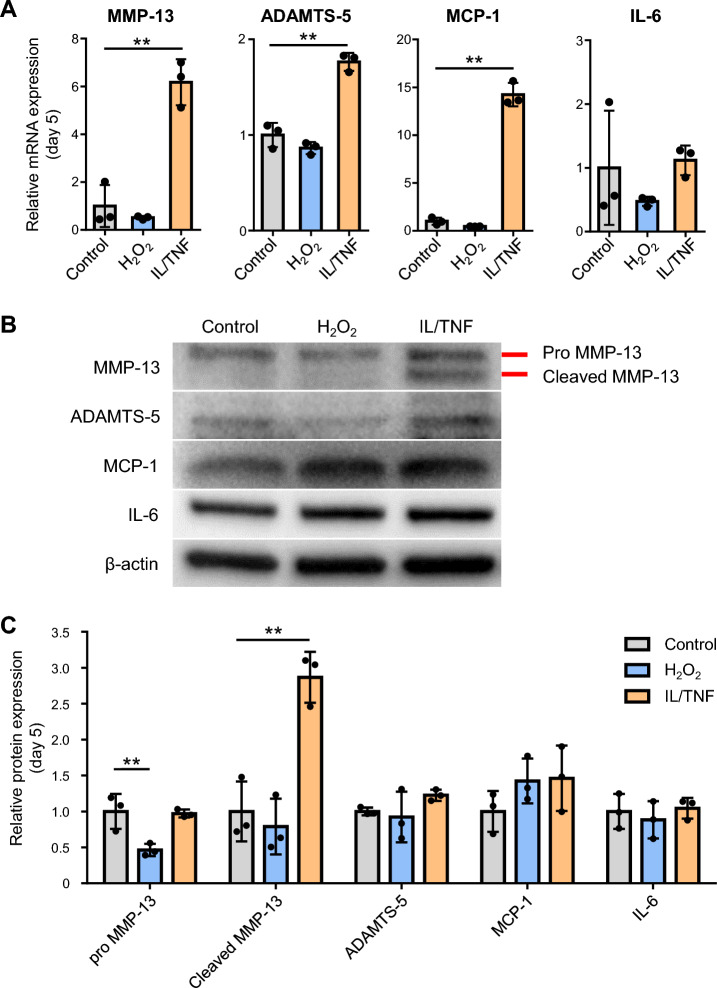
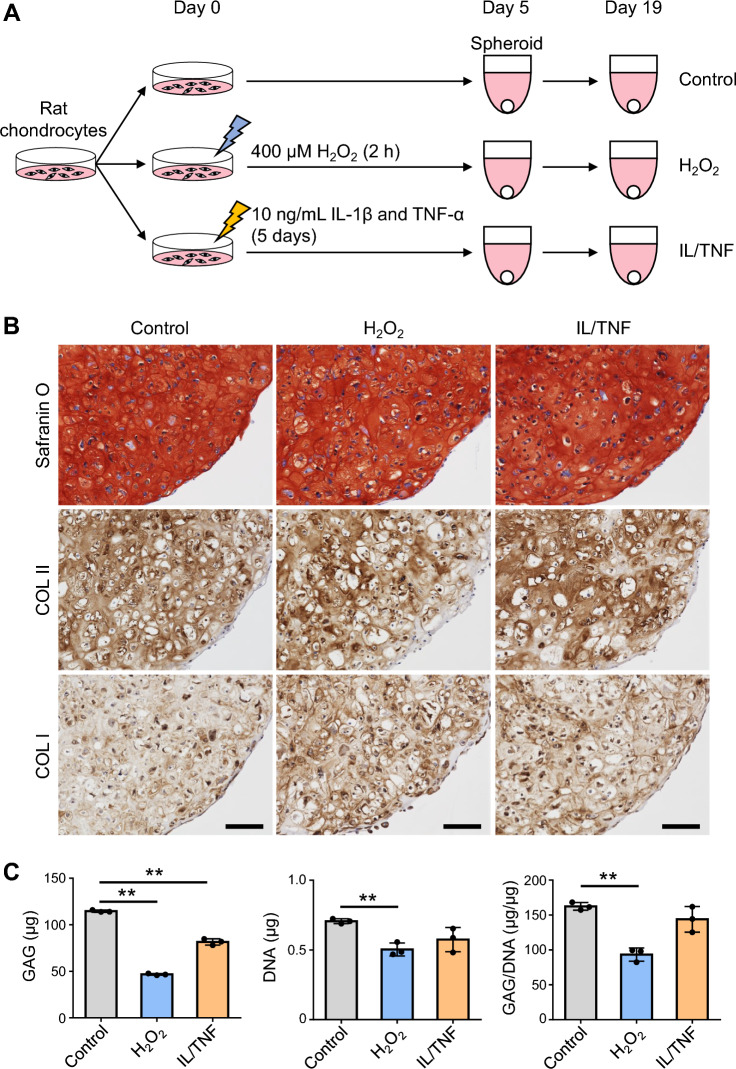
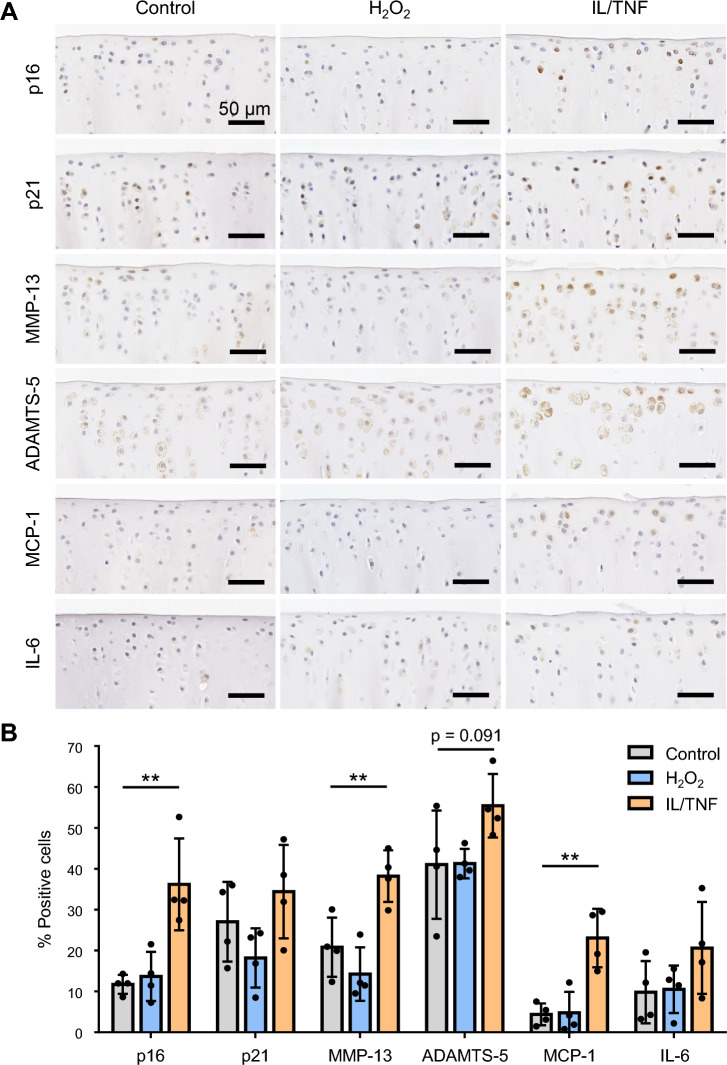
Osteoarthritis (OA) is an age-related degenerative joint disease that causes progressive cartilage loss. Chondrocyte senescence is a fundamental mechanism that contributes to the imbalance of matrix homeostasis in OA by inducing senescence-associated secretory phenotype (SASP). Although OA chondrocytes are mainly exposed to oxidative and inflammatory stresses, the role of these individual stresses in chondrocyte senescence remains unclear. In this study, we compared the effects of these stresses on the senescence of rat chondrocytes. Rat chondrocytes were treated with H2O2 and a combination of IL-1β and TNF-α (IL/TNF) to compare their in vitro effect on senescent phenotypes. For in vivo evaluation, H2O2 and IL/TNF were injected into rat knee joints for 4 weeks. The in vitro results showed that H2O2 treatment increased reactive oxygen species, γ-H2AX, and p21 levels, stopped cell proliferation, and decreased glycosaminoglycan (GAG)-producing ability. In contrast, IL/TNF increased the expression of p16 and SASP factors, resulting in increased GAG degradation. Intraarticular injections of H2O2 did not cause any changes in senescent markers; however, IL/TNF injections reduced safranin O staining and increased the proportion of p16- and SASP factor-positive chondrocytes. Our results indicate that oxidative and inflammatory stresses have significantly different effects on the senescence of rat chondrocytes.


Conflict of interest statement

The authors declare no competing interests.

Figures

Figure 1
Figure 1
Experimental schema and timetable of the in vitro study. To induce oxidative stress, rat chondrocytes were treated 400 μM H2O2 for 2 h and then cultured in the growth medium without H2O2 (H2O2 group). To induce inflammatory stress, the cells were cultured in the growth medium supplemented with 10 ng/mL IL-1β and 10 ng/mL TNF-α (IL/TNF group). We performed reactive oxygen species (ROS) assay on day 0, cell proliferation and cell cycle assay on day 2, and senescence-associated β galactosidase (SA-β-gal) staining, γ-H2AX immunostaining, cell proliferation assay, western blot, and quantitative real-time PCR (qPCR) on day 5.
Figure 2
Figure 2
The level of senescence-associated β galactosidase (SA-β-gal), reactive oxygen species (ROS), and γ-H2AX. (A) Phase contrast and SA-β-gal (brightfield) images. (B) The proportion of SA-β-gal positive cells. Data are presented as mean ± SD of 3 independent experiments. **p < 0.01. (C) Detection of ROS by 2′,7′-dichlorodihydrofluorescein (DCF) fluorescence (green) with nuclei stained with Hoechst (blue). (D) γ-H2AX immunostaining (red). Nuclei were stained using DAPI (blue). White arrowheads indicate γ-H2AX positive cells.
Figure 3
Figure 3
Cell proliferation and cell cycle. (A) Phase contrast images of cells on days 2 and 5. (B) The number of cells on days 0, 2, and 5. Data are presented as the mean ± SD of triplicate wells. **p < 0.01. (C) Cell cycle analysis using propidium iodide (PI). (D) Representative images of western blot for p16, p21, pRb, and β-actin. (E) Quantification of p16, p21, and pRb expression. β-actin was used as a loading control. Data are presented as mean ± SD of 3 independent experiments. *p < 0.05, **p < 0.01.
Figure 4
Figure 4
Expression of senescence-associated secretory phenotype (SASP) factors on day 5. (A) Quantification of mRNA expression of MMP-13, ADAMTS-5, MCP-1, and IL-6. Data are presented as the mean ± SD of triplicate dishes. **p < 0.01. (B) Representative images of western blot for MMP-13, ADAMTS-5, MCP-1, IL-6, and β-actin. (C) Quantification of MMP-13, ADAMTS-5, MCP-1, and IL-6 expression. β-actin was used as a loading control. Data are presented as mean ± SD of 3 independent experiments. **p < 0.01.
Figure 5
Figure 5
Production of the cartilage extracellular matrix. (A) Experimental schema. Rat chondrocytes were treated with H2O2 and IL-1β/TNF-α (IL/TNF); then, they were subjected to spheroid culture in a chondrogenic medium for 14 days. (B) Representative images of safranin O staining and immunostaining for type I and II collagen (COL I and II). (C) Quantification of glycosaminoglycan (GAG) and DNA. The GAG content was standardized to DNA content (GAG/DNA). Data are presented as the mean ± SD of triplicate spheroids. **p < 0.01.
Figure 6
Figure 6
Degradation of the cartilage extracellular matrix. (A) Experimental schema. Chondrogenic spheroids were prepared from normal rat chondrocytes and then treated with H2O2 and IL-1β/TNF-α (IL/TNF). (B) Representative images of safranin O staining and immunostaining for type I and II collagen (COL I and II). (C) Quantification of glycosaminoglycan (GAG) and DNA. The GAG content was standardized to DNA content (GAG/DNA). Data are presented as the mean ± SD of triplicate spheroids. *p < 0.05, **p < 0.01.
Figure 7
Figure 7
In vivo experimental schema and safranin O staining. (A) Experimental schema of the in vivo study. PBS, H2O2, and IL-1β/TNF-α (IL/TNF) were injected into the rats’ knee joints twice a week. Knee joint tissues were analyzed four weeks after the initial injection. (B) Representative images of safranin O staining of the knee joints (upper panels). The black dashed boxes represent enlarged images of tibial cartilage (lower panels). (C) OARSI score for tibial cartilage. Data are presented as the mean ± SD of 4 knees. **p < 0.01.
Figure 8
Figure 8
Immunostaining for senescence markers. (A) Representative images of p16, p21 MMP-13, ADAMTS-5, MCP-1, and IL-6 immunostaining. (B) Percentage of chondrocytes positive for p16, p21, MMP-13, ADAMTS-5, MCP-1, and IL-6. Data are presented as the mean ± SD of 4 knees. **p < 0.01.

References

    1. Bijlsma JWJ, Berenbaum F, Lafeber FPJG. Osteoarthritis: An update with relevance for clinical practice. Lancet. 2011;377:2115–2126. doi: 10.1016/S0140-6736(11)60243-2. - DOI - PubMed
    1. Kapoor M, Martel-Pelletier J, Lajeunesse D, Pelletier JP, Fahmi H. Role of proinflammatory cytokines in the pathophysiology of osteoarthritis. Nat. Rev. Rheumatol. 2011;7:33–42. doi: 10.1038/nrrheum.2010.196. - DOI - PubMed
    1. Loeser RF. Aging and osteoarthritis. Curr. Opin. Rheumatol. 2011;23:492–496. doi: 10.1097/BOR.0b013e3283494005. - DOI - PMC - PubMed
    1. McCulloch K, Litherland GJ, Rai TS. Cellular senescence in osteoarthritis pathology. Aging Cell. 2017;16:210–218. doi: 10.1111/acel.12562. - DOI - PMC - PubMed
    1. Ashraf S, et al. Regulation of senescence associated signaling mechanisms in chondrocytes for cartilage tissue regeneration. Osteoarthr. Cartil. 2016;24:196–205. doi: 10.1016/j.joca.2015.07.008. - DOI - PubMed

Publication types

Substances