. 2023 Jun;8(6):1039-1050.
doi: 10.1038/s41564-023-01388-w. Epub 2023 May 11.

Widespread extinctions of co-diversified primate gut bacterial symbionts from humans

Affiliations

Widespread extinctions of co-diversified primate gut bacterial symbionts from humans

Jon G Sanders et al. Nat Microbiol. 2023 Jun.

Abstract

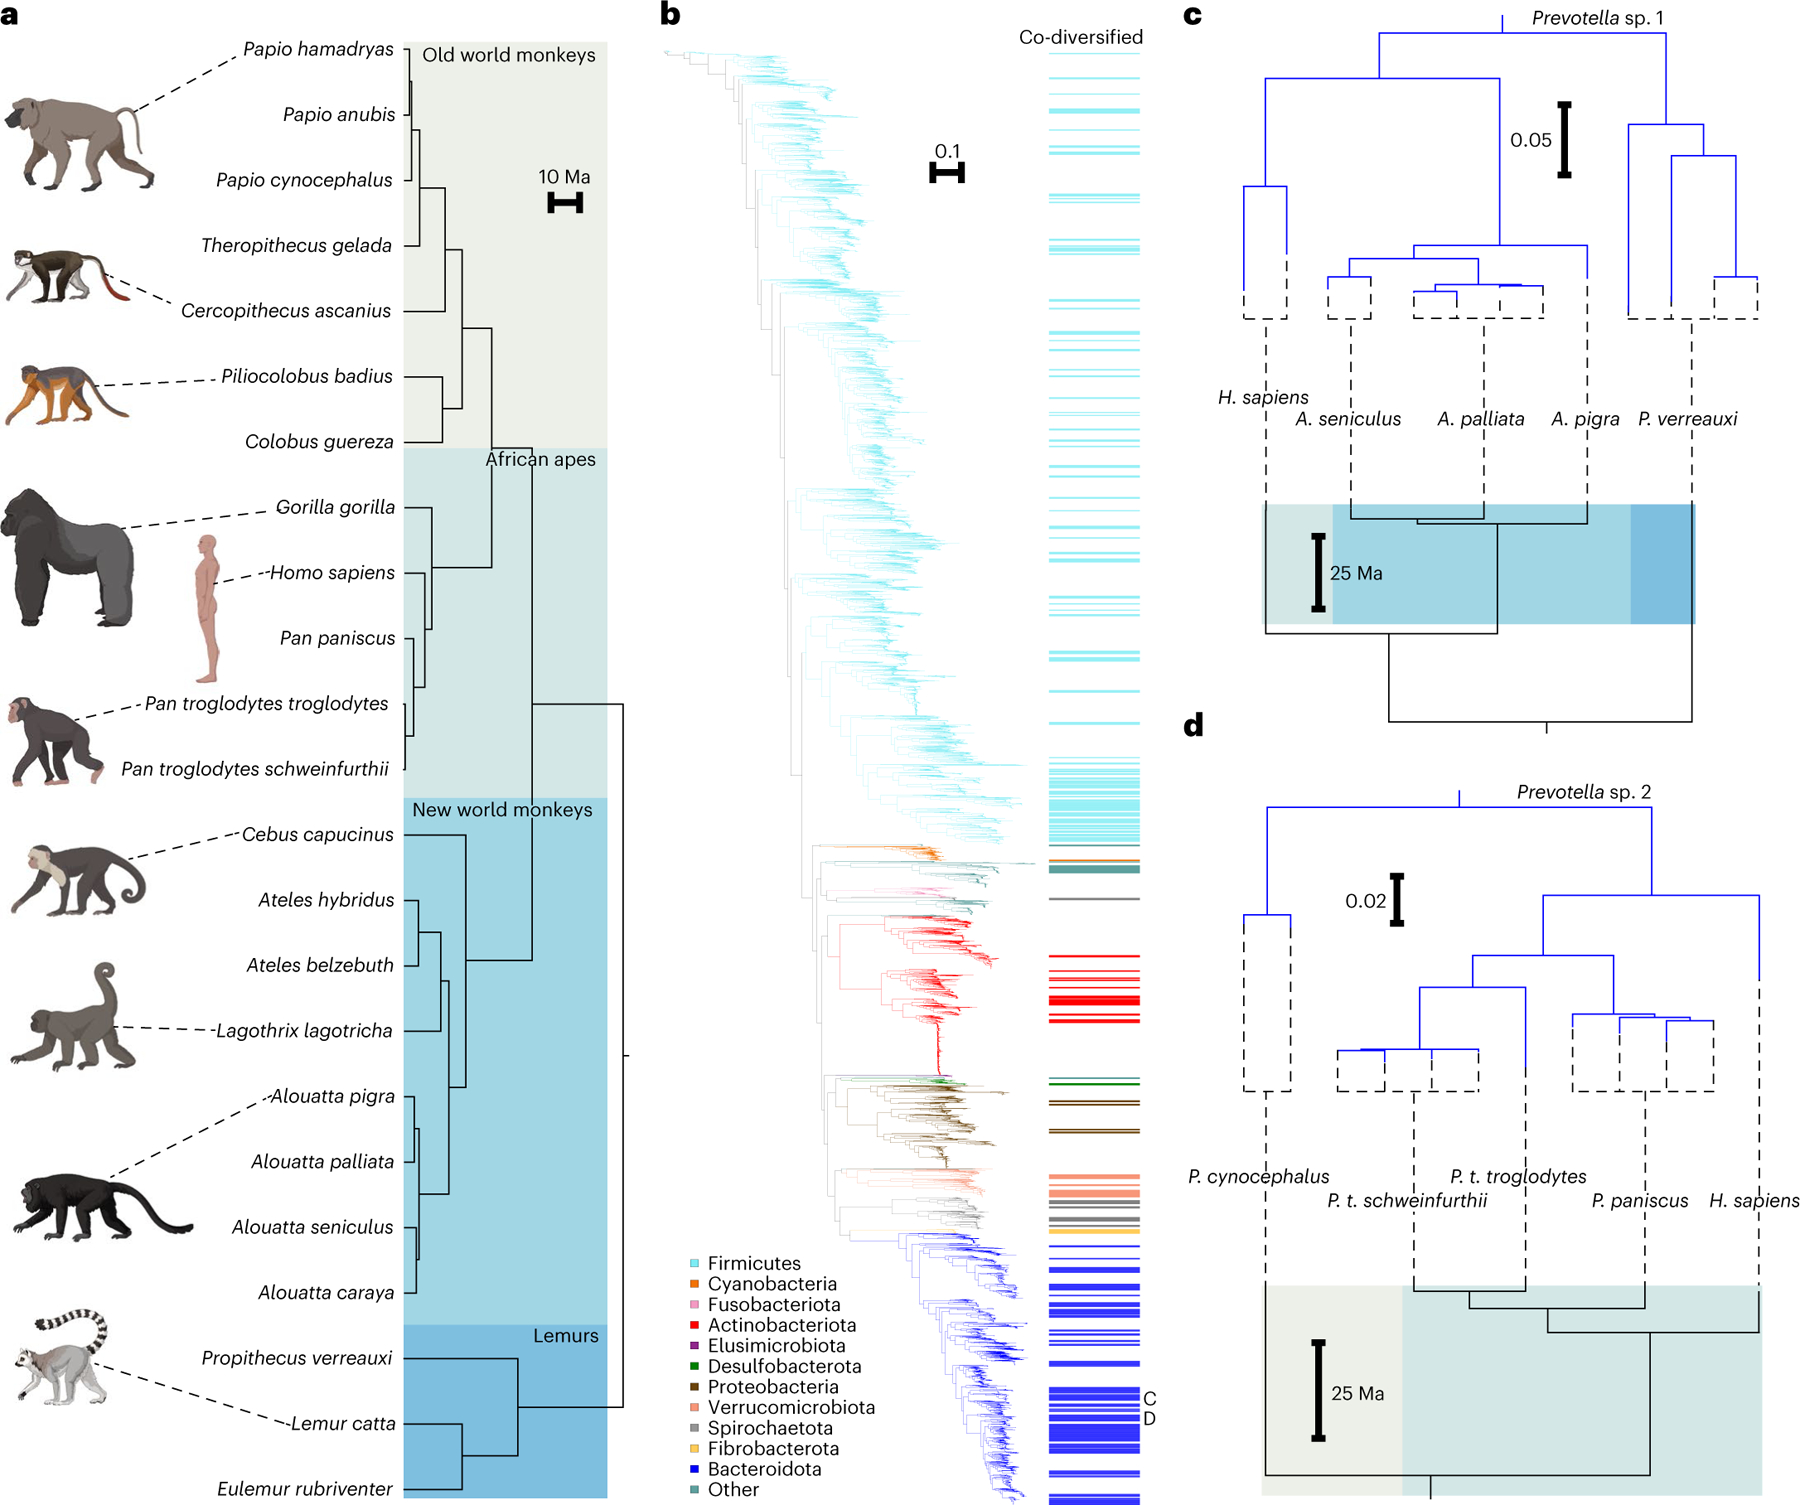
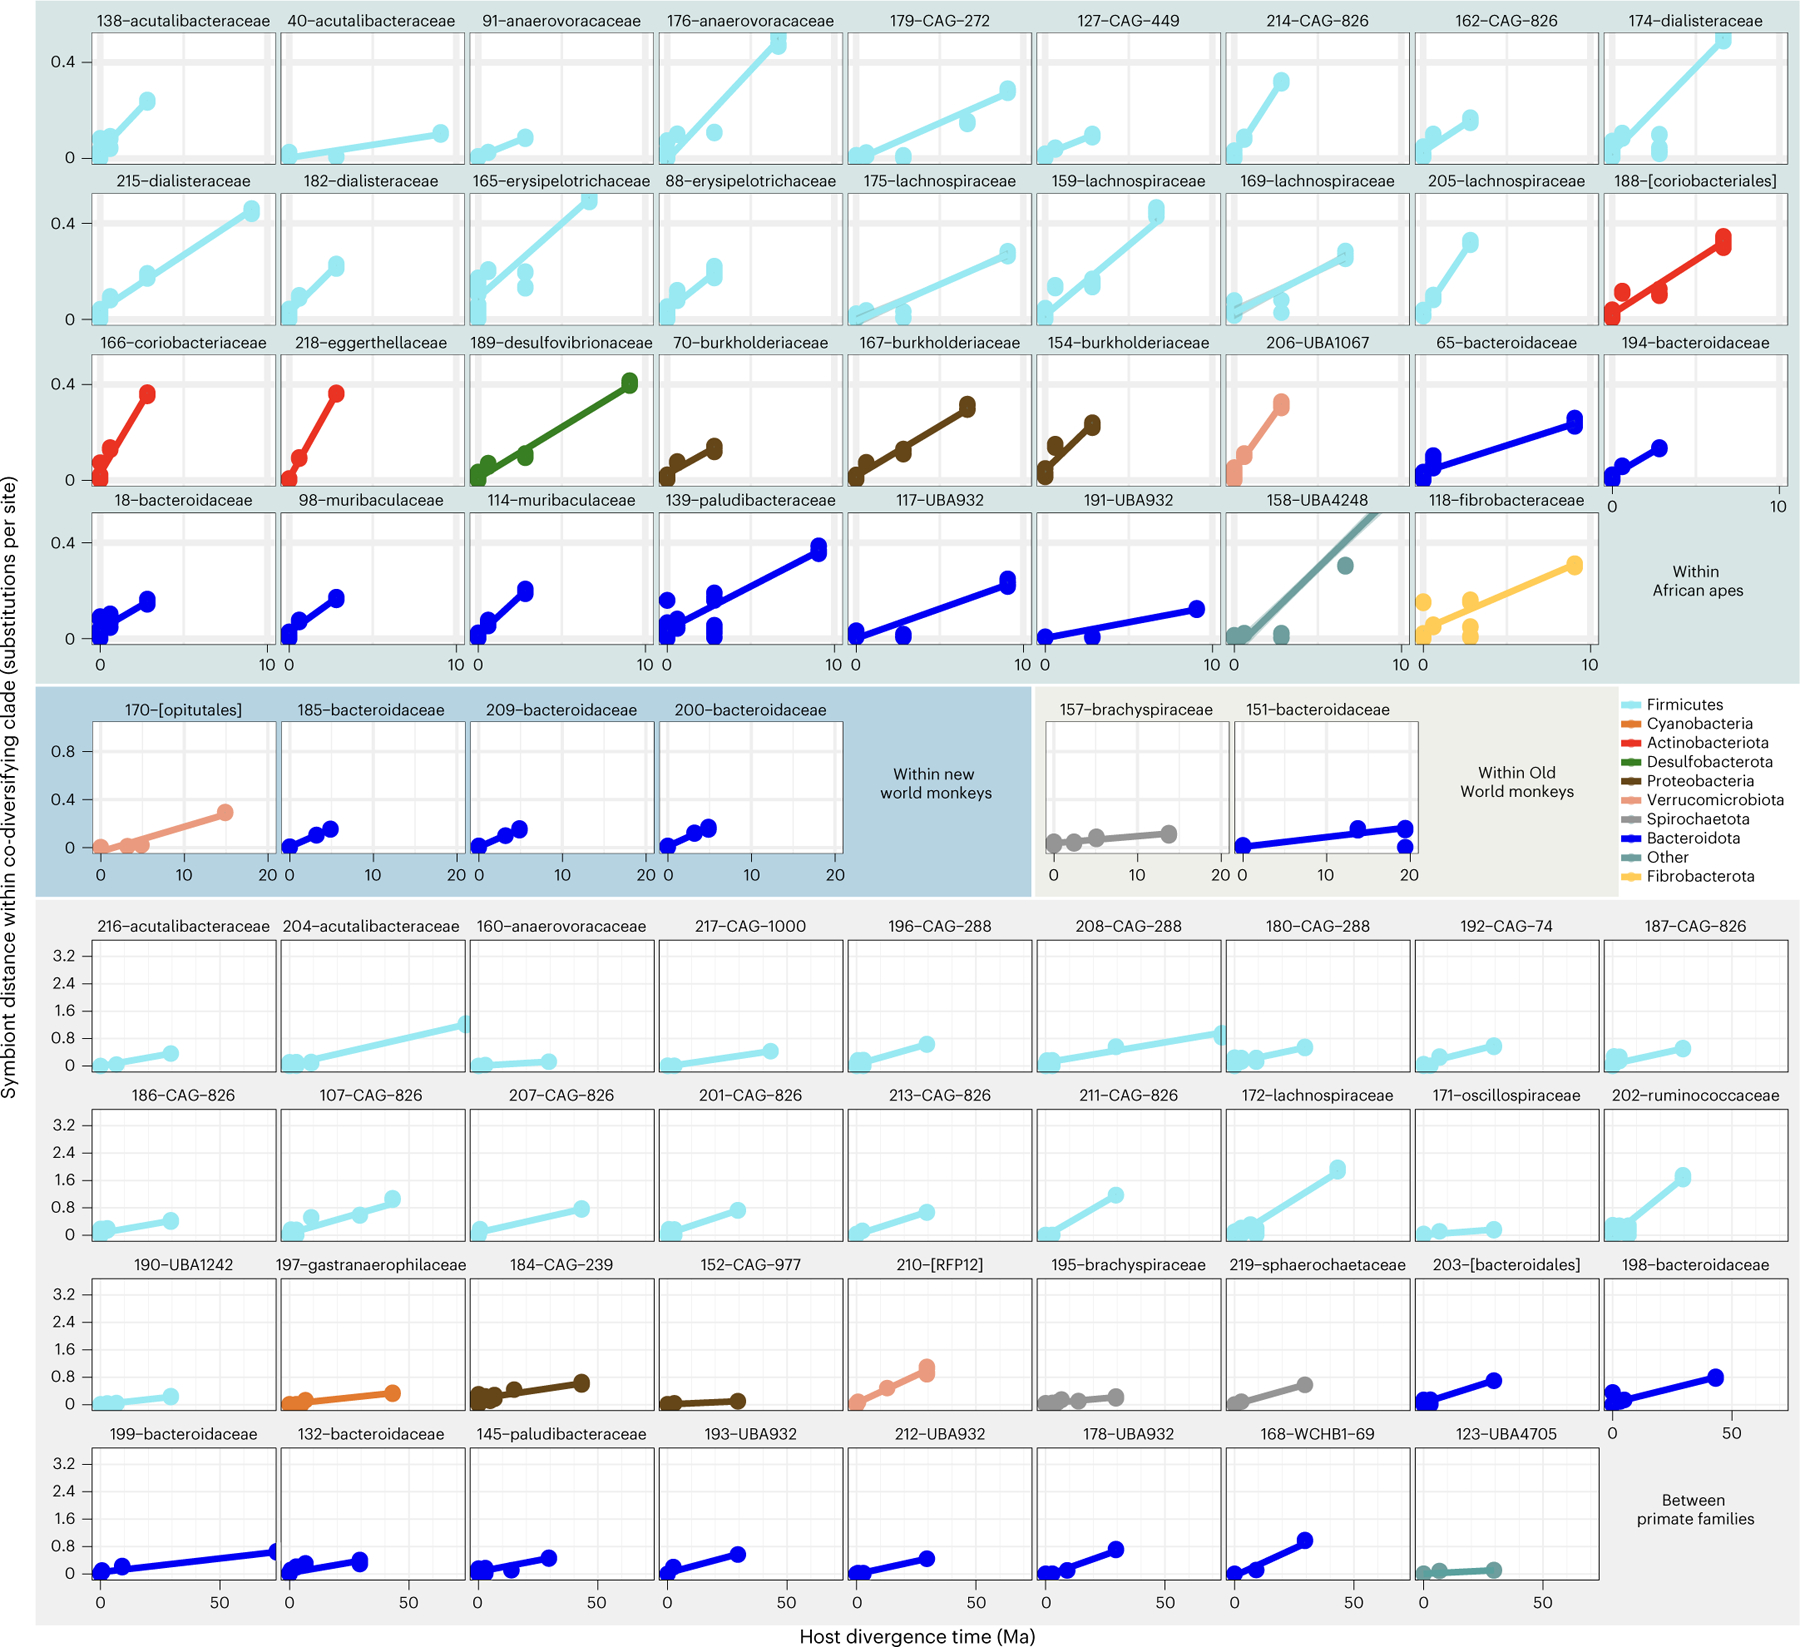
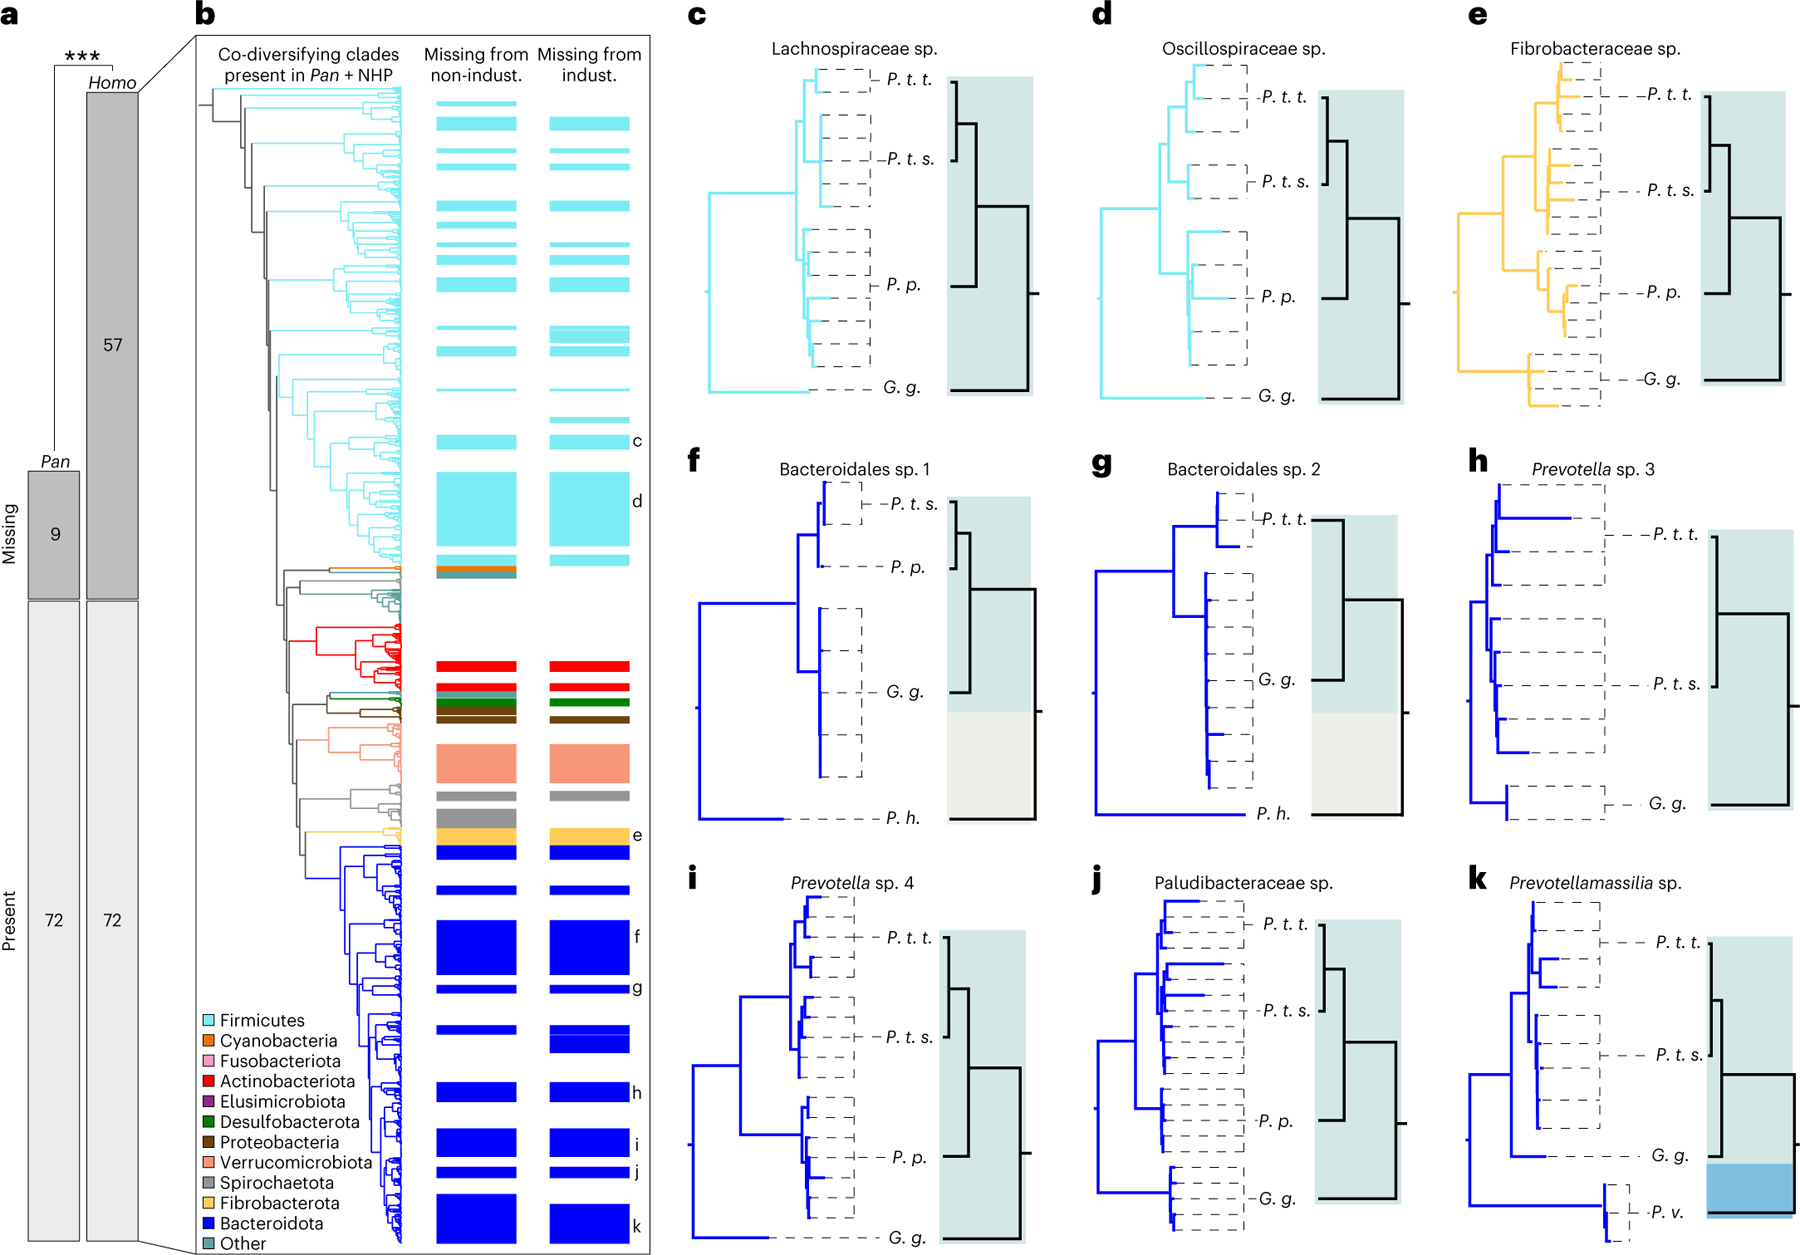
Humans and other primates harbour complex gut bacterial communities that influence health and disease, but the evolutionary histories of these symbioses remain unclear. This is partly due to limited information about the microbiota of ancestral primates. Here, using phylogenetic analyses of metagenome-assembled genomes (MAGs), we show that hundreds of gut bacterial clades diversified in parallel (that is, co-diversified) with primate species over millions of years, but that humans have experienced widespread losses of these ancestral symbionts. Analyses of 9,460 human and non-human primate MAGs, including newly generated MAGs from chimpanzees and bonobos, revealed significant co-diversification within ten gut bacterial phyla, including Firmicutes, Actinobacteriota and Bacteroidota. Strikingly, ~44% of the co-diversifying clades detected in African apes were absent from available metagenomic data from humans and ~54% were absent from industrialized human populations. In contrast, only ~3% of non-co-diversifying clades detected in African apes were absent from humans. Co-diversifying clades present in both humans and chimpanzees displayed consistent genomic signatures of natural selection between the two host species but differed in functional content from co-diversifying clades lost from humans, consistent with selection against certain functions. This study discovers host-species-specific bacterial symbionts that predate hominid diversification, many of which have undergone accelerated extinctions from human populations.


Figures

Extended Data Fig. 1 |
Extended Data Fig. 1 |. Map of sampling locations.
a, Map shows sampling locations for human, great ape, new world monkey, old world monkey, and lemur fecal samples. Circles correspond to individual populations sampled as indicated by the key. b, Map of equatorial Africa shows sampling locations for Pan fecal samples sequenced for this study. Two-letter codes correspond to those associated with host IDs in Supplementary Table 1. DP = Doumo Pierre; IK = Ikela; GT = Goualougo Triangle; TL2 = Tshuapa-Lomami-Lualaba; GM = Gombe; LK = Lui-kotal; KR = Kokolopori..
Extended Data Fig. 2 |
Extended Data Fig. 2 |. Histogram of number of significant nodes detected after permuting host labels.
X axis indicates number of significant nodes (Mantel test p < 0.01, r > 0.75) recovered in the co-diversification scan after permuting labels of host tree but retaining symbiont tree labels and all other structure in the dataset. Results of 100 random permutations are shown. Value for unpermuted dataset is shown as a vertical red line..
Extended Data Fig. 3 |
Extended Data Fig. 3 |. Number of significant nodes detected after removing MAGs from individual host species.
X axis indicates the host species whose MAGs were removed from that dataset before performing sensitivity analyses in which scans for co-diversification were performed after removing individual host species. The number of co-diversifying clades (Mantel test p < 0.01, r > 0.75) detected in each scan are shown. Value for the full dataset is shown as a horizontal dashed line..
Extended Data Fig. 4 |
Extended Data Fig. 4 |. Depths of co-diversifying bacterial clades corroborate known ages of host clades.
a, Scatter plot and regression line show the positive association between the depths of co-diversifying bacterial clades based on protein divergence of bac120 single-copy core genes and the known ages of their corresponding host clades based on timetree.org (df = 204; t = 6.03; unadjusted p-value = 7.36e-09). Each point corresponds to a co-diversifying bacterial clade. bd, Scatter plots show relationships for Firmicutes (df = 72; t = 8.58; unadjusted p-value = 9.16e-11) (b), Actinobacteriota (df = 11; t = 2.25; unadjusted p-value = 0.046) (c), and Bacteroidota (df = 91; t = 4.38, unadjusted p-value = 3.17e-05) (d). Colours denote bacterial phyla as in Fig. 1b. In ad, bands represent 99% confidence intervals, centre lines indicate best-fit regression, and p-values represent results of two-sided Student’s t-tests..
Extended Data Fig. 5 |
Extended Data Fig. 5 |. Depths of non-co-diversifying bacterial clades and ages of host clades.
Scatter plot and regression line show the association between the depths of strongly non-co-diversifying bacterial clades (r < 0) based on protein divergence of bac120 single-copy core genes and the known ages of their corresponding host clades based on timetree.org (df = 53; t = 0.86; unadjusted p-value = 0.393). Each point corresponds to a bacterial clade. The non-codiversifying clades were derived from host species spanning the same epochs as in Extended Data Fig. 3. Bands represent 99% confidence intervals, centre line represents best-fit regression, and p-value represents result of two-sided Student’s t-tests. In contrast to results displayed in Extended Data Fig. 3 based on co-diversifying clade depths, non-co-diversifying clade depths were not significantly positively associated with known ages of the corresponding host clades..
Extended Data Fig. 6 |
Extended Data Fig. 6 |. Rates of genomic evolution vary among bacterial phyla.
Scatter plot and regression lines show the positive relationships within co-diversifying bacterial clades between DNA substitutions per site of bacterial lineages and divergence time of host species from which the lineages were recovered. Each point represents a comparison between two co-diversifying bacterial lineages. Points and lines are coloured based on bacterial phyla as indicated by the key and corresponding to Fig. 1. Bands represent 95% confidence intervals and centre lines represent best-fit regression..
Extended Data Fig. 7 |
Extended Data Fig. 7 |. COG pathways enriched in Pan MAGs from co-diversifying clades missing from humans.
Bar plots show the enrichment scores of COG pathways identified as significantly overrepresented in Pan MAGs from co-diversifying clades missing from humans relative to Pan MAGs from co-diversifying clades present in humans. Enrichment scores were calculated as the Rao test statistic for equality of proportions as implemented in Anvi’o anvi-compute-functional-enrichment. Only the top 20 COG pathways are shown in the figure. For a full list see Supplementary Table 5..
Extended Data Fig. 8 |
Extended Data Fig. 8 |. Genomic signatures of selection in human and chimpanzee gut bacteria.
Scatter plot shows the relationship between per-CORF dN/dS values in humans and Pan. Points correspond to individual CORFs from co-diversifying bacterial lineages detected in human and Pan. Dashed vertical and horizontal lines correspond to the dN/dS expectation under neutral evolution, and dashed diagonal line corresponds to a 1-to-1 relationship between dN/dS values in humans and Pan. Points are coloured based on bacterial phyla as in Fig. 1 and as indicated in the key..
Fig. 1 |
Fig. 1 |. Co-diversification of gut microbiota with primate species.
a, Phylogeny shows relationships among primate species from which gut bacterial genomes were derived. Shading delineates Old World monkeys, New World monkeys, African apes and lemurs. b, Phylogeny shows relationships among 9,460 high-quality gut bacterial genomes assembled from the primate gut microbiota. Coloured bars to the right of the phylogeny mark clades showing significant evidence of co-diversification with primate species (Mantel r > 0.75; non-parametric permutation test P < 0.01). Colours of branches and bars correspond to bacterial phyla. Scale indicates amino-acid substitutions per site. Letters C and D indicate clades highlighted in c and d, respectively. c,d, Tanglegrams show examples of correspondence between topologies of bacterial (top of each panel) and host-species (bottom of each panel) phylogenies for two co-diversifying clades of unclassified Prevotella species.
Fig. 2 |
Fig. 2 |. Molecular timescales for bacterial evolution in the primate gut.
Scatterplots and regression lines show relationships between DNA sequence divergence (nucleotide substitutions per site) of core genes (bac120 marker set) within co-diversifying clades and divergence times of host species from which bacterial genomes were recovered. Each facet corresponds to a single co-diversifying clade. All co-diversifying clades displaying Mantel’s r > 0.95 are shown. Facets are grouped on the basis of the host species from which bacterial genomes were recovered as indicated by backdrop colours corresponding to Fig. 1a. Clade ID numbers and family- or order-level taxonomic assignments (Supplementary Table 4) are presented above each facet.
Fig. 3 |
Fig. 3 |. Widespread extinctions of ancestral symbionts from the human microbiota.
a, Mosaic plot shows that a greater proportion of ancestral co-diversifying clades were absent from humans than from Pan; two-sided Fisher’s exact test ***P = 2.8 × 10⁻⁷. Bars indicate the number of clades inferred to be ancestral to humans and chimpanzees. b, Phylogeny shows relationships among co-diversifying clades present in Pan and at least one non-human primate (NHP) outgroup to the Hominini, corresponding to the rightmost bars in a. Colours of branches and bars correspond to bacterial phyla as indicated by the key. Leftmost coloured bars to the right of the phylogeny mark clades not detected in any non-industrialized (non-indust.) human population. Rightmost coloured bars mark clades not detected in any industrialized (indust.) human population. c–k, Tanglegrams show examples of co-diversifying clades ancestral to the Hominini but not detected in humans. Left and right phylogenies in each panel show relationships among bacteria and hosts, respectively. Dashed lines connect bacteria to host species (P. t. t., Pan troglodytes troglodytes; P. t. s., Pan troglodytes schweinfurthii; P. p., Pan paniscus; G. g., Gorilla gorilla; P. h., Papio hamadryas; P. v., Propithecus verreauxi) from which they were recovered. Colours denote bacterial and host taxa as in Fig. 1. All bacterial clades were supported by >75% of bootstrap replicates. Note the absence of human-derived bacterial lineages from each clade.

References

    1. Bello MG, Knight R, Gilbert JA & Blaser MJ Preserving microbial diversity. Science 362, 33–34 (2018). - PubMed
    1. Sonnenburg ED & Sonnenburg JL The ancestral and industrialised gut microbiota and implications for human health. Nat. Rev. Microbiol 17, 383–390 (2019). - PubMed
    1. Groussin M, Mazel F & Alm EJ Co-evolution and co-speciation of host-gut bacteria systems. Cell Host Microbe 28, 12–22 (2020). - PubMed
    1. Davenport ER et al. The human microbiome in evolution. BMC Biol 15, 127 (2017). - PMC - PubMed
    1. Moeller AH et al. Cospeciation of gut microbiota with hominids. Science 353, 380–382 (2016). - PMC - PubMed

Publication types