. 2023 Jul;8(7):1213-1226.
doi: 10.1038/s41564-023-01377-z. Epub 2023 May 11.

Chloroquine resistance evolution in Plasmodium falciparum is mediated by the putative amino acid transporter AAT1

Affiliations

Chloroquine resistance evolution in Plasmodium falciparum is mediated by the putative amino acid transporter AAT1

Alfred Amambua-Ngwa et al. Nat Microbiol. 2023 Jul.

Abstract

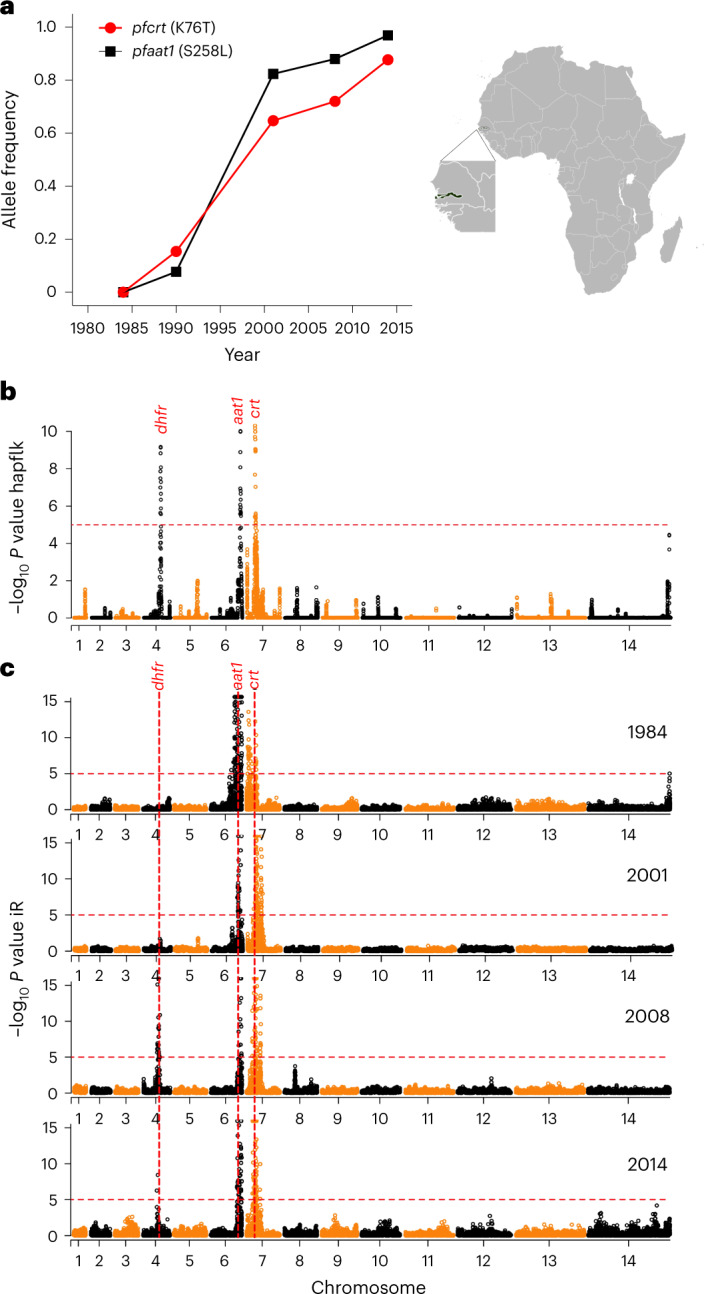
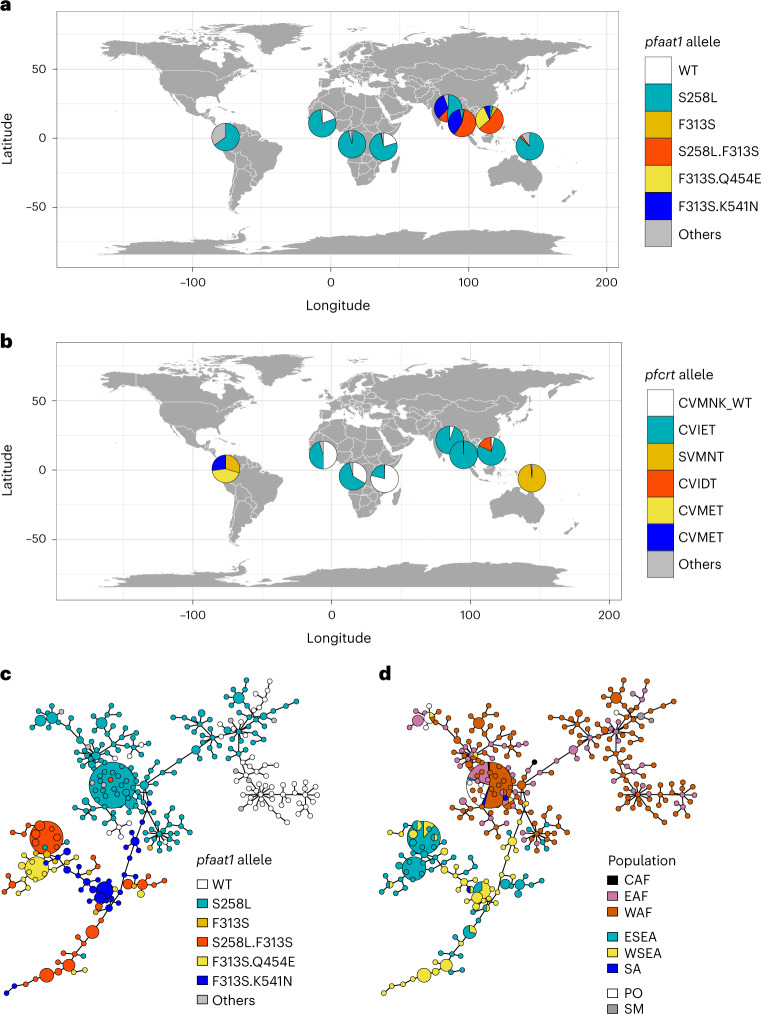
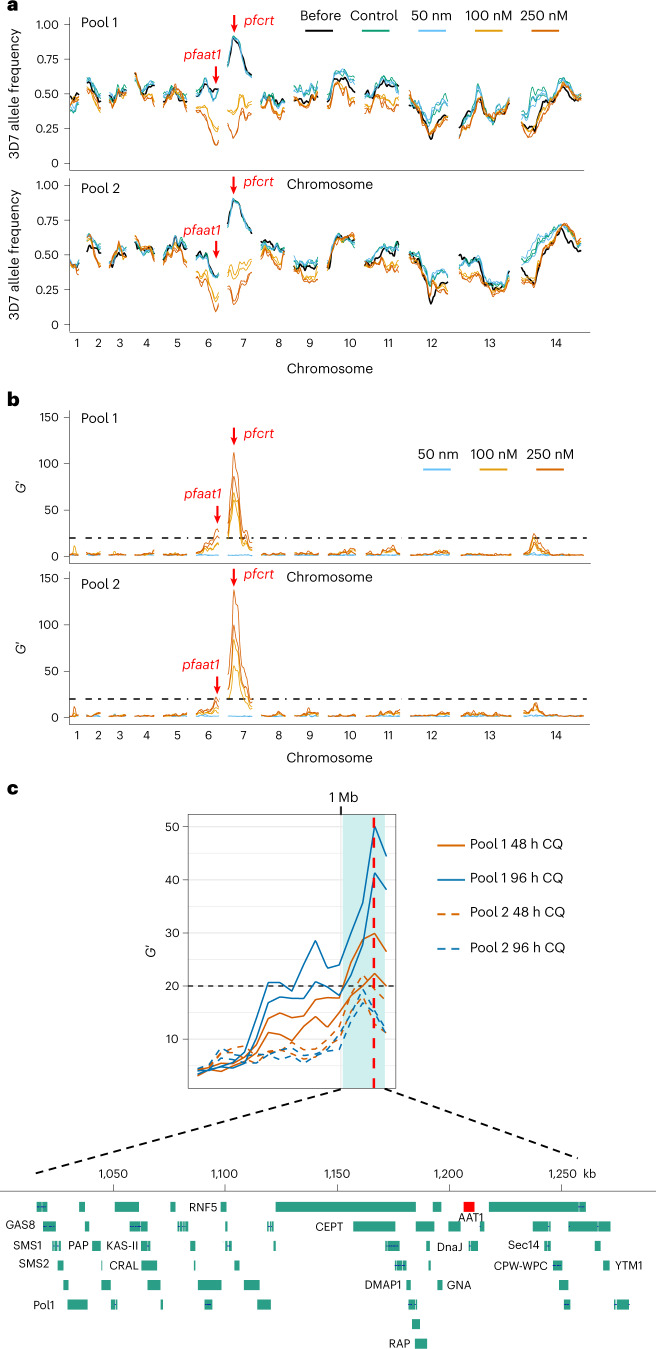
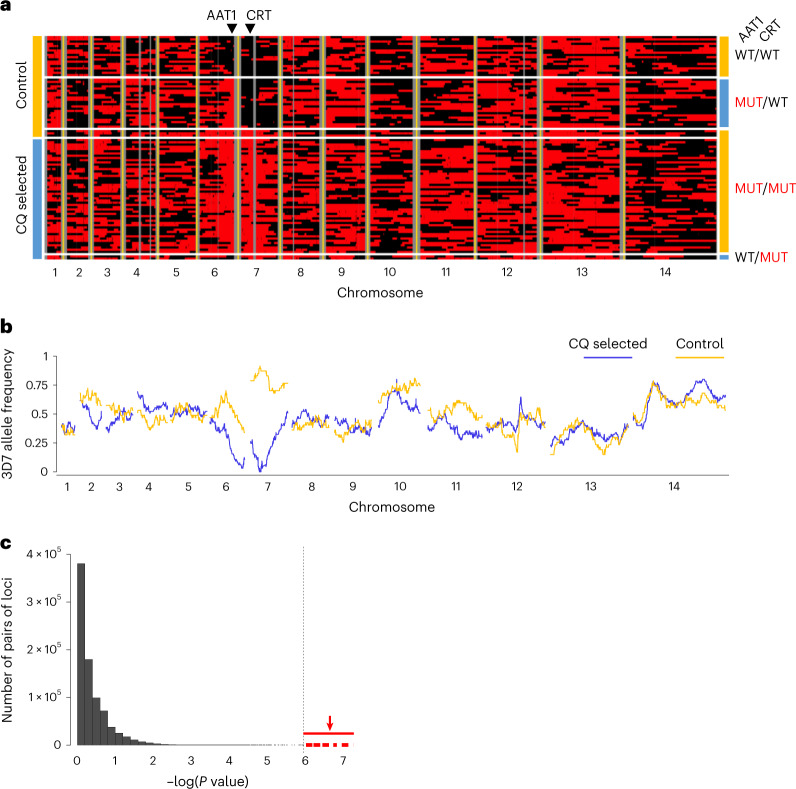
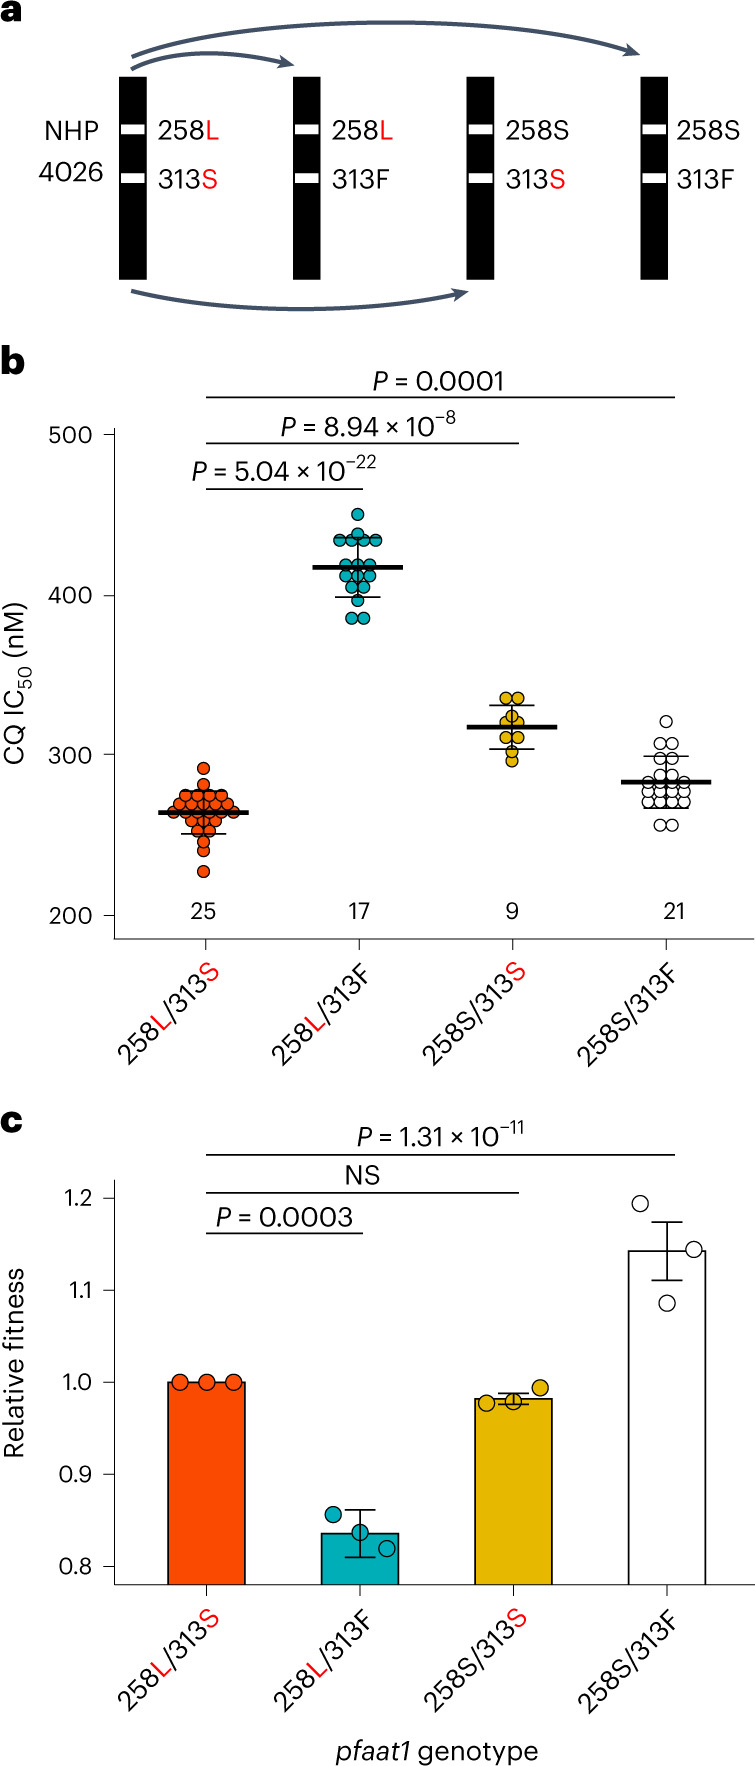
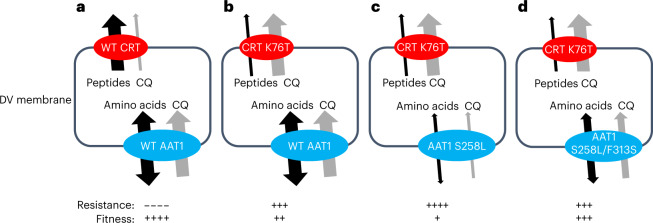
Malaria parasites break down host haemoglobin into peptides and amino acids in the digestive vacuole for export to the parasite cytoplasm for growth: interrupting this process is central to the mode of action of several antimalarial drugs. Mutations in the chloroquine (CQ) resistance transporter, pfcrt, located in the digestive vacuole membrane, confer CQ resistance in Plasmodium falciparum, and typically also affect parasite fitness. However, the role of other parasite loci in the evolution of CQ resistance is unclear. Here we use a combination of population genomics, genetic crosses and gene editing to demonstrate that a second vacuolar transporter plays a key role in both resistance and compensatory evolution. Longitudinal genomic analyses of the Gambian parasites revealed temporal signatures of selection on a putative amino acid transporter (pfaat1) variant S258L, which increased from 0% to 97% in frequency between 1984 and 2014 in parallel with the pfcrt1 K76T variant. Parasite genetic crosses then identified a chromosome 6 quantitative trait locus containing pfaat1 that is selected by CQ treatment. Gene editing demonstrated that pfaat1 S258L potentiates CQ resistance but at a cost of reduced fitness, while pfaat1 F313S, a common southeast Asian polymorphism, reduces CQ resistance while restoring fitness. Our analyses reveal hidden complexity in CQ resistance evolution, suggesting that pfaat1 may underlie regional differences in the dynamics of resistance evolution, and modulate parasite resistance or fitness by manipulating the balance between both amino acid and drug transport.


Conflict of interest statement

The authors declare no competing interests.

Figures

Fig. 1
Fig. 1. Rapid allele frequency change and strong signals of selection around pfaat1 in Gambia.
a, Temporal allele frequency change at SNPs coding for pfaat1 S258L and pfcrt K76T between 1984 and 2014. The map and expanded West African region show the location of Gambia. b, Significance of haplotype differentiation across temporal populations of P. falciparum parasites determined using hapFLK. P values were corrected for multiple testing using the BH method. Significance thresholds at −log10(false discovery rate (FDR)-corrected P value) of 5 are indicated with red dotted horizontal lines. Regions within the top 1% tail of FDR-corrected P values are marked with gene symbols. The strongest signals genome-wide seen are around pfcrt, pfaat1 and pfdhfr (which is involved in pyrimethamine resistance). c, IBD, quantified with the isoRelate (iR) statistic, for temporal populations sampled from Gambia. P values were corrected for multiple testing using the BH method. Significance thresholds at −log10(FDR-corrected P value) of 5 are indicated with red dotted horizontal lines. Regions within the top 1% tail of FDR-corrected P values are marked with gene symbols. Consistently high peaks of IBD around pfcrt and pfaat1 are seen for parasite populations in all years of sampling. The 1990 sample (n = 13) is not shown in c. Source data
Fig. 2
Fig. 2. Distinctive trajectory of pfaat1 evolution in SEA.
a, Global distribution of pfaat1 alleles. b, Comparable maps showing percentages of pfcrt haplotypes for amino acids 72–76. The coloured segments show the major pfcrt haplotypes varying at the K76T mutation. We used dataset from MalariaGEN release 6 for pfaat1 and pfcrt allele frequency analysis. Data used for the figure are contained in Supplementary Table 2. Only samples with monoclonal infections (N = 4,051) were included (1,233 from west Africa (WAF), 415 from east Africa (EAF), 170 from central Africa (CAF), 994 from east southeast Asia (ESEA), 998 from west southeast Asia (WSEA), 37 from south Asia (SA), 37 from south America (SM) and 167 from the Pacific Ocean region (PO)). c,d, MSNs of haplotypes coloured by pfaat1 allele (c) and geographical location (d), respectively. Networks were constructed from 50 kb genome regions centred by pfaat1 (25 kb up- and downstream. This spans the genome regions showing LD around pfaat1 (Supplementary Fig. 2). A total of 581 genomes with the highest sequence coverage were used to generate the network. The networks were generated on the basis of 1,847 SNPs (at least one mutant in the full dataset—MalariaGEN release 6). Circle size indicates number of samples represented (smallest, 1; largest, 87). Haplotypes from the same region (Asia or Africa) were clustered together, indicating independent origin of pfaat1 alleles.
Fig. 3
Fig. 3. Genetic crosses and BSA reveal two QTL after CQ selection.
a, Allele frequency plots across the genome before and after CQ treatment. Lines with the same colour indicate results from technical replicates. b, QTLs identified using the G′ approach. Lines with the same colour indicate results from technical replicates. a and b include results from BSA with 48 h CQ treatment with samples collected at day 4. For the complete BSA from different collection timepoints and drug treatment duration under different CQ concentrations, see Supplementary Figs. 3 and 4. c, Fine mapping of the chr. 6 QTL. The 95% confidence intervals (CIs) were calculated from the 250 nM CQ treated samples, including data from different collection time points (day 4 for 48 h CQ treatment and day 5 for 96 h CQ treatment), pools (pool 1 and pool 2), and drug treatment duration (48 h and 96 h). Light cyan shadow shows boundaries of the merged CIs of all the QTLs. Each line indicates one QTL; black dashed line indicates threshold for QTL detection (G′ = 20). The vertical red dashed line indicates pfaat1 location.
Fig. 4
Fig. 4. Analysis of cloned progeny reveals linkage and epistatic interactions between pfcrt and pfaat1.
a, Allelic inheritance of 109 unique recombinant progeny. Black and red blocks indicate alleles from 3D7 and NHP4026, separately. Vertical grey lines show non-core regions where no SNPs were genotyped. Left: clones isolated from recombinant progeny pools with or without CQ treatment are labelled. Right: pfaat1 and pfcrt alleles are labelled. WT indicates pfaat1 and pfcrt alleles from 3D7 and MUT indicates alleles from NHP4026. The location of pfaat1 and pfcrt is marked using black triangles on the top of the panel. b, Genome-wide 3D7 allele frequency plot of unique progeny cloned from pools after 96 h of CQ (250 nM) treatment (blue) or from control pools (gold). c, Linkage between loci on different chromosomes measured by Fisher’s exact test. The dotted vertical line marks the Bonferroni-corrected significance threshold (one-tailed), while points shown in red are comparisons between SNPs flanking pfaat1 and pfcrt. Supplementary Table 7 shows non-random associations between genotypes in parasite clones recovered from untreated cultures.
Fig. 5
Fig. 5. Allelic replacement impacts drug response and parasite fitness.
a, CRISPR–Cas9 gene editing. Starting with the NHP4026 parent, we generated all combinations of the SNP-states at pfaat1. b, Drug response. Each dot indicates one replicate IC50 measurement: we used two to four independent CRISPR edited clones for each haplotype examined. The number of biological replicates is shown above the x axis. We conducted pairwise t-tests (two-tailed) to compare IC50 values between parasite lines, without adjustment for multiple comparisons. Haplotypes are shown on the x axis with derived amino acids shown in red. Bars show means ± s.e.m.), while significant differences between haplotypes are marked. c, Fitness. The bars show mean relative fitness (±1 s.e.m.) measured in replicated competition experiments, and dots represent fitness from individual measurements. We conducted three independent competition experiments for each edited parasite group in the absence of CQ. F-statistic was used to compare fitness between parasite lines. Results from assays for each edited group were combined using meta-analyses with random effects. For allele frequency changes for each competition experiment, see Extended Data Fig. 10. NS, not significant. Source data
Fig. 6
Fig. 6. Model for involvement of pfaat1 haplotypes in CQ resistance and fitness.
pfCRT (red) and pfAAT1 (blue) are both situated in the digestive vacuole (DV) membrane. a, WT pfCRT and pfAAT1 transport peptides and aromatic amino acids, respectively, as well as CQ. b, pfCRT K76T exports CQ from the DV away from its site of action, leading to elevated resistance but transports peptides inefficiently leading to a loss of fitness. c, pfAAT1 S258L reduces entry of CQ into the DV, leading to elevated resistance, but amino acid flux is affected, leading to a loss of fitness. d, The pfAAT1 S258L/F313S double mutation increases CQ influx in comparison with the S258L alone but the amino acid transport function is restored, leading to reduced IC50 values and increased fitness in the absence of drug treatment.
Extended Data Fig. 1
Extended Data Fig. 1. Estimation of selection coefficient (s) for pfaat1 (S258L) and pfcrt (K76T) alleles.
p is the frequency of mutant alleles (pfaat1 S258L or pfcrt K76T) as indicated in Fig. 1a, and q (=1-p) is the inferred frequency of wild-type (3D7) alleles. The x-axis indicates parasite generations (labeled with sample collection year). We estimated selection coefficients (s) based on allele frequency from year 1990 and 2001, as CQ monotherapy was stopped in Gambia in 2004. s indicates the changes in relative growth per parasite generation (that is the duration of the complete lifecycle in both mosquito and human host). The calculation was based on estimates of 2, 4, or 6 generations per year.
Extended Data Fig. 2
Extended Data Fig. 2. Haplotype structure at the pfcrt (left panel) and pfaat1 (right panel) regions.
Haplotype relationships were based on Identity-by-Descent of genome segments encompassing 25 kb on either side of each gene (see methods). Haplotypes joined by lines indicate >90% IBD. Each point depicts an isolate with point colors representing the years from which they were sampled. Square points represent complex infections and circles represent monoclonals. MOI, multiplicity of infection.
Extended Data Fig. 3
Extended Data Fig. 3. The proportion of pairs identical by descent (IBD) within populations from global locations.
Panels A-H show the proportion of pairs IBD plotted across the genome for parasites from different geographical regions (marked in the top left of each panel). For samples where >90% of the genomes are IBD, only one representative sample with the highest genotype rate was selected and used for IBD analysis. Sample numbers are shown in each panel. Chromosome boundaries are indicated with grey dashed vertical lines. The location of pfaat1 and pfcrt are indicated with red arrows on top of each panel. The chr 10 peak (West Africa, A) contains pfmspdbl2 associated with decreased sensitivity to halofantrine, mefloquine and lumefantrine. The chr 8 peak (East Africa and Asia (C-H)) contains dihydropteroate synthase (sulfadoxine resistance) and the chr 12 peak (D-F) contains GTP cyclohydrolase I, a compensatory locus for antifolate drugs. See also analyses by Amambua-Ngwa et al., Hendon et al., and Carrasquilla et al..
Extended Data Fig. 4
Extended Data Fig. 4. pfcrt and pfaat1 allele frequency distributions and correlations in African countries.
A. pfcrt allele distribution in African countries. B. pfaat1 allele distribution in African countries. C. Correlations in allele frequencies between pfcrt (CVIET) and pfaat1 (S258L). Frequencies of the CVIET haplotype for amino acids 72-76 in pfcrt are significantly correlated with allele frequencies of pfaat1 S258L in West Africa (R2 = 0.65, p = 0.0017, red dashed line) or across all African populations (R2 = 0.44, p = 0.0021). Point size indicates sample numbers, while color indicates sampling locations. We used t-test to establish if the Pearson’s r statistic differs significantly from zero.
Extended Data Fig. 5
Extended Data Fig. 5. UPGMA tree showing the relationship of 581 haplotypes based on SNPs inside the 50 kb region surrounding pfaat1.
The tree was rooted with Plasmodium reichenowi (not shown in the tree). WAF: west Africa, EAF: east Africa, CAF: central Africa, SM: south America, ESEA: east Southeast (SE) Asia, SA: south Asia, WSEA: west SE Asia, PO: Pacific Ocean region. Source data
Extended Data Fig. 6
Extended Data Fig. 6. 3D7 allele frequency for QTLs at chr.6, chr.7 and chr.14.
CQ treatments were applied to the pools on day 0 at 0 (control), 50, 100, or 250 nM. CQ was removed on day 2 (48 hour treatment) or day 4 (96 hour treatment), as shaded with light blue. For 48 hour CQ treatments, samples were collected at day 0, 4, and 7; while for 96 hour CQ treatment, samples were collected at day 0, 5, and 10. Solid or dashed lines are results from different technical replicates. The 3D7 allele frequencies in CQ treated pools decrease at both chr.6 and chr.7 QTL regions. At the chr.14 QTL region, allele frequencies show no to little change following drug treatment, suggesting this QTL is unrelated to drug treatment.
Extended Data Fig. 7
Extended Data Fig. 7. Impact of CRISPR/Cas9 substitutions on IC50 of (A) quinine, (B) lumefantrine, (C) mefloquine and (D) amodiaquine.
CRISPR/Cas9 gene editing resulted in small differences in IC50 for quinine (QN), lumefantrine (LUM) and Amodiaquine (AMD), but no significant changes for mefloquine (MQ). However, all IC50’s were below levels of clinical significance for these drugs (clinical thresholds: QN = 600 nM; MQ = 30 nM, AMD = 60 nM), or at the lower end of the in vitro range (0-150 nM) in the case of LUM. The number of biological replicates is shown above the x-axis. P values indicate significance levels and are based on two-way ANOVA analysis. Data are presented as mean values +/− SEM. Source data
Extended Data Fig. 8
Extended Data Fig. 8. Introduction of S258L results in chloroquine resistance in yeast.
Yeast doubling time was calculated from the linear portion of exponential growth. Data was shown as means from 3 independent experiments ± SEM, and significance and was calculated according to multiple comparisons (with Turkey corrections) of two-way ANOVA. Growth of yeast cells expressing wild type pfaat1 (WT) is severely impacted by CQ treatment (1 mM CQ through the experiments) but is recovered in yeast expressing pfaat1 S258L. Published results demonstrate that AAT1 is expressed in the yeast cell membrane, while pfAAT1 localizes to the digestive vacuolar membrane, and may also be present in the plasma membrane.
Extended Data Fig. 9
Extended Data Fig. 9. Topology structure of pfAAT1 protein.
(A) AlphaFold model of PfAAT1 (left), representative I-TASSER model of PfAAT1 (center), structural superposition of the AlphaFold model (teal) and I-TASSER model (gray, right). TOPCONS transmembrane (TM) helix topology predictions are mapped onto the models in dark blue (left, center). AlphaFold and I-TASSER models align with a RMSD of 2.5 Å over 327 of 440 residues. Amino-terminal residues 1-166 were excluded from all models due to low confidence in structure prediction. (B) Detailed view of the mutations on the predicted PfAAT1 3-D structure using the AlphaFold model. The right view is related to the left by a 45° rotation about the axis looking down at the figure followed by a 90° rotation about the horizontal axis. The four SNPs shown as space-filling models are all arranged within a plane at one side of the model, perpendicular to the membrane. S258L (helix 3) and F313S (helix 5) are located opposite each other with helix 8 in between. Given the epistatic interactions between the PfAAT1 S258L and F313S SNPs evident from our functional analyses, the F313S substitution of the bulky, hydrophobic phenylalanine with the smaller, polar serine may compensate for a disruption in the transmembrane region that includes helices 3, 5, and 8 potentially allowing for partial restoration of predicted amino acid transport activity. Q454E is located on helix 8 near the TM surface and K541N is located in a loop connecting helix 9 and 10. (C) Topology of PfAAT1 inferred using 3D structure. There are eleven transmembrane (TM) helices. Three of the mutations are located at the TM helices, while K541N is located at a loop connecting helix 9 and 10. The color scheme matches the schematic in Panel B. The blue triangle indicates amino-terminal residues 1-166 that were excluded from structure prediction.
Extended Data Fig. 10
Extended Data Fig. 10. Allele frequency changes in head-to-head competition experiments between different CRISPR/Cas9 edited parasites and NHP4026.
We used three independent CRISPR/Cas9 edited clones for each genotype, and two technical replicates for each competition experiment (average values plotted).

Comment in

References

    1. Wootton JC, et al. Genetic diversity and chloroquine selective sweeps in Plasmodium falciparum. Nature. 2002;418:320–323. doi: 10.1038/nature00813. - DOI - PubMed
    1. Roper C, et al. Intercontinental spread of pyrimethamine-resistant malaria. Science. 2004;305:1124. doi: 10.1126/science.1098876. - DOI - PubMed
    1. Ariey F, et al. A molecular marker of artemisinin-resistant Plasmodium falciparum malaria. Nature. 2014;505:50–55. doi: 10.1038/nature12876. - DOI - PMC - PubMed
    1. Wellems TE, Plowe CV. Chloroquine-resistant malaria. J. Infect. Dis. 2001;184:770–776. doi: 10.1086/322858. - DOI - PubMed
    1. Su X, Kirkman LA, Fujioka H, Wellems TE. Complex polymorphisms in an approximately 330 kDa protein are linked to chloroquine-resistant P. falciparum in Southeast Asia and Africa. Cell. 1997;91:593–603. doi: 10.1016/S0092-8674(00)80447-X. - DOI - PubMed

Publication types

MeSH terms