. 2024 Mar;42(3):424-436.
doi: 10.1038/s41587-023-01783-y. Epub 2023 May 11.

A prime editor mouse to model a broad spectrum of somatic mutations in vivo

Affiliations

A prime editor mouse to model a broad spectrum of somatic mutations in vivo

Zackery A Ely et al. Nat Biotechnol. 2024 Mar.

Abstract

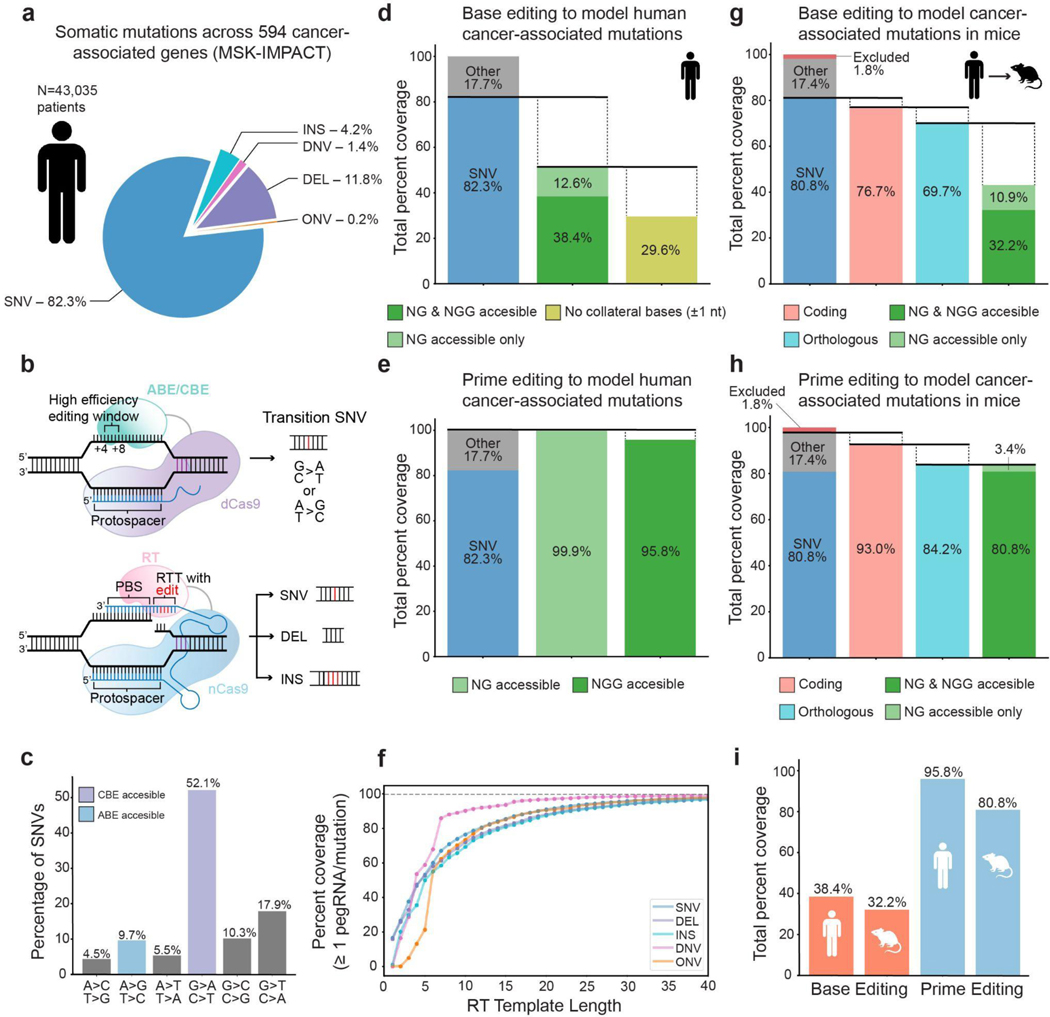
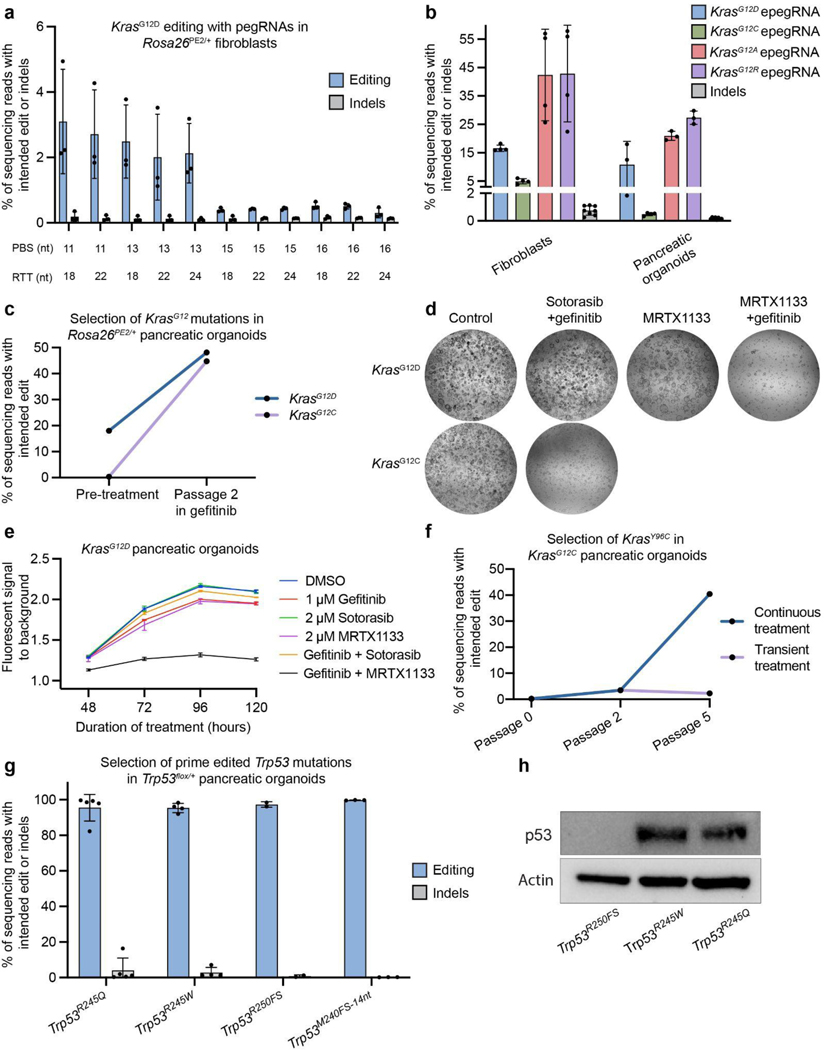
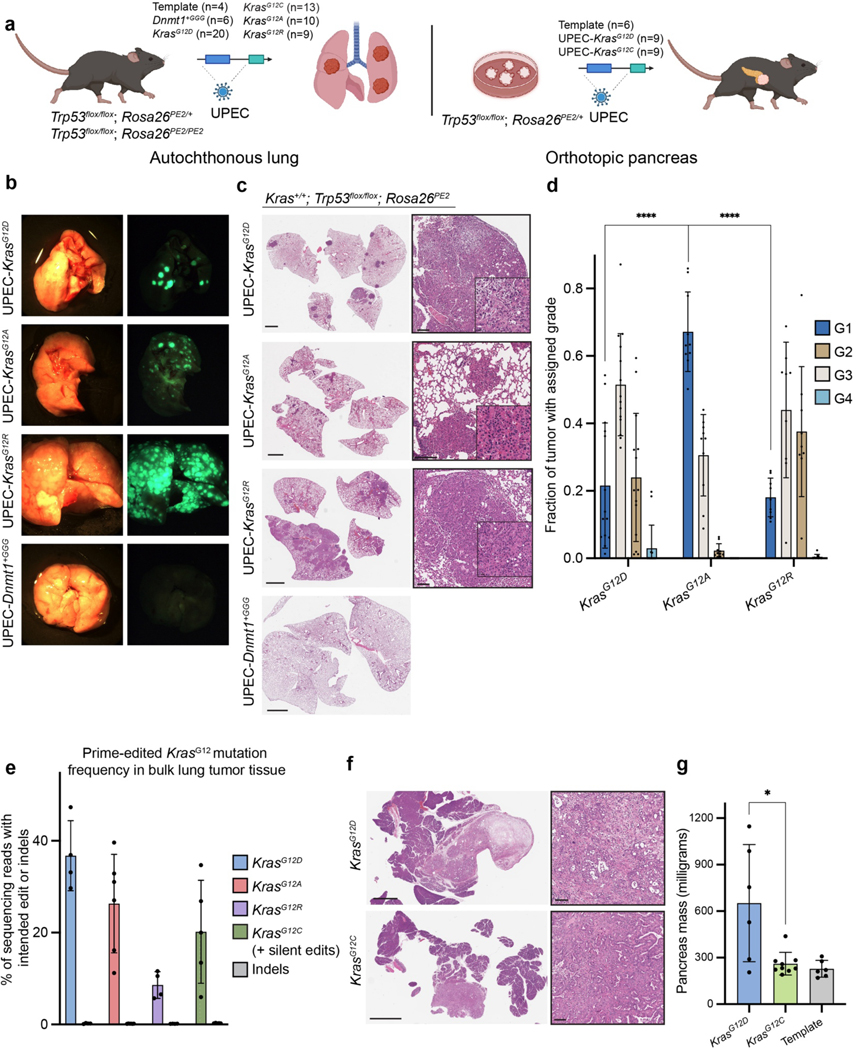
Genetically engineered mouse models only capture a small fraction of the genetic lesions that drive human cancer. Current CRISPR-Cas9 models can expand this fraction but are limited by their reliance on error-prone DNA repair. Here we develop a system for in vivo prime editing by encoding a Cre-inducible prime editor in the mouse germline. This model allows rapid, precise engineering of a wide range of mutations in cell lines and organoids derived from primary tissues, including a clinically relevant Kras mutation associated with drug resistance and Trp53 hotspot mutations commonly observed in pancreatic cancer. With this system, we demonstrate somatic prime editing in vivo using lipid nanoparticles, and we model lung and pancreatic cancer through viral delivery of prime editing guide RNAs or orthotopic transplantation of prime-edited organoids. We believe that this approach will accelerate functional studies of cancer-associated mutations and complex genetic combinations that are challenging to construct with traditional models.


Conflict of interest statement

Declaration of Interests:

T.J. is a member of the Board of Directors of Amgen and Thermo Fisher Scientific, and a co-Founder of Dragonfly Therapeutics and T2 Biosystems. T.J. serves on the Scientific Advisory Board of Dragonfly Therapeutics, SQZ Biotech, and Skyhawk Therapeutics. T.J. is also the President of Break Through Cancer. None of these affiliations represent a conflict of interest with respect to the design or execution of this study or interpretation of data presented in this manuscript. His laboratory currently receives funding from the Johnson & Johnson Lung Cancer Initiative, but this funding did not support the research described in this manuscript. D.R.L. is a consultant for Prime Medicine, Beam Therapeutics, Pairwise Plants, Chroma Medicine, and Nvelop Therapeutics, companies that use or deliver genome editing or genome engineering agents and owns equity in these companies. K.H. and A.V.A. are currently employees of Prime Medicine.

Figures

Figure 1.
Figure 1.
Quantification of human cancer-associated mutations amenable to modeling by base editing or prime editing in humans and mice. a. Distribution of somatic variant types in a cohort of 43,035 patients with 422,822 mutations observed in 594 cancer-associated genes. Single nucleotide variants = SNV, deletions = DEL, insertions = INS, di-nucleotide variants = DNV, oligo-nucleotide variants = ONV. b. Schematic of the modeling capabilities of base editing (top) and prime editing (bottom). c. Quantification of somatic SNVs by type, illustrating enrichment for transition SNVs. Transition SNVs amenable to modeling by cytosine base editors (CBE) are shown in purple, while transition SNVs amenable to modeling by adenine base editors (ABE) are shown in blue. Transversions are shown in gray. d. Quantification of mutations amenable to modeling with cytosine or adenine base editors that use an NG or NGG PAM. All percentages are given as a percentage of all mutations in the dataset. 38.4% of all mutations are amenable to base editing and fall within the protospacer of an NGG PAM (dark green), while an additional 12.6% of all mutations are amenable to base editing and fall within an NG PAM protospacer (light green). Of this subset of mutations that fall within either an NG or NGG PAM protospacer, only ~60%, or 29.6% of all mutations, lack matching collateral bases within one nucleotide (nt) of the mutation site. e. 95.8% of all mutations in the dataset are potentially amenable to modeling by a prime editor using an NGG PAM (dark green) coupled with a pegRNA with a reverse transcription (RT) template length of 30 nucleotides. 99.9% of all mutations can be modeled by a prime editor using an NG PAM with the same pegRNA specifications. f. Percentage of mutations with at least one suitable pegRNA as a function of the RT template length of the pegRNA, excluding the additional length of a homologous region in the RT template. Calculations assume the prime editor recognizes an NGG PAM. g. Quantification of orthologous coding mutations potentially amenable to modeling by base editing in mice. Mutations are defined as orthologous if they derive from a wild-type amino acid conserved in the murine ortholog, as determined by pairwise protein alignment between human and mouse protein sequences. The rightmost bar indicates the fraction of orthologous coding mutations that can be modeled by base editors that recognize NG or NGG PAMs. “Excluded mutations” refers to mutations that fall in a gene lacking an ortholog. All percentages are given as a percentage of all mutations in the dataset. h. Quantification of orthologous coding mutations potentially amenable to modeling by prime editing. Orthologous mutations are defined as in Fig. 1g. The rightmost bar indicates the ability of an NG or NGG prime editor to model these orthologous mutations, assuming an RT template greater than 30 nt. Excluded mutations are defined as in Fig. 1g. i. Summary of the cancer mutation modeling capabilities of base and prime editing assuming an NGG PAM.
Figure 2.
Figure 2.
Design and functional validation of the Rosa26PE2 prime editor allele. a. Schematic depicting the design of the Cre-inducible Rosa26PE2 allele. b. Schematic depicting the formation of hU6-pegRNA-EF-1α-Cre (UPEC) and hU6-pegRNA-EFS-mScarlet (UPEmS) vectors from templates encoding a red fluorescent protein (RFP) by Golden Gate assembly. c. Bright-field images of pancreatic organoids derived from chimeric prime editor mice and wild-type mice. With and without treatment with neomycin. d. Bright-field and fluorescent images showing PE2-P2A-mNG expression only after exposure to Cre encoded by a UPEC vector. e. Schematic depicting the derivation of multiple organoids and a fibroblast cell line from Rosa26PE2/+ prime editor mice. f. Editing efficiency of a trinucleotide (+GGG) insertion located eight base pairs downstream of the start codon in Dnmt1 in pancreatic organoids, lung organoids, and tail tip-derived fibroblasts. Unintended indel byproducts in all conditions were present in <1% of sequencing reads. Data and error bars indicate the mean and standard deviation of three independent transductions. g. Editing efficiency and indel byproduct frequency of Dnmt1+GGG in liver tissue one week after tail vein injection with LNPs harboring either Cre mRNA and pegRNA (left) or pegRNA alone (right). Data and error bars indicate the mean and standard deviation of three to five independent mice. h. Bright-field and fluorescent images of pancreases derived from Rosa26PE2/+ (left) or Pdx-1 Cre;Rosa26PE2/+ mice (right). i. Immunofluorescence imaging of intestinal tissue derived from Villin-CreERT2; Rosa26PE2/+ mice that were either untreated (left) or exposed to tamoxifen (right; 4-OHT). Tissue slides were stained with the DNA stain DAPI (4′,6-diamidino-2-phenylindole; top) or with an antibody specific to Cas9 (bottom). Scale bar indicates 100 μm.
Figure 3.
Figure 3.
Ex vivo prime editing and functional testing of Kras and Trp53 mutations. a. Editing efficiency and indel byproduct frequency of the KrasG12D transition mutation (G:C to A:T) templated by a cohort of pegRNAs based on a single Cas9 spacer (n = 3 for each pegRNA). pegRNAs are delineated by differences in the lengths of the primer binding site (PBS) and reverse transcriptase template (RTT). Data and error bars indicate the mean and standard deviation of three independent transductions. b. Editing activity of four engineered pegRNAs (epegRNAs) templating either the KrasG12D transition or the KrasG12C, KrasG12A, or KrasG12R transversions in tail tip-derived fibroblasts or pancreatic organoids (KrasG12D and KrasG12C). Data and error bars indicate the mean and standard deviation of three independent transductions. epegRNAs were generated by appending the trimmed evopreQ1 motif after the primer binding site of the leftmost pegRNA depicted in Fig. 1a. Indel byproduct calculations were pooled from all conditions within each tissue. c. Allele frequencies of KrasG12D or KrasG12C mutations in pancreatic organoids before and after two passages of treatment with gefitinib (1 μM) (n = 1). Gefitinib treatment selects for cells containing prime edited KrasG12D or KrasG12C mutations. d. Bright-field images of prime edited KrasG12C or KrasG12D organoids treated for four days with either control DMSO, sotorasib (2 μM) and gefitinib (1 μM), MRTX1133 (5 μM), or MRTX1133 and gefitinib. e. Viability of KrasG12D pancreatic organoids under various treatment conditions. Viability was quantified using the alamarBlue HS Cell Viability Reagent, which is metabolized into a fluorescent derivative in living cells. Bars represent the range across two independent replicates. f. Allele frequency of KrasY96C in KrasG12C organoids during and after treatment with sotorasib (2 μM) and gefitinib (n = 1). After two passages, organoids were split into two groups, which included continued treatment (continuous treatment) in one group and removal of treatment in a second group (transient treatment). g. Allele frequencies of three Trp53 mutations in Trp53flox/+ pancreatic organoids treated with nutlin-3a for three to five passages after transduction with UPEC vectors. Indel byproduct frequencies are also included. Note that the highest indel frequency depicted for Trp53R245W derives primarily from a scaffold insertion in a single replicate. Trp53R245Q and Trp53R245W are homologous to mutations commonly observed in pancreatic cancer patients (TP53R248Q and TP53R248W), as described in Supplementary Figure 8. Trp53R250FS denotes a dinucleotide deletion that induces a frameshift mutation. Trp53M240FS−14nt denotes a fourteen-nucleotide deletion. Data and error bars indicate the mean and standard deviation of two to five independent transductions. h. Immunoblot indicating detectable levels of p53 protein in prime edited Trp53flox/R245Q and Trp53flox/R245W organoids and an absence of detectable protein in Trp53flox/R250FS organoids.
Figure 4.
Figure 4.
PE GEMMs enable autochthonous and orthotopic modeling of lung and pancreatic cancer. a. Schematic depicting the design of in vivo experiments. Autochthonous lung tumors were initiated with lentivirus encoding UPEC vectors. Pancreatic tumors were initiated by orthotopic transplantation of prime edited pancreatic organoids. “Template” refers to the template UPEC vector lacking a pegRNA. b. Representative bright-field and fluorescent images of lungs derived from mice infected with the UPEC vector encoding the neutral Dnmt1+GGG pegRNA, KrasG12D, KrasG12A, KrasG12R epegRNAs described in Fig. 3b. c. Hematoxylin and eosin (H&E) staining of representative tissue from a control mouse infected with UPEC-Dnmt1+GGG (bottom), and tumor-bearing mice infected with UPEC-KrasG12D, UPEC-KrasG12A, and UPEC-KrasG12R (top). Callout boxes highlight histopathology consistent with lung adenoma and adenocarcinoma. Scale bars indicate 2 mm, 100 μm, and 20 μm respectively. d. Bar charts indicating the distribution of grades across 16-week lesions from UPEC-KrasG12D (n = 14 mice), UPEC-KrasG12A (n = 10 mice), UPEC-KrasG12R (n = 9 mice). Lesion grades were called using the Aiforia algorithm as described in Methods. Data and error bars indicate the mean and standard deviation of all biological replicates in each condition. Statistical significance was calculated using unpaired, two-tailed t-tests comparing the fraction of Grade 1 lesions in KrasG12A-driven tumor tissue to KrasG12D-driven tumor tissue (P < 0.0001) or KrasG12R-driven tumor tissue (P < 0.0001). e. Allele frequencies of KrasG12D, KrasG12A, KrasG12R (16 weeks) and KrasG12C + silent edits (12 weeks) in bulk lung tumors. Indel byproduct frequency was calculated as <1% in all cases. f. H&E staining of representative pancreatic adenocarcinomas from a mouse transplanted with KrasG12D organoids (top) and a mouse transplanted with KrasG12C organoids (bottom). Scale bars indicate 2 mm, 25 μm, respectively. g. Mass of pancreata of organoid transplant recipients measured in milligrams (n = 6–9 mice). Pancreata bearing KrasG12D-driven tumors were significantly larger than those bearing KrasG12C-driven tumors. Statistical significance was calculated using a two-tailed Mann-Whitney U test (P = 0.036).

References

    1. Vogelstein B. et al. Cancer Genome Landscapes. Science 339, 1546–1558 (2013). - PMC - PubMed
    1. Garraway LA & Lander ES Lessons from the cancer genome. Cell 153, 17–37 (2013). - PubMed
    1. Hyman DM, Taylor BS & Baselga J. Implementing Genome-Driven Oncology. Cell 168, 584–599 (2017). - PMC - PubMed
    1. Chang MT et al. Accelerating Discovery of Functional Mutant Alleles in Cancer. Cancer Discov 8, 174–183 (2018). - PMC - PubMed
    1. Hong DS et al. KRASG12C Inhibition with Sotorasib in Advanced Solid Tumors. New England Journal of Medicine 383, 1207–1217 (2020). - PMC - PubMed

Substances