. 2023 Oct;12(27):e2301194.
doi: 10.1002/adhm.202301194. Epub 2023 May 21.

Organic Electronic Platform for Real-Time Phenotypic Screening of Extracellular-Vesicle-Driven Breast Cancer Metastasis

Affiliations

Organic Electronic Platform for Real-Time Phenotypic Screening of Extracellular-Vesicle-Driven Breast Cancer Metastasis

Walther C Traberg et al. Adv Healthc Mater. 2023 Oct.

Abstract

Tumor-derived extracellular vesicles (TEVs) induce the epithelial-to-mesenchymal transition (EMT) in nonmalignant cells to promote invasion and cancer metastasis, representing a novel therapeutic target in a field severely lacking in efficacious antimetastasis treatments. However, scalable technologies that allow continuous, multiparametric monitoring for identifying metastasis inhibitors are absent. Here, the development of a functional phenotypic screening platform based on organic electrochemical transistors (OECTs) for real-time, noninvasive monitoring of TEV-induced EMT and screening of antimetastatic drugs is reported. TEVs derived from the triple-negative breast cancer cell line MDA-MB-231 induce EMT in nonmalignant breast epithelial cells (MCF10A) over a nine-day period, recapitulating a model of invasive ductal carcinoma metastasis. Immunoblot analysis and immunofluorescence imaging confirm the EMT status of TEV-treated cells, while dual optical and electrical readouts of cell phenotype are obtained using OECTs. Further, heparin, a competitive inhibitor of cell surface receptors, is identified as an effective blocker of TEV-induced EMT. Together, these results demonstrate the utility of the platform for TEV-targeted drug discovery, allowing for facile modeling of the transient drug response using electrical measurements, and provide proof of concept that inhibitors of TEV function have potential as antimetastatic drug candidates.

Keywords: breast cancer metastasis; drug screening; exosomes; extracellular vesicles; organic electronics.


Conflict of interest statement

The authors declare no conflict of interest.

Figures

Figure 1
Figure 1
A model to recapitulate invasive ductal carcinoma integrated with an OECT platform for monitoring TEV‐induced EMT. EMT has been implicated in the initiation of metastasis, as epithelial cells at the invasive front of carcinomas acquire migratory and invasive properties to break through the basement membrane and disseminate via circulation to form metastases in distal organs.[ 16 ] Postinternalization, recipient cells exhibit physiological changes associated with alterations of their transcriptome and proteome.[ 48 , 49 ] TEV exposure results in increased expression of several mesenchymal markers, including vimentin and TWIST1,[ 50 , 51 ] and decreased expression of epithelial markers, including reciprocal changes in E‐cadherin and N‐cadherin expression[ 48 ] – the so‐called cadherin switch. Functionally, TEVs enhance the migratory and invasive properties of recipient cells.[ 52 , 53 ] By integrating a highly relevant model of breast cancer metastasis associated EMT on OECTs, this malignant process can be monitored in real time with multiparametric readouts and the effect of TEV‐targeting drugs can be assessed.
Figure 2
Figure 2
EV physical and biochemical characterization. a) Immunoblots of MDA‐MB‐231 and HEK‐293 whole‐cell lysates and (T)EV samples. Proteins were separated on SDS‐PAGE gels and membranes were blotted with indicated antibodies. CD63: smeared band between 35–60 kDa (multiple glycosylated forms influence gel migration, therefore CD63 appears as a smear in the 30–60 kDa range, as expected[ 60 ]); CD9, predicted: 25 kDa; annexin A1, predicted: 38 kDa; calreticulin, predicted: 55 kDa (other bands may indicate presence of dimers and multimers). Unedited immunoblots are available in Figure S1 (Supporting Information). b) Concentration and size distribution, calculated by NTA, of EVs (mean ± s.e.m.; n = 2 per EV type), with peak particle sizes of 153 ± 5.1 and 112 ± 12.7 nm for MDA–TEVs and HEK–EVs, respectively. c) Representative negative stain TEM images of indicated EVs (n = 3). i) MDA–TEVs. Scale bar, 200 nm. ii) MDA–TEV with 20 nm gold nanoparticles conjugated via CD63 antibody (white arrow). Scale bar, 150 nm. iii) Close‐up of MDA–TEV. Scale bar, 100 nm. iv) Smaller MDA–TEVs. Scale bar, 100 nm. v) HEK–EVs. Scale bar, 200 nm. vi) Close‐up of HEK–EV. Scale bar, 100 nm.
Figure 3
Figure 3
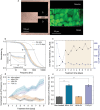
Real‐time, OECT‐based monitoring of EMT. a) Brightfield image of MCF10A cells on an OECT and zoomed‐in view of the channel with cells stained with calcein AM (green‐LIVE). The black boxes: source and drain electrodes; darkened area between them: PEDOT:PSS channel. b) Typical time evolution of the OECT frequency‐dependent response as cells grow and form a confluent layer under normal culture conditions (nontreated). Inset graph shows the evolution of the impedance for nontreated cells. c) Typical in‐line monitoring of the cutoff frequency, as derived from the transconductance versus frequency plot; and the cell layer resistance (R cell), as derived from the impedance versus frequency plot for nontreated cells. The vertical dotted line represents the baseline without cells on the device and the shaded area represents the equivalent treatment window. Representative cutoff frequency and R cell plots are available for all conditions in Figure S4 (Supporting Information). d) Cutoff frequency normalized to day 0 (treatment start day) over time for the four experimental conditions: nontreated; 200 µg MDA–TEVs; 185 µg HEK–EVs; and 10 ng mL−1 TGF‐β1 (mean ± s.e.m.; indicated by lightly colored areas; n = 3 and 2 for nontreated/MDA–TEV and TGF‐β1/HEK–EV, respectively; see the Experimental Section for explanation on calculation of EV dose). Data points before treatment day 0 are omitted for clarity. e) Normalized cutoff frequency on treatment day 9 compared across the four conditions (mean ± s.e.m.). Two‐way ANOVA. *** p ≤0.001.
Figure 4
Figure 4
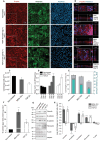
Biological validation of OECT‐based measurements to determine EMT status. a) Confocal images of MCF10A cells on treatment day 2. Cells were stained for F‐actin, vimentin, and nuclei. Insets show a close‐up of cells. Scale bars, 50 µm. b) Representative x/z and y/z orthogonal views (ortho‐views, right) of each cell layer in the OECT channel (treatment day 9), obtained by z‐stacked confocal images. PEDOT:PSS channel is indicated by white dotted lines. Cells were stained for F‐actin and nuclei. Scale bars, 50 µm. White arrows: cells with a rounded morphology. c) Cell density on treatment day 2 across conditions. Cell number was determined by counting cell nuclei from 5 frames (mean ± s.e.m.; n = 2). d) Normalized cutoff frequency from treatment day 0, 2, and 9 across conditions (mean ± s.e.m.; n = 3 and 2 for nontreated/MDA–TEV and TGF‐β1, respectively). e) Cell height in channel derived from orthogonal projections (mean ± s.e.m.; minimum 8 measurements taken from different x‐ and y‐positions; see Figure S8 and Videos S1–S3 in the Supporting Information) and the cell layer resistance measured in each specific channel as derived from impedance (Z) plots (n = 1). f) ELISA‐based N‐cadherin protein on treatment day 7 across conditions (mean ± s.e.m.; n = 1). g) Immunoblots of whole‐cell lysates collected on treatment day 9, probed with vimentin, E‐cadherin, N‐cadherin, fibronectin, F‐actin, and GADPH. Unedited blots are available in Figure S9 (Supporting Information). h) Quantitative values of protein expression derived from immunoblots presented as log2 fold‐change versus nontreated condition expression level (mean ± s.e.m.; n = 3). One‐way ANOVA: (c, e, and f); two‐way ANOVA: (d). * p ≤0.05, ** p ≤0.01, *** p ≤0.001.
Figure 5
Figure 5
OECT‐based phenotypic screening of heparin as a TEV‐targeting, anti‐EMT drug. a) Schematic showing the proposed mechanism by which heparin binds to spike glycoproteins to outcompete cell surface HSGPs and prevent TEV adhesion and uptake. b) Two‐factor factorial design to assess the effect of heparin treatment on MDA–EV‐induced EMT. c) Comparison of the normalized cutoff frequency on treatment day 9 between cells treated with MDA–TEVs in the absence (−) or presence (+) of heparin (mean ± s.e.m.; n = 3). d) Immunoblots of whole‐cell lysates collected at the end of the experiment. Equal quantities of protein were separated on SDS‐PAGE gels and membranes were blotted with indicated antibodies (same antibodies as listed in Figure 4). Unedited immunoblots are available in Figure S9 (Supporting Information). e) Quantitative values of protein expression derived from immunoblots presented as log2 fold‐change versus nontreated expression level (mean ± s.e.m.; n = 3). f) Asymptotic regression model fitted to the drug response cutoff frequency data points. g) Cells were treated with heparin between days 0 and 3 (green colored area) while being exposed to MDA–TEVs. Washing with PBS and subsequently exposing cells to MDA–TEVs lead to an increase in cutoff frequency (dark blue colored area). Data points before treatment day 0 are omitted for clarity (mean ± s.e.m.; s.e.m. indicated by lightly colored areas; n = 2 and 3 for the transient heparin treatment condition (dark blue data points) and MDA–TEV (+/−) heparin (red and light blue data points), respectively). Two‐way ANOVA. * p ≤0.05, ** p ≤0.01, *** p ≤0.001.

References

    1. Fares J., Fares M. Y., Khachfe H. H., Salhab H. A., Fares Y., Signal Transduction Targeted Ther. 2020, 5, 28. - PMC - PubMed
    1. Wouters O. J., Mckee M., Luyten J., JAMA, J. Am. Med. Assoc. 2020, 323, 844. - PMC - PubMed
    1. Wong C. H., Siah K. W., Lo A. W., Biostatistics 2019, 20, 273. - PMC - PubMed
    1. Harrison R. K., Nat. Rev. Drug Discovery 2016, 15, 817. - PubMed
    1. Gui P., Bivona T. G., Trends Cancer 2022, 8, 98. - PubMed

Publication types

MeSH terms