

Delayed post gadolinium MRI descriptors for Meniere's disease: a systematic review and meta-analysis
- PMID: 37171493
- PMCID: PMC10511628
- DOI: 10.1007/s00330-023-09651-8
Delayed post gadolinium MRI descriptors for Meniere's disease: a systematic review and meta-analysis
Abstract
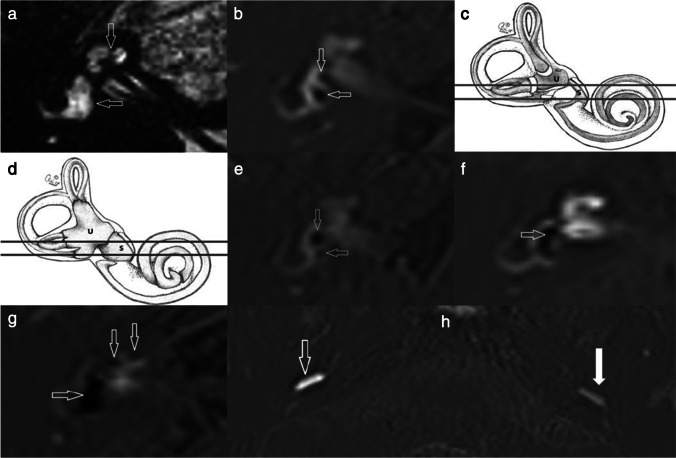
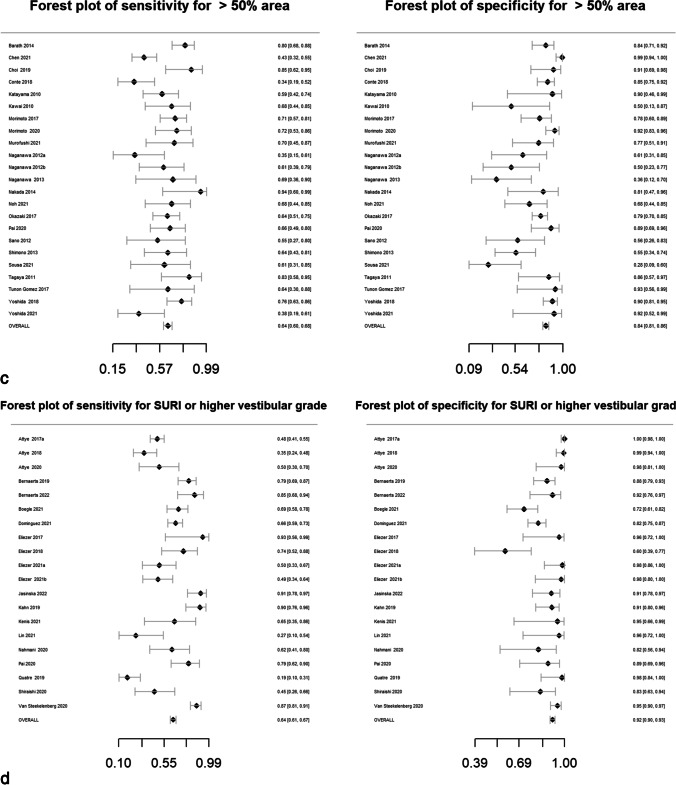
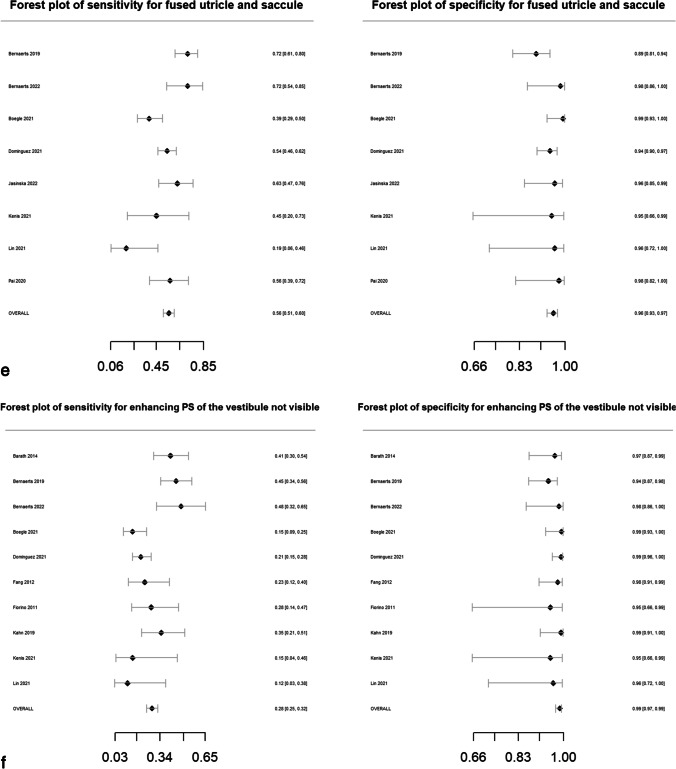
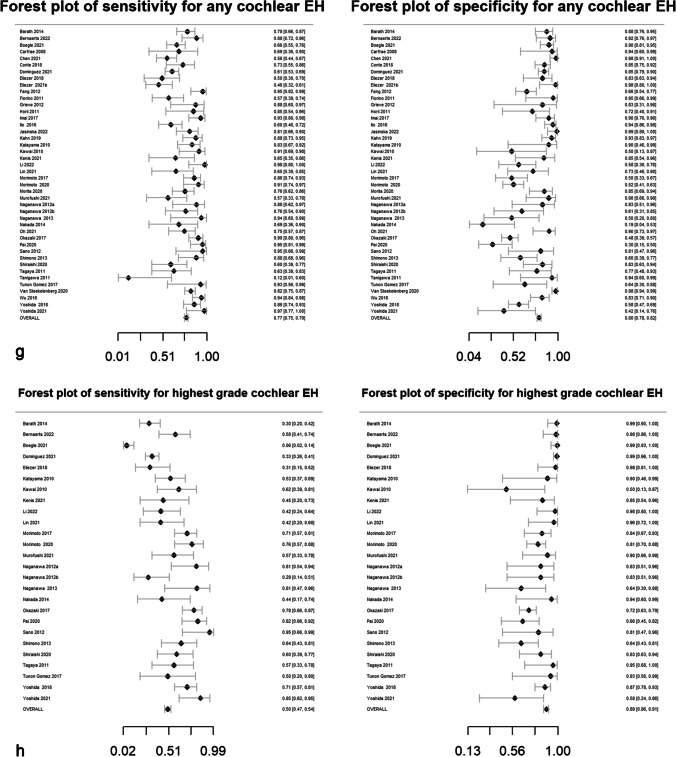
Objectives: Delayed post-gadolinium magnetic resonance imaging (MRI) detects changes of endolymphatic hydrops (EH) within the inner ear in Meniere's disease (MD). A systematic review with meta-analysis was conducted to summarise the diagnostic performance of MRI descriptors across the range of MD clinical classifications.
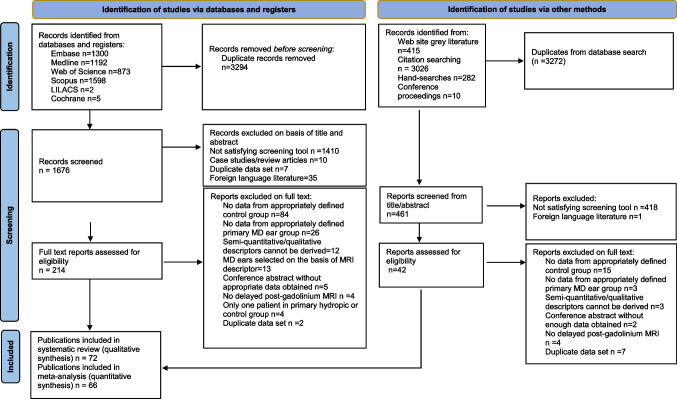
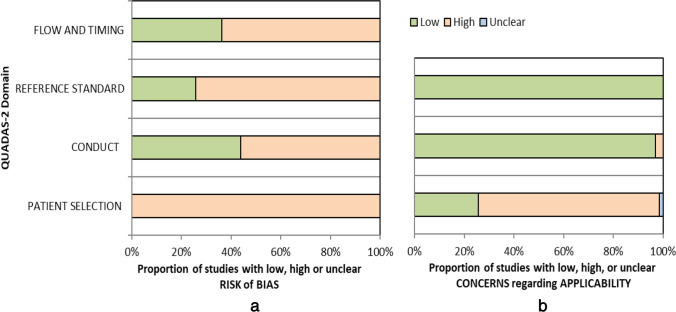
Materials and methods: Case-controlled studies documenting the diagnostic performance of MRI descriptors in distinguishing MD ears from asymptomatic ears or ears with other audio-vestibular conditions were identified (MEDLINE, EMBASE, Web of Science, Scopus databases: updated 17/2/2022). Methodological quality was evaluated with Quality Assessment of Diagnostic Accuracy Studies version 2. Results were pooled using a bivariate random-effects model for evaluation of sensitivity, specificity and diagnostic odds ratio (DOR). Meta-regression evaluated sources of heterogeneity, and subgroup analysis for individual clinical classifications was performed.
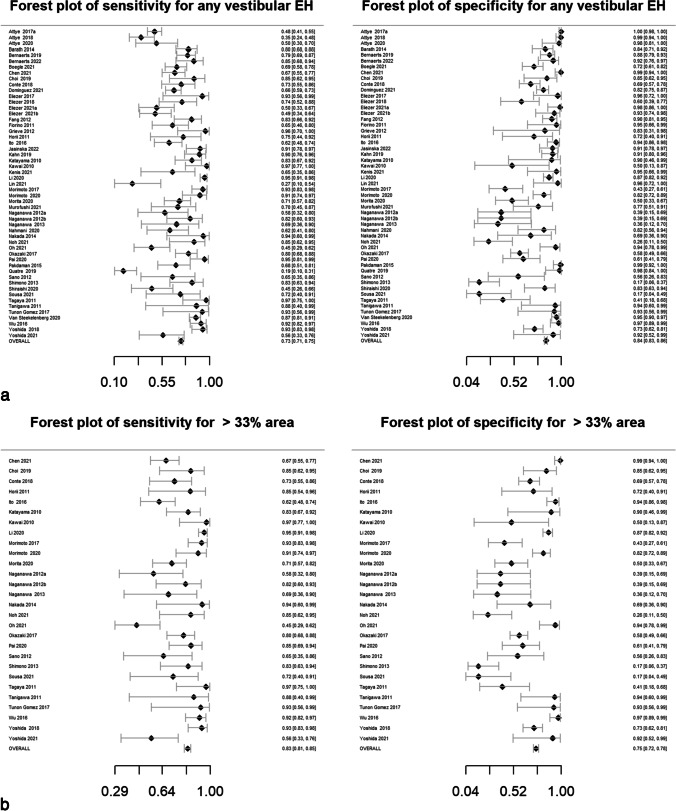
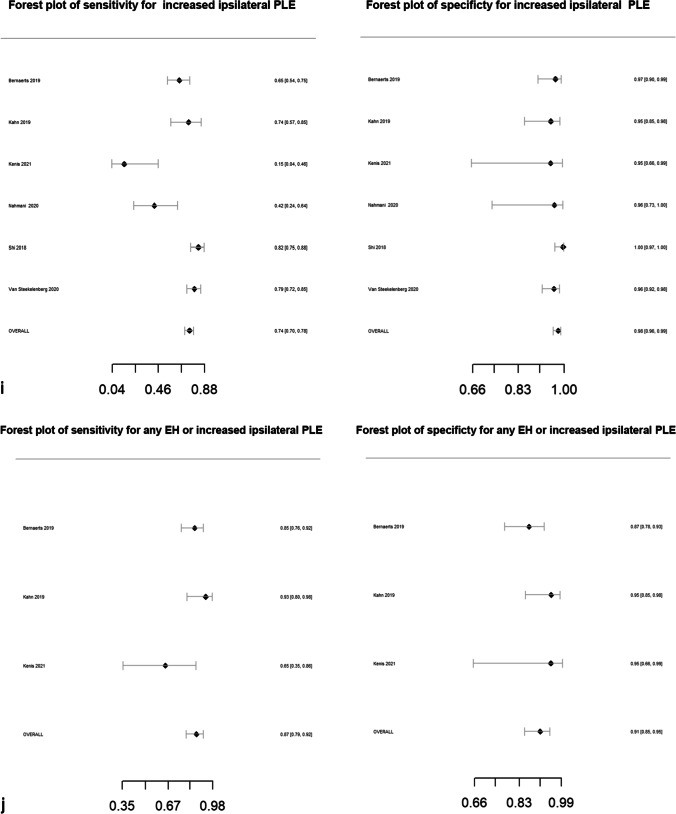
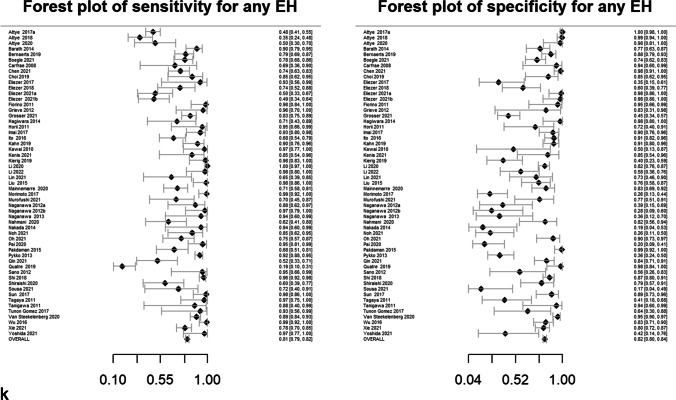
Results: The meta-analysis included 66 unique studies and 3073 ears with MD (mean age 40.2-67.2 years), evaluating 11 MRI descriptors. The combination of increased perilymphatic enhancement (PLE) and EH (3 studies, 122 MD ears) achieved the highest sensitivity (87% (95% CI: 79.92%)) whilst maintaining high specificity (91% (95% CI: 85.95%)). The diagnostic performance of "high grade cochlear EH" and "any EH" descriptors did not significantly differ between monosymptomatic cochlear MD and the latest reference standard for definite MD (p = 0.3; p = 0.09). Potential sources of bias were case-controlled design, unblinded observers and variable reference standard, whilst differing MRI techniques introduced heterogeneity.
Conclusions: The combination of increased PLE and EH optimised sensitivity and specificity for MD, whilst some MRI descriptors also performed well in diagnosing monosymptomatic cochlear MD.
Key points: • A meta-analysis of delayed post-gadolinium magnetic resonance imaging (MRI) for the diagnosis of Meniere's disease is reported for the first time and comprised 66 studies (3073 ears). • Increased enhancement of the perilymphatic space of the inner ear is shown to be a key MRI feature for the diagnosis of Meniere's disease. • MRI diagnosis of Meniere's disease can be usefully applied across a range of clinical classifications including patients with cochlear symptoms alone.
Keywords: Ear, inner; Endolymphatic hydrops; Gadolinium; Magnetic resonance imaging; Odds ratio.
© 2023. Crown.
Conflict of interest statement
SEJ Connor is a member of the European Radiology Advisory Editorial Board. He has not taken part in the review or selection process of this article.
The remaining authors of this manuscript declare no relationships with any companies, whose products or services may be related to the subject matter of the article.
Figures
References
-
- Havia M, Kentala E, PyykkÖ I (2005) Prevalence of Menière’s disease in general population of Southern Finland. Otolaryngol Head Neck Surg 133(5):762–768 - PubMed
-
- Committee on Hearing and Equilibrium (1972) Report of Subcommittee on Equilibrium and its Measurement .Meniere’s disease: criteria for diagnosis and evaluation of therapy for reporting. Trans Am Acad Ophthalmol Otolaryngol 76 6 1462–4 - PubMed
-
- Pearson BW, Brackmann DE (1985) Committee on Hearing and Equilibrium Guidelines for Reporting Treatment Results in Meniere’s Disease. Otolaryngol Head Neck Surg 6;93(5):579–81 - PubMed
-
- Committee on Hearing and Equilibrium Guidelines for the Diagnosis and Evaluation of Therapy in Meniere’s Disease (1995) Otolaryngol Head Neck Surg 113(3):181–5. - PubMed
-
- Ikezono T, Itoh A, Takeda N, Nakamura T, Asai M, Ikeda T. Documents for standards in diagnostic criteria for dizziness. Equilibrium Res. 2017;76:233–241.
Publication types
MeSH terms
Substances
Grants and funding
LinkOut - more resources
Full Text Sources
Medical
