Single-cell molecular profiling using ex vivo functional readouts fuels precision oncology in glioblastoma
- PMID: 37171617
- PMCID: PMC11071868
- DOI: 10.1007/s00018-023-04772-1
Single-cell molecular profiling using ex vivo functional readouts fuels precision oncology in glioblastoma
Abstract
Background: Functional profiling of freshly isolated glioblastoma (GBM) cells is being evaluated as a next-generation method for precision oncology. While promising, its success largely depends on the method to evaluate treatment activity which requires sufficient resolution and specificity.
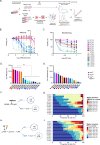
Methods: Here, we describe the 'precision oncology by single-cell profiling using ex vivo readouts of functionality' (PROSPERO) assay to evaluate the intrinsic susceptibility of high-grade brain tumor cells to respond to therapy. Different from other assays, PROSPERO extends beyond life/death screening by rapidly evaluating acute molecular drug responses at single-cell resolution.
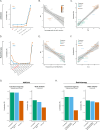
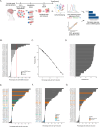
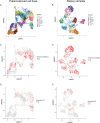
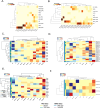
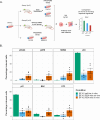
Results: The PROSPERO assay was developed by correlating short-term single-cell molecular signatures using mass cytometry by time-of-flight (CyTOF) to long-term cytotoxicity readouts in representative patient-derived glioblastoma cell cultures (n = 14) that were exposed to radiotherapy and the small-molecule p53/MDM2 inhibitor AMG232. The predictive model was subsequently projected to evaluate drug activity in freshly resected GBM samples from patients (n = 34). Here, PROSPERO revealed an overall limited capacity of tumor cells to respond to therapy, as reflected by the inability to induce key molecular markers upon ex vivo treatment exposure, while retaining proliferative capacity, insights that were validated in patient-derived xenograft (PDX) models. This approach also allowed the investigation of cellular plasticity, which in PDCLs highlighted therapy-induced proneural-to-mesenchymal (PMT) transitions, while in patients' samples this was more heterogeneous.
Conclusion: PROSPERO provides a precise way to evaluate therapy efficacy by measuring molecular drug responses using specific biomarker changes in freshly resected brain tumor samples, in addition to providing key functional insights in cellular behavior, which may ultimately complement standard, clinical biomarker evaluations.
Keywords: Ex vivo treatment; Functional diagnostics; Glioblastoma; Precision medicine; Single-cell.
© 2023. The Author(s), under exclusive licence to Springer Nature Switzerland AG.
Conflict of interest statement
Authors declare that they have no competing interests.
Figures

Similar articles
-
Rapid identification and validation of novel targeted approaches for Glioblastoma: A combined ex vivo-in vivo pharmaco-omic model.Exp Neurol. 2018 Jan;299(Pt B):281-288. doi: 10.1016/j.expneurol.2017.09.006. Epub 2017 Sep 18. Exp Neurol. 2018. PMID: 28923369 Review.
-
Combination therapy in a xenograft model of glioblastoma: enhancement of the antitumor activity of temozolomide by an MDM2 antagonist.J Neurosurg. 2017 Feb;126(2):446-459. doi: 10.3171/2016.1.JNS152513. Epub 2016 May 13. J Neurosurg. 2017. PMID: 27177180 Free PMC article.
-
PDIA3P1 promotes Temozolomide resistance in glioblastoma by inhibiting C/EBPβ degradation to facilitate proneural-to-mesenchymal transition.J Exp Clin Cancer Res. 2022 Jul 15;41(1):223. doi: 10.1186/s13046-022-02431-0. J Exp Clin Cancer Res. 2022. PMID: 35836243 Free PMC article.
-
Biobanked Glioblastoma Patient-Derived Organoids as a Precision Medicine Model to Study Inhibition of Invasion.Int J Mol Sci. 2021 Oct 3;22(19):10720. doi: 10.3390/ijms221910720. Int J Mol Sci. 2021. PMID: 34639060 Free PMC article.
-
Current status of precision oncology in adult glioblastoma.Mol Oncol. 2024 Dec;18(12):2927-2950. doi: 10.1002/1878-0261.13678. Epub 2024 Jun 20. Mol Oncol. 2024. PMID: 38899374 Free PMC article. Review.
Cited by
-
Patient-derived xenograft model in cancer: establishment and applications.MedComm (2020). 2025 Jan 19;6(2):e70059. doi: 10.1002/mco2.70059. eCollection 2025 Feb. MedComm (2020). 2025. PMID: 39830019 Free PMC article. Review.
-
Machine learning and multi-omics analysis reveal key regulators of proneural-mesenchymal transition in glioblastoma.Sci Rep. 2025 Jun 5;15(1):19731. doi: 10.1038/s41598-025-04862-z. Sci Rep. 2025. PMID: 40473799 Free PMC article.
References
-
- Verhaak RGW, Hoadley KA, Purdom E, Wang V, Qi Y, Wilkerson MD, Miller CR, Ding L, Golub T, Mesirov JP, et al. Integrated genomic analysis identifies clinically relevant subtypes of glioblastoma characterized by abnormalities in PDGFRA, IDH1, EGFR, and NF1. Cancer Cell. 2010;17:98–110. doi: 10.1016/j.ccr.2009.12.020. - DOI - PMC - PubMed
-
- Brennan CW, Verhaak RGW, McKenna A, Campos B, Noushmehr H, Salama SR, Zheng S, Chakravarty D, Sanborn JZ, Berman SH, Beroukhim R, Bernard B, Wu C-J, Genovese G, Shmulevich I, et al. The somatic genomic landscape of glioblastoma. Cell. 2013;155:462–477. doi: 10.1016/j.cell.2013.09.034. - DOI - PMC - PubMed
MeSH terms
Substances
Grants and funding
LinkOut - more resources
Full Text Sources
Medical
Research Materials
Miscellaneous

