

Foliar functional and genetic variation in a keystone Hawaiian tree species estimated through spectroscopy
- PMID: 37171625
- PMCID: PMC10229453
- DOI: 10.1007/s00442-023-05374-1
Foliar functional and genetic variation in a keystone Hawaiian tree species estimated through spectroscopy
Abstract
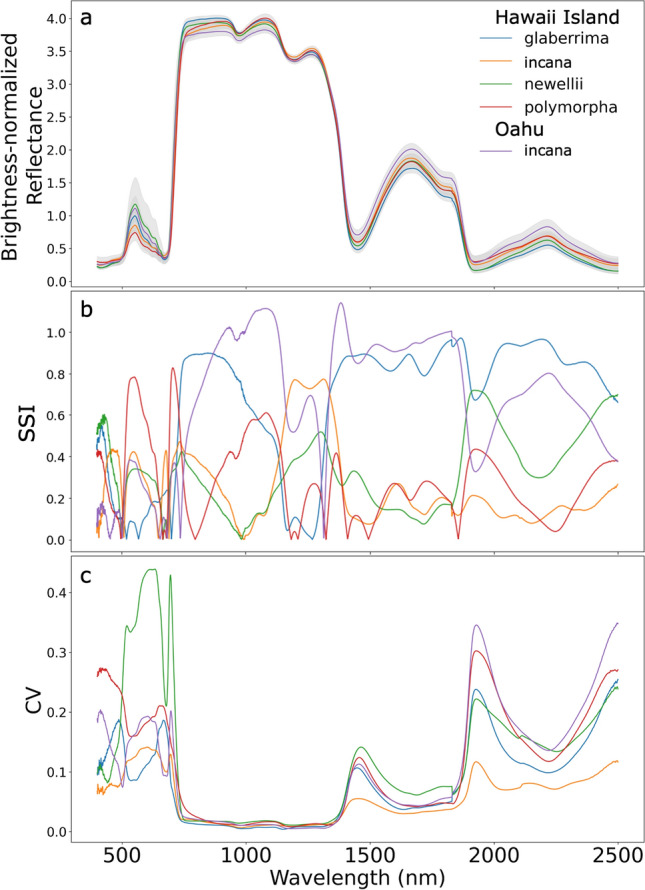
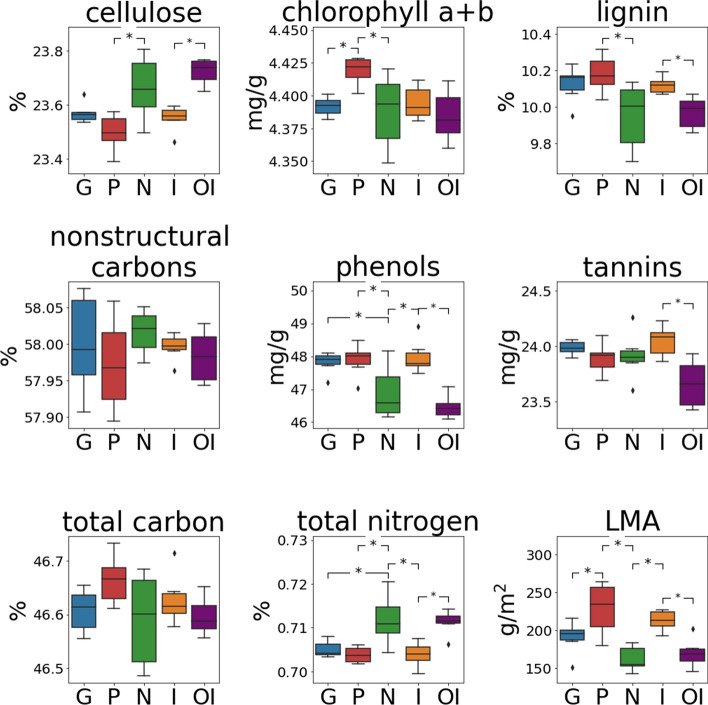
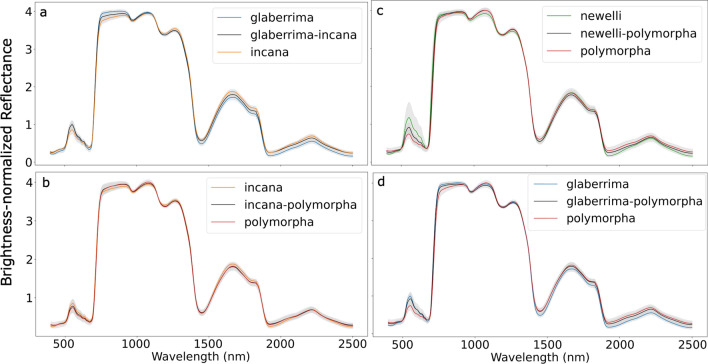
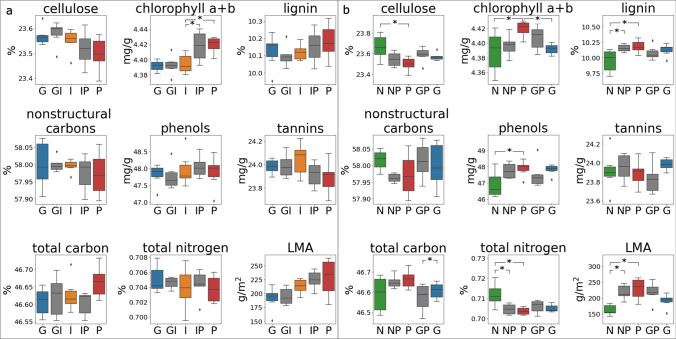
Imaging spectroscopy has the potential to map closely related plant taxa at landscape scales. Although spectral investigations at the leaf and canopy levels have revealed relationships between phylogeny and reflectance, understanding how spectra differ across, and are inherited from, genotypes of a single species has received less attention. We used a common-garden population of four varieties of the keystone canopy tree, Metrosideros polymorpha, from Hawaii Island and four F1-hybrid genotypes derived from controlled crosses to determine if reflectance spectra discriminate sympatric, conspecific varieties of this species and their hybrids. With a single exception, pairwise comparisons of leaf reflectance patterns successfully distinguished varieties of M. polymorpha on Hawaii Island as well as populations of the same variety from different islands. Further, spectral variability within a single variety from Hawaii Island and the older island of Oahu was greater than that observed among the four varieties on Hawaii Island. F1 hybrids most frequently displayed leaf spectral patterns intermediate to those of their parent taxa. Spectral reflectance patterns distinguished each of two of the hybrid genotypes from one of their parent varieties, indicating that classifying hybrids may be possible, particularly if sample sizes are increased. This work quantifies a baseline in spectral variability for an endemic Hawaiian tree species and advances the use of imaging spectroscopy in biodiversity studies at the genetic level.
Keywords: Genetic diversity; Hawaii; Leaf spectra; Metrosideros polymorpha; Plant evolution; Spectroscopy.
© 2023. The Author(s).
Conflict of interest statement
The authors declare no conflict of interest.
Figures
Similar articles
-
Incipient radiation within the dominant Hawaiian tree Metrosideros polymorpha.Heredity (Edinb). 2014 Oct;113(4):334-42. doi: 10.1038/hdy.2014.47. Epub 2014 May 14. Heredity (Edinb). 2014. PMID: 24824285 Free PMC article.
-
Divergence within and among 3 varieties of the endemic tree, 'Ohi'a Lehua (Metrosideros polymorpha) on the eastern slope of Hawai'i Island.J Hered. 2013 Jul-Aug;104(4):449-58. doi: 10.1093/jhered/est027. Epub 2013 May 2. J Hered. 2013. PMID: 23640992
-
Varieties of the highly dispersible and hypervariable tree, Metrosideros polymorpha, differ in response to mechanical stress and light across a sharp ecotone.Am J Bot. 2019 Aug;106(8):1106-1115. doi: 10.1002/ajb2.1331. Epub 2019 Jul 22. Am J Bot. 2019. PMID: 31330066
-
Molecular biogeography and diversification of the endemic terrestrial fauna of the Hawaiian Islands.Philos Trans R Soc Lond B Biol Sci. 2008 Oct 27;363(1508):3363-76. doi: 10.1098/rstb.2008.0061. Philos Trans R Soc Lond B Biol Sci. 2008. PMID: 18765363 Free PMC article. Review.
-
Speciation and phylogeography of Hawaiian terrestrial arthropods.Mol Ecol. 1998 Apr;7(4):519-31. doi: 10.1046/j.1365-294x.1998.00309.x. Mol Ecol. 1998. PMID: 9628003 Review.
Cited by
-
Spectral biology across scales in changing environments.Ecology. 2025 Jul;106(7):e70078. doi: 10.1002/ecy.70078. Ecology. 2025. PMID: 40685754 Free PMC article. Review.
-
Hyperspectral Leaf Reflectance Detects Interactive Genetic and Environmental Effects on Tree Phenotypes, Enabling Large-Scale Monitoring and Restoration Planning Under Climate Change.Plant Cell Environ. 2025 Mar;48(3):1842-1857. doi: 10.1111/pce.15263. Epub 2024 Nov 4. Plant Cell Environ. 2025. PMID: 39497286 Free PMC article.
References
-
- Aravanopoulos FA, Zsuffa L. Heterozygosity and biomass production in Salix eriocephala. Heredity. 1998 doi: 10.1046/j.1365-2540.1998.00409.x. - DOI
-
- Asner GP, Martin RE. Spectral and chemical analysis of tropical forests: scaling from leaf to canopy levels. Remote Sens Environ. 2008;112(10):3958–3970. doi: 10.1016/j.rse.2008.07.003. - DOI
-
- Asner GP, Martin RE, Anderson CB, Knapp DE. Quantifying forest canopy traits: imaging spectroscopy versus field survey. Remote Sens Environ. 2015;158:15–27. doi: 10.1016/j.rse.2014.11.011. - DOI
MeSH terms
Grants and funding
LinkOut - more resources
Full Text Sources
