. 2023 May 2;23(5):10.
doi: 10.1167/jov.23.5.10.

Qualitative perception of 3D shape from patterns of luminance curvature

Affiliations

Qualitative perception of 3D shape from patterns of luminance curvature

James T Todd et al. J Vis. .

Abstract

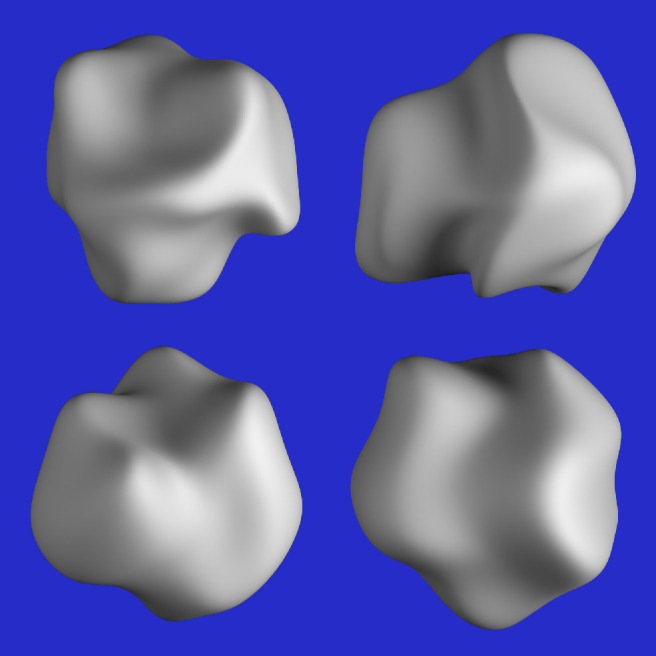
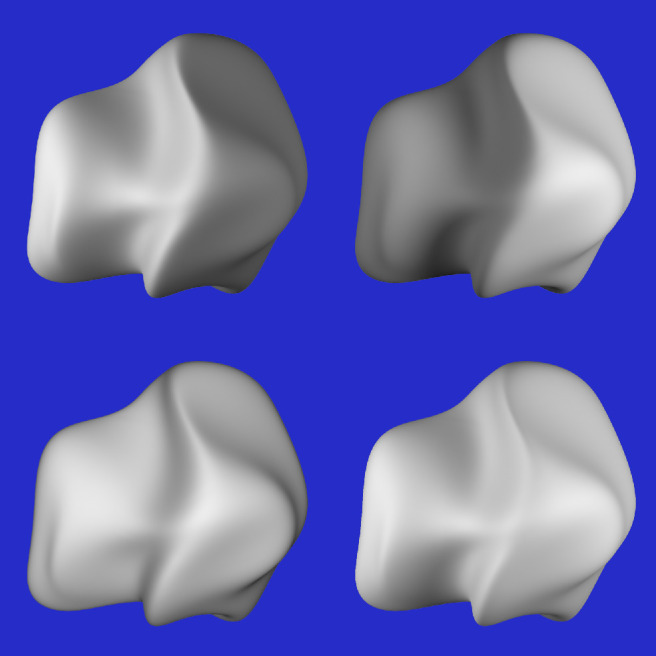
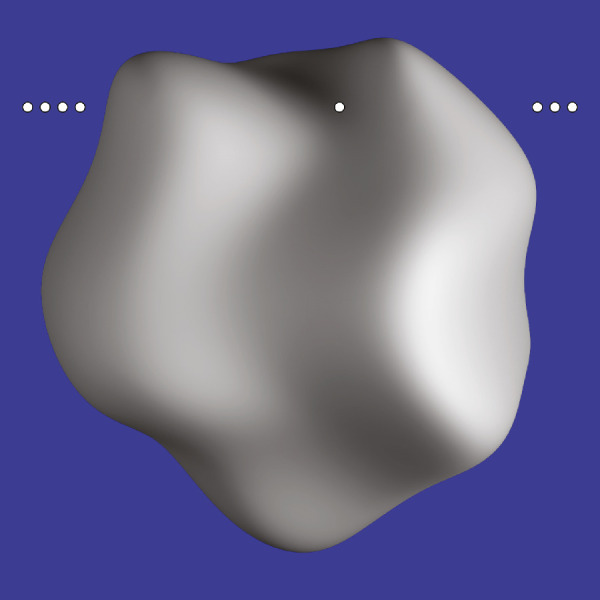
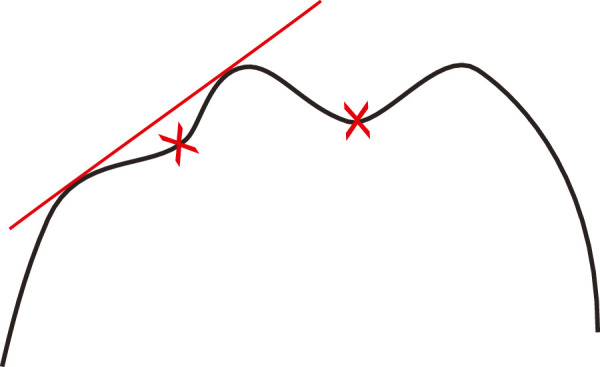
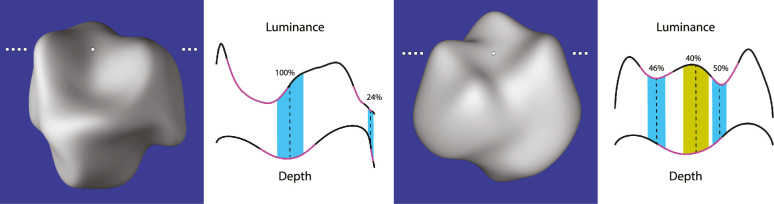
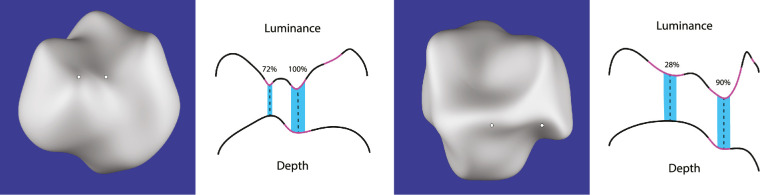
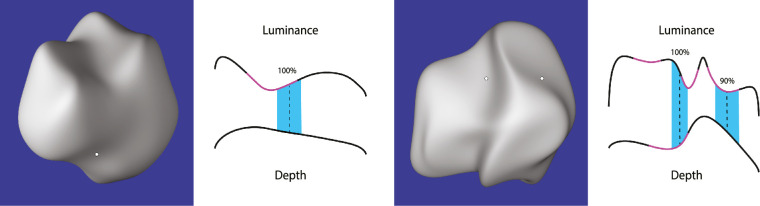
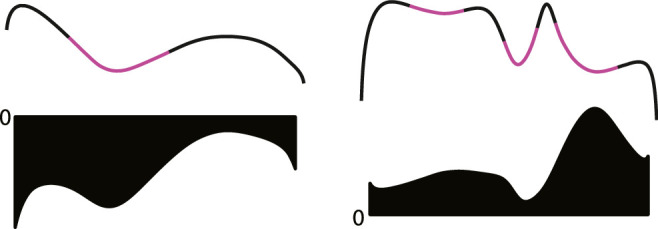
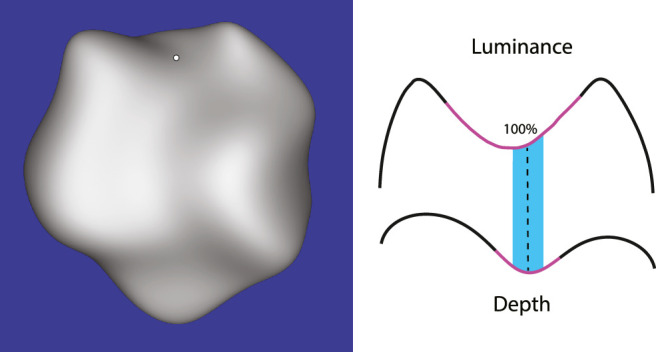
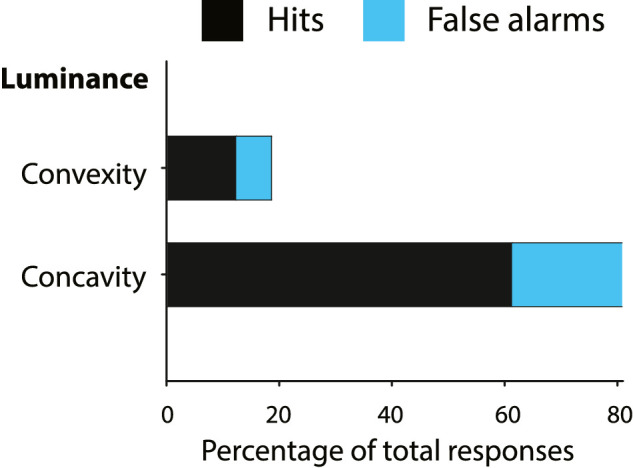
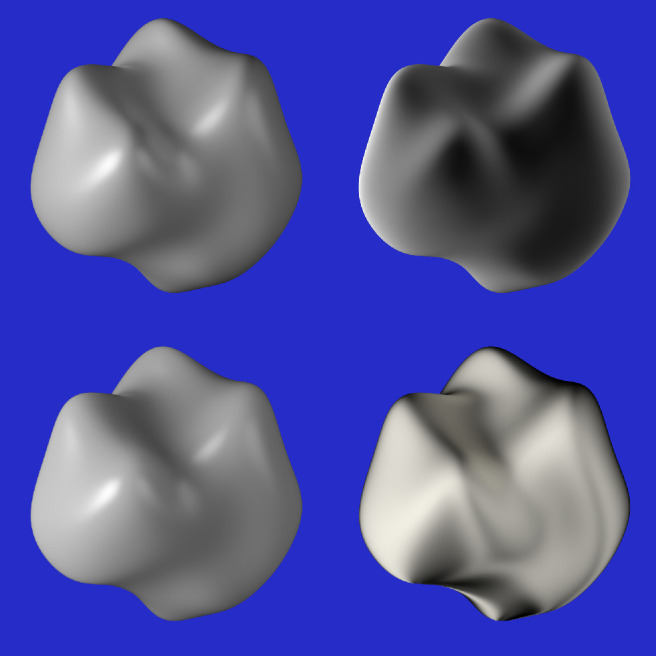
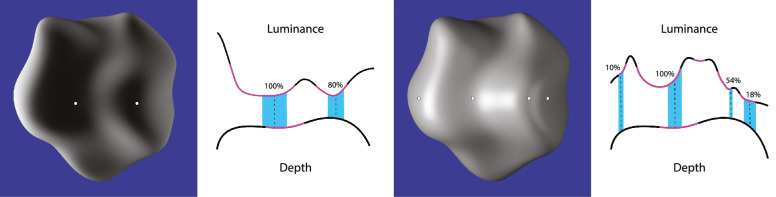
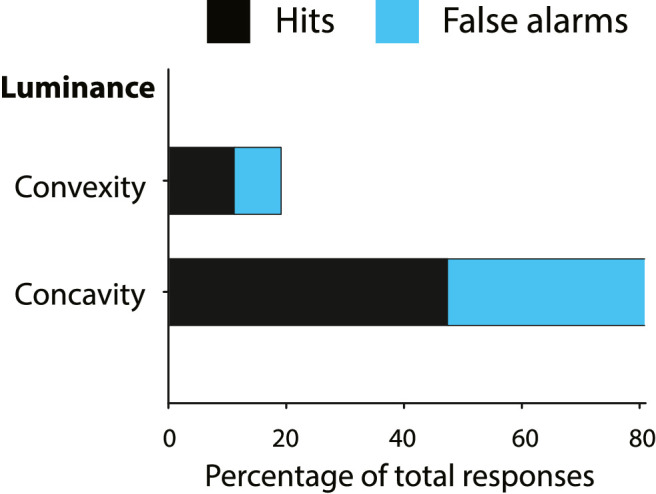
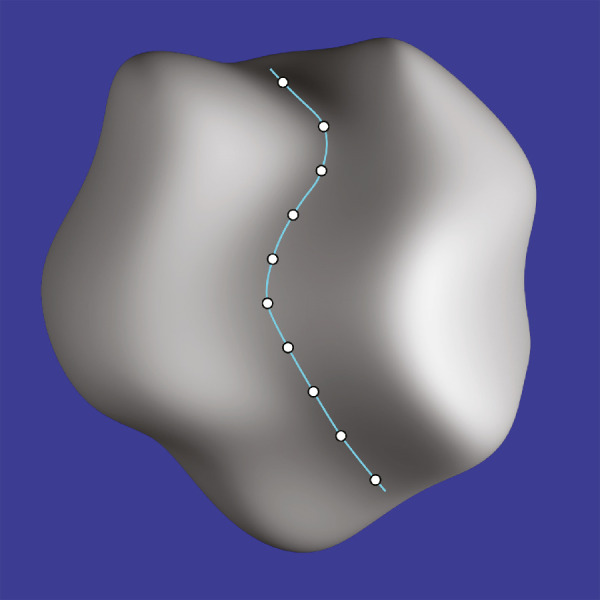
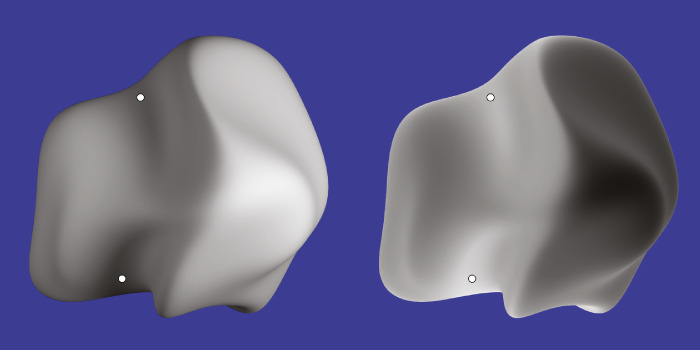
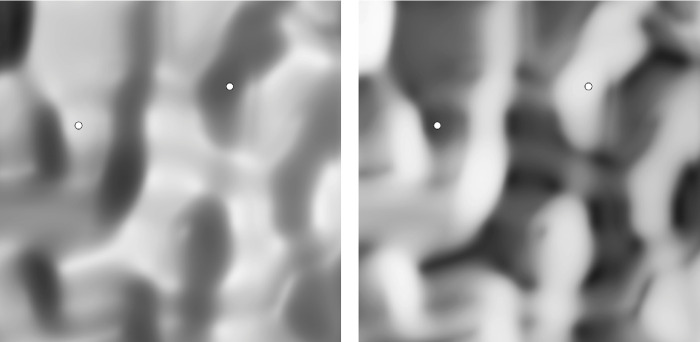
A new source of information is proposed for the perception of three-dimensional (3D) shape from shading that identifies surface concavities from the curvature of the luminance field. Two experiments measured the abilities of human observers to identify concavities on smoothly curved shaded surfaces depicted with several different patterns of illumination and several different material properties. Observers were required to identify any apparent concavities along designated cross sections of the depicted objects and to mark each concavity with an adjustable dot. To analyze the results, we computed both the surface curvature and the luminance curvature along each image cross section. The results revealed that most responses were in concave regions of the luminance profiles, although they were often shifted in phase relative to the curvature of the depicted surfaces. This pattern of performance was surprisingly robust over large changes in the pattern of illumination or surface material properties. Our analysis predicts that observers should make false alarm responses in regions where a luminance concavity does not correspond to a surface concavity, and our empirical results confirm that prediction.


Figures

Figure 1.
Figure 1.
A pebble mosaic of a stag hunt from 300 BCE by Gnosis. This is one of the earliest known examples of the use of shading (i.e., chiaroscuro) for the depiction of 3D shape in pictorial art.
Figure 2.
Figure 2.
The rim of a smoothly curved object. The regions outlined by dashed lines in the interior are labeled as elliptic (E), hyperbolic (H), and parabolic (P) based on the curvature along the contour.
Figure 3.
Figure 3.
Four surfaces with Lambertian shading. The curves to the right of each object show the depth and luminance profiles of a horizontal cross section through its center. For the curves in the top row, the depth and luminance profiles have the same number of concavities. For the ones in bottom row, the luminance profiles have a greater number of concavities than the depth profile.
Figure 4.
Figure 4.
Ribbon surfaces with two types of curvature. The central axes of both surfaces are planar space curves. The top surface has undergone a bending transformation such that all changes in the surface normal are confined to the plane of the central axis. The bottom surface has undergone a twisting transformation such that all changes in the surface normal are perpendicular to the plane of the central axis. Note that both types of curvature can influence the shading along the central axis.
Figure 5.
Figure 5.
The four different objects used in the present experiments. All of them are illuminated primarily from the right.
Figure 6.
Figure 6.
A single object with four different patterns of illumination used in the present experiment. Moving clockwise from the upper left, the object is illuminated primarily from the left, primarily from the right, equally from the left and right, and from the front.
Figure 7.
Figure 7.
The task employed in Experiment 1. An image was presented with four small dots on each side to designate a particular cross section. Observers marked each apparent concavity along the cross section with one of the adjustable dots.
Figure 8.
Figure 8.
Observers were instructed to mark the deepest point within a concavity relative to a line that is tangent to both of its boundaries. They practiced this task on simple line drawings like the one shown here by marking an X at the appropriate points. Note that the concavity on the right coincides with a depth extremum, but that is not the case for the one on the left.
Figure 9.
Figure 9.
Some patterns of response for Experiment 1. Each panel contains a shaded image on the left with a designated surface cross section that observers were asked to judge and a typical pattern of response for that cross section. The right side of each panel shows the depth and luminance profiles along the designated surface cross section. Convex regions along each curve are colored black, and concave regions are colored magenta. The dashed black lines show the mean locations where observers’ responses were clustered, the cyan or yellow band around each line shows ± two standard deviations of the response distribution, and the number just above each line shows the percentage of trials where that region was marked. Note in the left panel that there is a phase shift between the depth and luminance profiles and that observers are able to compensate for that. The image on the right is perceptually ambiguous. Some observers see a single concavity centered on the luminance maximum, whereas as others see two distinct concavities centered on the luminance minima.
Figure 10.
Figure 10.
Examples of spurious luminance concavities from Experiment 1 that do not correspond to a surface concavity. Both of these images depict surfaces that are illuminated equally from the left and right. This causes spurious luminance concavities to occur in regions where the surface depth is a local minimum, and these regions are often mistakenly judged as surface concavities along the designated surface cross section.
Figure 11.
Figure 11.
Examples of spurious luminance concavities from Experiment 1 that do not correspond to a surface concavity. The designated cross sections in these images both contain a twist in the pattern of curvature that causes spurious luminance concavities in regions where the vertical component of the surface normal is a local extremum in the horizontal direction. These regions are often mistakenly judged as surface concavities along the designated surface cross section.
Figure 12.
Figure 12.
The curves on the top show the luminance profiles from Figure 11. The ones on the bottom show the vertical component of the surface normal along those cross sections relative to zero (i.e., the twist). Note how the spurious luminance concavities are aligned with local extrema in the vertical slant of the surface.
Figure 13.
Figure 13.
An image of a surface with frontal illumination. Frequency doubling does not occur along the designated cross section because of twist in the surface curvature. As the depth of the surface increases near the center of the scan line, there is also an increase in the vertical tilt of the surface that causes the shading to become darker.
Figure 14.
Figure 14.
The overall results for Lambertian surfaces in Experiment 1.
Figure 15.
Figure 15.
A single object with four different reflectance functions used in Experiment 2. Moving clockwise from the upper left, the depicted materials are glossy paint, velvet cloth, satin cloth, and wax.
Figure 16.
Figure 16.
Patterns of response for a single object with two different reflectance functions. The left image depicts black velvet cloth, and the right one depicts glossy paint.
Figure 17.
Figure 17.
The overall results for non-Lambertian surfaces in Experiment 2.
Figure 18.
Figure 18.
Concavity judgments from a series of horizontal cross sections reveal an s-shaped valley along the entire vertical extent of the depicted object.
Figure 19.
Figure 19.
A positive image of a smooth surface (left) and a negative image (right) produced by inverting the shading gradients from the one on the left. Corresponding regions in these images are marked by small dots.
Figure 20.
Figure 20.
Positive and negative images of a random noise surface. Corresponding regions in these images are marked by small dots. Note that the apparent relief for the negative image on the right is reversed relative to the positive image on the left. The region marked by the leftmost dot appears convex in the positive image and concave in the negative image. Conversely, the region marked by the rightmost dot appears concave in the positive image and convex in the negative image.

Similar articles

Cited by

  • A tutorial on the physics of light and image shading.
    Todd JT. Todd JT. Iperception. 2024 Sep 30;15(5):20416695241279929. doi: 10.1177/20416695241279929. eCollection 2024 Sep-Oct. Iperception. 2024. PMID: 39421800 Free PMC article.
  • Orientation fields predict human perception of 3D shape from shading.
    Aubuchon C, Vergne R, Cholewiak SA, Kunsberg B, Holtmann-Rice D, Zucker SW, Fleming RW. Aubuchon C, et al. Proc Natl Acad Sci U S A. 2025 Jul 15;122(28):e2503088122. doi: 10.1073/pnas.2503088122. Epub 2025 Jul 10. Proc Natl Acad Sci U S A. 2025. PMID: 40638088 Free PMC article.
  • Qualitative shape from shading.
    Norman JF, Todd JT. Norman JF, et al. Iperception. 2025 May 30;16(3):20416695251338721. doi: 10.1177/20416695251338721. eCollection 2025 May-Jun. Iperception. 2025. PMID: 40453551 Free PMC article.

References

    1. Anderson, B. L., & Marlow, P. J. (2022). Perceiving the shape and material properties of 3D surfaces. Trends in Cognitive Science, 27, 98–110. - PubMed
    1. Belhumeur, P. N., Kriegman, D. J., & Yuille, A. L. (1999). The bas-relief ambiguity. International Journal of Computer Vision, 35(1), 33–44.
    1. Caniard, F., & Fleming, R. (2007). Distortion in 3D shape estimation with changes in illumination. Proceedings of the 4th Symposium on Applied Perception in Graphics and Visualization, 253, 99–105.
    1. Christou, C. G., & Koenderink, J. J. (1997). Light source dependence in shape from shading. Vision Research, 37(11), 1441–1449. - PubMed
    1. Curran, W. & Johnston, I. A. (1996). The effect of illuminant position on perceived curvature. Vision Research, 36(10), 1399–1410. - PubMed

Publication types