Review
. 2023 Jul 26;123(14):8988-9009.
doi: 10.1021/acs.chemrev.2c00586. Epub 2023 May 12.

Theoretical and Data-Driven Approaches for Biomolecular Condensates

Affiliations
Review

Theoretical and Data-Driven Approaches for Biomolecular Condensates

Kadi L Saar et al. Chem Rev. .

Abstract

Biomolecular condensation processes are increasingly recognized as a fundamental mechanism that living cells use to organize biomolecules in time and space. These processes can lead to the formation of membraneless organelles that enable cells to perform distinct biochemical processes in controlled local environments, thereby supplying them with an additional degree of spatial control relative to that achieved by membrane-bound organelles. This fundamental importance of biomolecular condensation has motivated a quest to discover and understand the molecular mechanisms and determinants that drive and control this process. Within this molecular viewpoint, computational methods can provide a unique angle to studying biomolecular condensation processes by contributing the resolution and scale that are challenging to reach with experimental techniques alone. In this Review, we focus on three types of dry-lab approaches: theoretical methods, physics-driven simulations and data-driven machine learning methods. We review recent progress in using these tools for probing biomolecular condensation across all three fields and outline the key advantages and limitations of each of the approaches. We further discuss some of the key outstanding challenges that we foresee the community addressing next in order to develop a more complete picture of the molecular driving forces behind biomolecular condensation processes and their biological roles in health and disease.


Conflict of interest statement

The authors declare the following competing financial interest(s): T.P.J.K. is a co-founder of Transition Bio and K.L.S., D.Q., and T.P.J.K. are consultants or employees.

Figures
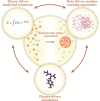
Figure 1
Figure 1
Theory, physics-driven simulations and data-driven machine learning approaches are all playing an important role in advancing our understanding of biomolecular condensation processes. This Review focuses on the recent advancements across all these three approaches outlining the advantages and limitations of each of the approaches. Simulation panel rendered with Avogadro.
Figure 2
Figure 2
a. Summary of theoretical approaches reviewed here, arranged according to the level of physical detail considered. b. Illustration of the two-component Flory–Huggins phase diagram. At each temperature T below the critical point (hollow circle), three regions can be identified according to the total solute concentration ϕ: mixed, binodal and spinodal. Insets show characteristic appearances of the system in each region. c. Fitting of experimentally measured binodal concentrations of different hnRNPA1-LCD variants using the self-consistent solution. Adapted from ref (29). Copyright 2022 American Chemical Society. d. Sequence-dependent parameters that aim to capture composition and residue arrangement information in a single number. Illustrated are 2 groups of 3 sample sequences of 12 residues in length, with sequences within each group having the same composition and σ but different charge arrangements and thus κ and SCD. Blob size is set to 3 for κ calculation. e. Correlation between the radius of gyration ⟨Rg⟩ and κ. Adapted with permission from ref (30). Copyright 2013 National Academy of Sciences.
Figure 3
Figure 3
Summary of the range of molecular representations of varying resolution that have been used in simulations studies of phase separation. As the resolution decreases, the time scales accessible to these simulations become longer. The uses of each type of molecular representation are discussed below. Patchy colloid schematic adapted from ref (104). Copyright 2020 National Academy of Sciences.
Figure 4
Figure 4
Direct coexistence simulations make connections to theory. By simulating a large number of proteins in a system, the densities of molecules in the dense and dilute phases under various conditions like those shown on the left can be used to construct a phase diagram for the system (as shown on the right). Figure adapted from Dignon et al.
Figure 5
Figure 5
Applications of molecular simulations to phase separating systems. Panel A shows a coarse-grained model of the C-terminus of histone H1 (in red) condensing with DNA (in blue). Figure reproduced with permission from ref (125). Copyright 2022 American Chemical Society. In panel B, coarse-grained simulations were used to investigate the condensation of chromatin. Figure reproduced from ref (127). Panel C shows how patchy particle models can be used to investigate the effects of valence on molecular association and phase behavior, in this case on the structure and arrangement of molecules within the dense phase of phase separated systems. Figure reproduced from ref (132).
Figure 6
Figure 6
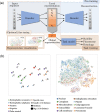
Protein language models (pLMs) can capture a multitude of protein properties. (a) pLMs are commonly trained on the largest protein reference databases by constructing a relevant self-supervised task to force the network to learn meaningful representations of protein sequences. A large variety of models exist with some based on the encoder-decoder architecture. Figure adapted from ref (158). The learned representations can be used as an alternative to hand-crafting features to train downstream models. (b) Low-dimensional visualization of the hidden state of Prot-Trans model. The representations learned cluster amino acids by their physicochemical properties (left) and by their subcellular location (right).
Figure 7
Figure 7
Data-driven modeling of protein phase behavior. Databases that characterize protein phase behavior can be divided into these that (a) highlight proteins that self-phase separate or act as scaffolds (four examples of such databases—PhaSePro, DrLLPS, LLPSDB and PhaSepDB—were considered; the values in the Venn diagram correspond to the number of proteins characterized by each database as self-phase separating or scaffolding) and (b) focus on protein localization into membraneless organelles (two examples, GranuleDB and PhaseSepDB, were considered; the values correspond the number of human proteins identified by each database). (c) The number of proteins from the human proteome that have been experimentally determined to undergo phase separation is a small fraction of the human proteome that has been found to localize into MLOs. (d) Based on existing data sets, a variety of machine learning approaches have been developed for predicting phase separation from the protein sequence. These can be divided into those that rely on individual knowledge-driven hand-crafted features (top), on nonexplicit protein featurisation from representation learning approaches (bottom) as highlighted in Figure 6, or on their ensemble (middle).
Figure 8
Figure 8
Capabilities of current predictive algorithms related phase separation processes can be advanced by accounting for the surrounding environment and its complexity to make the models context-specific (x-axis) as well as by understanding the molecular-scale drivers of the processes to increase the resolution of information that is obtained (y-axis).
Figure 9
Figure 9
Computational approaches can be advanced further in multiple directions to better understand biomolecular phase separation processes. This includes but is not limited to understanding and elucidating (i) how environmental factors control phase separation, (ii) how the presence of other (bio)molecules, cofactors or other types of modulators affect the process, (iii) the role that post-translational modifications play in the process, and (iv) how cellular environment controls and enables phase separation and what the genomic signatures of biomolecular condensation are in cells.

Similar articles

Cited by

References

    1. Alberti S.; Gladfelter A.; Mittag T. Considerations and challenges in studying liquid-liquid phase separation and biomolecular condensates. Cell 2019, 176, 419–434. 10.1016/j.cell.2018.12.035. - DOI - PMC - PubMed
    1. Mitrea D. M.; Kriwacki R. W. Phase separation in biology; functional organization of a higher order. Cell Commun. Signal. 2016, 14, 1–20. 10.1186/s12964-015-0125-7. - DOI - PMC - PubMed
    1. Feric M.; Vaidya N.; Harmon T. S.; Mitrea D. M.; Zhu L.; Richardson T. M.; Kriwacki R. W.; Pappu R. V.; Brangwynne C. P. Coexisting Liquid Phases Underlie Nucleolar Subcompartments. Cell 2016, 165, 1686–1697. 10.1016/j.cell.2016.04.047. - DOI - PMC - PubMed
    1. Lafontaine D. L. J.; Riback J. A.; Bascetin R.; Brangwynne C. P. The nucleolus as a multiphase liquid condensate. Nat. Rev. Mol. Cell Bio. 2021, 22, 165–182. 10.1038/s41580-020-0272-6. - DOI - PubMed
    1. Protter D. S. W.; Parker R. Principles and Properties of Stress Granules. Trends Cell Biol. 2016, 26, 668–679. 10.1016/j.tcb.2016.05.004. - DOI - PMC - PubMed

Publication types

MeSH terms