. 2023 May 12;9(19):eade3559.
doi: 10.1126/sciadv.ade3559. Epub 2023 May 12.

TREM2 inhibition triggers antitumor cell activity of myeloid cells in glioblastoma

Affiliations

TREM2 inhibition triggers antitumor cell activity of myeloid cells in glioblastoma

Rui Sun et al. Sci Adv. .

Erratum in

Abstract

Triggering receptor expressed on myeloid cells 2 (TREM2) plays important roles in brain microglial function in neurodegenerative diseases, but the role of TREM2 in the GBM TME has not been examined. Here, we found that TREM2 is highly expressed in myeloid subsets, including macrophages and microglia in human and mouse GBM tumors and that high TREM2 expression correlates with poor prognosis in patients with GBM. TREM2 loss of function in human macrophages and mouse myeloid cells increased interferon-γ-induced immunoactivation, proinflammatory polarization, and tumoricidal capacity. In orthotopic mouse GBM models, mice with chronic and acute Trem2 loss of function exhibited decreased tumor growth and increased survival. Trem2 inhibition reprogrammed myeloid phenotypes and increased programmed cell death protein 1 (PD-1)+CD8+ T cells in the TME. Last, Trem2 deficiency enhanced the effectiveness of anti-PD-1 treatment, which may represent a therapeutic strategy for patients with GBM.


Figures
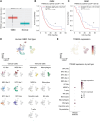
Fig. 1.
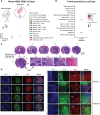
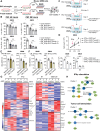
Fig. 1.. TREM2 expression is higher in GBM tumors than normal brain tissue and inversely correlates with patient outcome.
(A) Box plots of TREM2 expression in IDH1/2–wild-type GBM tumors (n = 252) and normal brain specimens (n = 10). Wilcoxon test, P = 5.1 × 10⁻⁷. (B) Kaplan-Meier curves show a PFS of 249 patients with IDH1/2–wild-type GBM based on TREM2 expression. TREM2 expression was dichotomized into high/low according to the optimal cutoff. Log-rank test, P = 0.012. (C) Kaplan-Meier curves show an OS of 115 patients with IDH1/2–wild-type GBM by high and low TREM2 expression. Patients were divided on the basis of the optimal cutoff of TREM2 expression. Log-rank test, P = 0.012. (D) UMAP plots of cell clusters identified in human GBM tumors. (E) UMAP and dot plots of TREM2 expression level in each cluster. AC, astrocyte; MES, mesenchymal; OPC, oligodendrocyte progenitor. *P < 0.05.
Fig. 2.
Fig. 2.. Mouse GBM tumor shows abundant Trem2+ myeloid cells in the TME.
(A) UMAP plots of cell type clusters in mouse SB28 model of GBM in vivo. (B) Dot plots of TREM2 expression level in each cell cluster. (C) Representative histology of brain GBM (SB28). Cryosections of 30 μm thickness (1 to 6) by hematoxylin and eosin staining (top). Scale bar, 2 mm. Histological images for invasive tumor front on section 6: Z1, Z2, Z3, and Z4. Scale bar, 50 μm. (D) Representative immunostaining images. Whole-brain sections (left). Red, Iba1; green, SB28 tumor cells (tracking dye); blue, nucleus [4′,6-diamidino-2-phenylindole (DAPI)]. Scale bar, 2 mm. Iba1+ myeloid cells around and inside the tumor (right). Arrows indicate SB28 cells (yellow) and Iba1+ cells (white). Scale bars, 100 μm.
Fig. 3.
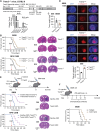
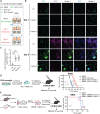
Fig. 3.. Trem2 inhibition in vivo inhibits tumor growth and improves animal survival.
(A) Trem2−/− mice genotype verified by real-time quantitative polymerase chain reaction (RT-qPCR) (n = 3). Primers’ loci in Trem2 mRNA were shown. Trem2 mRNA detected in brain tissue from Trem2+/+, Trem2+/−, and Trem2−/− (Trem2−/−_1 and Trem2−/−_2) littermate mice. Control BV2 (scr) and Trem2 knockdown BV2 cells (Trem2i.1 or Trem2i.2) served the control. Comparisons performed as indicated. NCBI, National Center for Biotechnology Information. (B) Trem2−/− mice showed increased neurological deficit-free survival time than Trem2+/+ mice in both SB28 and NPA C54B GBM models (left). Mice were euthanized at day 20 after tumor implantation. Representative histological images showing tumor size in Trem2+/+ (1 and 2) and Trem2−/− (3 and 4) mice (right). Scale bars, 2 mm. (C) Tumor weight. SB28-bearing mice were euthanized at day 25. Whole-tumor mass was dissected and weighed (n = 8 per genotype). (D) Apoptotic cells in tumor tissue by cleaved caspase-3 (C-caspase 3) immunostaining (n = 3 per genotype). Quantified apoptosis shown as mean fluorescence intensity of tumor area (nuclei, DAPI) divided by C-caspase 3 intensity (red). Scale bar, 2 mm. (E) Acute Trem2 reduction by intracerebroventricular (ICV) injection of ASOs increased OS in GBM-bearing Trem2+/+ mice. SB28, n = 10 per condition; NPA C54B, n = 6 per condition. Schematic showing experimental design (top). Kaplan-Meier curves demonstrated increased survival in animals injected with Trem2 ASO versus control ASO (inactive) (left). Mice were euthanized at day 20 after tumor implantation. Representative histological images showing tumor size (right). Scale bars, 2 mm. (F) Anti-Trem2 treatment increased animal survival in GBM-bearing mice (n = 5 per condition). Trem2+/+ mice were injected intracerebrally (IC) with SB28 cells and treated intraperitoneally (i.p.) with anti-Trem2 or isotype antibody (200 μg per mouse). Experimental design (top). Survival curves (bottom). Data represent means ± SEM. *P < 0.05; **P < 0.01; ***P < 0.001.
Fig. 4.
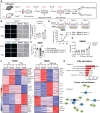
Fig. 4.. Activated Trem2−/− BMDMs show increased phagocytosis and cytotoxic activity in killing GBM cells and proinflammatory phenotypes.
(A) Schematic for BMDM induction from both Trem2+/+ and Trem2−/− littermate mice. BM cells differentiated into macrophages following a 7-day macrophage colony-stimulating factor (M-CSF) induction. CM collected and used for cytotoxic assay as indicated. Gene expression was analyzed by bulk RNA-seq. (B) Phagocytosis of fluorescently labeled beads measured in BMDMs. BMDMs treated with phosphate-buffered saline (PBS) or IFNγ (10 ng/ml) for 30 min. Cytochalasin D (CytoD) was used as a negative control. Representative images (left). Scale bar, 100 μm. The colocalized ratio of beads in DAPI-positive cells (right; n = 4). (C) Cell viability of SB28 assessed by MTS assay. SB28 cells treated with CM from IFNγ-primed BMDMs on day 1. Cytotoxic effects examined on day 3 (n = 16 pooled from four independent experiments). Abs, absorbance. (D) Proliferative curves of SB28 cells. SB28 cells were cocultured with BMDMs by the number ratio of 1:2 in a Transwell system as shown. Absolute cell numbers of SB28 counted on days 1, 3, and 5 (n = 3). (E) Nitrite. BMDMs treated with IFNγ (10 ng/ml) and NO induction were assessed (n = 6). (F) Heatmaps of differentially expressed genes between Trem2+/+ and Trem2−/− BMDMs (n = 2 per condition). BMDMs were treated with IFNγ (left) or tumor antigen (right) for 6 hours. (G) Enriched Kyoto Encyclopedia of Genes and Genomes (KEGG) pathways in cluster 4 upon IFNγ treatment (top, bar plot) and cluster 3 upon dead tumor cell stimulation (bottom). NOD, nonobese diabetic. Data represent means ± SEM. *P < 0.05; ***P < 0.001.
Fig. 5.
Fig. 5.. TREM2 knockdown human macrophages demonstrate enhanced cytotoxic effects on human GSCs.
(A) TREM2 knockdown THP-1–derived macrophages and their antitumor function. Human THP-1 monocytes were stably transduced with TREM2-targeted or control short hairpin–mediated RNA (shRNA) lentivirus. Macrophage differentiation was induced by 100 nM phorbol 12-myristate 13-acetate (PMA) for 48 hours. After 24 hours of resting, cells were continually cultured for another 48 hours in fresh medium or treated with IFNγ (20 ng/ml) for 24 or 48 hours, respectively. CM was collected. (B to E) GSCs B152 and B67 treated with CM (48 hours) from cultured THP-1 macrophages for 48 hours. Complete medium used as a control. (B) and (D) Cell viability shown as luminescence intensity (RLU) detected by adenosine 5by ty shown as (ATP) assay. GSCs B152 (n = 10) and B67 (n = 8). (C) and (E) Cell death shown as positive YOYO-1 staining (green fluorescence). Representative images (left). Scale bars, 100 μm. Death ratio quantified as particle fraction of nuclei (Hoechst) divided by YOYO-1 (right). GSCs B152, n = 4; B67, n = 8. scr, scrambled; Lum, luminescence. (F and G) Viable cells detected as absorbance at 490-nm wavelength by MTS assay. GSCs B152 and B67 treated with CM from IFNγ-stimulated THP-1 macrophages for 48 hours. Complete medium with IFNγ served the control. (F) GSCs B152 (n = 6 per condition). (G) GSCs B67 (n = 6 per condition). Data represent means ± SEM. *P < 0.05; **P < 0.01; ***P < 0.001.
Fig. 6.
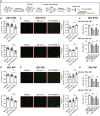
Fig. 6.. Trem2-deficient microglial cells demonstrate increased phagocytotic activity.
(A to D) Phagocytosis of fluorescently labeled beads was measured in BV2 cells. (A) Trem2 expression. Trem2 knockdown in BV2 cells by lentivirus transduction: Trem2-targeted shRNA (Trem2i.1 and Trem2i.2) and nonsilencing shRNA (scr). Fold change of Trem2 mRNA (left; n = 6). Representative Western blot (right, n = 2). (B) Phagocytotic activity. Cytochalasin D, an inhibitor of actin polymerization, was used as a negative control. Representative images (left). Scale bar, 100 μm. The colocalized ratio of beads in DAPI-positive cells (right; n = 6). (C) Trem2 expression. BV2 cells treated with inactive or Trem2-targeted ASO for 48 and 72 hours, respectively. Fold change of Trem2 mRNA (left; n = 4). Representative Western blot (right; n = 2). (D) Phagocytotic activity. Cytochalasin D served the control. Representative images (left). Scale bar, 100 μm. Quantified colocalization of beads with DAPI-positive cells (right; n = 8). (E) Phagocytosis of fluorescently labeled beads measured in primary microglia. Primary microglia isolated from trem2 transgenic mice. Representative images (left). Scale bar, 100 μm. The colocalized ratio of beads in DAPI-positive cells (right; n = 41 fields per condition). Data represent means ± SEM. *P < 0.05; **P < 0.01; ***P < 0.001.
Fig. 7.
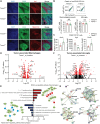
Fig. 7.. Trem2-deficient microglia exhibit increased tumoricidal activity and proinflammatory phenotype.
(A to D) Trem2 knockdown BV2 microglia were generated using Trem2-targeted shRNA lentivirus transduction (Trem2i.1 and Trem2i.2). Nonsilencing shRNA transduced cells were used as control (scr). (A) Schematic for the experimental strategy. CM was collected from untreated or IFNγ-treated BV2 cells. The cytotoxicity of CM on SB28 cells was assessed. (B) Cell viability detected as luminescence intensity. Top, untreated; bottom, IFNγ-treated; left, 48-hour CM; right, 96-hour CM (n = 12 pooled from three independent experiments). (C) and (D) Indirect antitumor effects of BV2 microglia assessed. (C) Experimental design for Transwell BV2-SB28 coculture. (D) Proliferative curve and cell viability. SB28 proliferation detected by absolute cell count (left; n = 3). Viable cells examined by ATP assay (right; n = 4). (E to H) Primary microglia treated with inactive (control) or Trem2-targeted ASOs for 72 hours. (E) The cytotoxicity of CM on SB28 cells assessed by MTS assay. CM collected from primary microglia following ASO treatment. Left, 48-hour CM (n = 8); right, 72-hour CM (n = 8). (F) Cytotoxic effects of IFNγ-treated CM on SB28 cells. After ASO treatment, primary microglia were stimulated with IFNγ (10 ng/ml) for 24 or 48 hours, and CM was collected (n = 8). (G) Heatmaps of differentially expressed genes between inactive and Trem2 ASO–treated primary microglia (n = 2 per condition). Primary microglia were treated with IFNγ (left) or dead SB28 cells (right) for 6 hours. (H) KEGG pathway enrichment analysis of cluster 1. Networks: IFNγ treatment (top) and tumor antigen treatment (bottom). Data represent means ± SEM. *P < 0.05; **P < 0.01; ***P < 0.001.
Fig. 8.
Fig. 8.. Trem2 loss-of-function myeloid cells show antitumor effects both in vitro and in vivo.
(A to C) Trem2 knockdown in BV2 microglia by Trem2-targeted shRNA lentivirus transduction (Trem2i.1 and Trem2i.2). Nonsilencing shRNA used as control (scr). BV2 and SB28 cells were stained with green and deep-red tracking dye, respectively, and cocultured in vitro. (A) Timeline schematic for treatment strategy. (B) Representative images. Green, BV2; purple, SB28; blue, nucleus (DAPI). Scale bar, 100 μm. (C) Violin plot indicating the ratio of mean fluorescent intensity (green/purple) at day 5 (quantified for 30 fields per condition). (D) GBM model of intracranial (IC) coimplantation of BV2 microglia and SB28 cells. Neurological deficit-free survival curves (right; n = 5 per group). WT, wild-type. (E) GBM model of BMDMs and SB28 coinjection. Neurological deficit-free survival curves (right; n = 4 per group). Data represent means ± SEM. *P < 0.05; **P < 0.01; ***P < 0.001.
Fig. 9.
Fig. 9.. Trem2 deficiency reprograms tumor-associated myeloid cells toward a proinflammatory phenotype.
(A) Representative imaging showing that Iba1+ and Tmem119+ myeloid cell populations in SB28 tumor from Trem2+/+ and Trem2−/− mice. Scale bars, 100 μm. (B) Representative pseudo-color/smooth plots showing intratumoral CD45+CD11b+ myeloid cells (top). Frequencies of Ly6Chigh (macrophage/monocyte lineage) and Ly6Clow cells (resident microglia) among CD45+CD11b+ cell populations (bottom; n = 8/genotype). (C) Relative gene expression in tumor-associated CD45+CD11b+ myeloid cells from Trem2+/+ and Trem2−/− mice (n = 4 per genotype). (D to G) Trem2+/+ mice were intracerebroventricularly injected with Trem2-targeted ASO or inactive control. Then, ASO-treated mice were intracerebrally implanted with SB28 cells. Live CD45+ cells isolated from brain tumors (day 30) and analyzed by scRNA-seq. (D) and (F) Volcano plots showing differentially expressed genes in macrophage subset (D) and microglia population (F) from Trem2 ASO–treated tumor versus from inactive ASO–treated tumor. (E) KEGG analysis of enriched up-regulated and down-regulated pathways in tumor-associated macrophage subset. Red, up-regulated; blue, down-regulated. (G) STRING protein interaction analysis of down-regulated genes (Gpnmb and Lpl) and up-regulated genes (Tnfsf4 and Dapk2) in tumor-associated microglia from Trem2 ASO–treated tumor. Networks generated on STRING v11.5 (https://string-db.org/). Data represent means ± SEM. *P < 0.05; **P < 0.01. NS, no significance; FC, fold change.
Fig. 10.
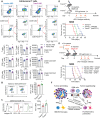
Fig. 10.. Trem2 deficiency increases PD-1+CD8+ T cells in the TME, and combined anti–PD-1 therapy augments overall animal survival.
(A) Representative pseudo-color/smooth plots showing intratumoral T cell subsets and PD-1 expression (top). Live CD45+ cells isolated from SB28 tumors in ASO-treated mice and assessed by flow cytometry. Summary graphs showing frequencies of total T cells among CD45+ cells, CD3+CD8+ and CD3+CD4+ subsets among T cells, and PD-1+ cell among different T cell populations, and PD-1 protein levels [mean fluorescence intensity (MFI)] (bottom; n = 8 per condition). (B to C) Tumor-associated CD45+ cells isolated from SB28-bearing Trem2+/+ and Trem2−/− mice. PD-1 expression in CD3+CD8+ T cells was assessed by flow cytometry. (B) Frequency of PD-1+ cells in CD3+CD8+ T cells. Representative flow plots (left) and summary graph (right; n = 8 per genotype). (C) PD-1 protein shown as MFI. Representative histograms (left) and summary graph (right; n = 8 per genotype). TIL, tumor-infiltrating lymphocyte. (D and E) Combined therapy in GBM. (D) Schematic (top). Trem2−/− mice were treated with anti–PD-1 antibody or isotype control following tumor implantation (n = 5 per condition). Symptom-free survival curves for SB28-bearing mice (bottom). (E) Schematic showing ASOs and anti–PD-1 treatment strategy (top). Neurological deficit-free survival curves for SB28 GBM model (bottom). (F) Schematic to describe Trem2 inhibition reshapes TME by modulating myeloid cell phenotypes and cytotoxic T cell function, which suppresses tumor progression. Data represent means ± SEM. *P < 0.05; **P < 0.01; ***P < 0.001. IC, intracranial; ICV, intracerebroventricular.

References

    1. Stupp R., Hegi M. E., Mason W. P., van den Bent M. J., Taphoorn M. J., Janzer R. C., Ludwin S. K., Allgeier A., Fisher B., Belanger K., Hau P., Brandes A. A., Gijtenbeek J., Marosi C., Vecht C. J., Mokhtari K., Wesseling P., Villa S., Eisenhauer E., Gorlia T., Weller M., Lacombe D., Cairncross J. G., Mirimanoff R. O.; on behalf of the European Organisation for Research and Treatment of Cancer Brain Tumour and Radiation Oncology Groups; the National Cancer Institute of Canada Clinical Trials Group , Effects of radiotherapy with concomitant and adjuvant temozolomide versus radiotherapy alone on survival in glioblastoma in a randomised phase III study: 5-year analysis of the EORTC-NCIC trial. Lancet Oncol. 10, 459–466 (2009). - PubMed
    1. Buerki R. A., Chheda Z. S., Okada H., Immunotherapy of primary brain tumors: Facts and hopes. Clin. Cancer Res. 24, 5198–5205 (2018). - PMC - PubMed
    1. Friebel E., Kapolou K., Unger S., Nunez N. G., Utz S., Rushing E. J., Regli L., Weller M., Greter M., Tugues S., Neidert M. C., Becher B., Single-cell mapping of human brain cancer reveals tumor-specific instruction of tissue-invading leukocytes. Cell 181, 1626–1642.e20 (2020). - PubMed
    1. Klemm F., Maas R. R., Bowman R. L., Kornete M., Soukup K., Nassiri S., Brouland J. P., Iacobuzio-Donahue C. A., Brennan C., Tabar V., Gutin P. H., Daniel R. T., Hegi M. E., Joyce J. A., Interrogation of the microenvironmental landscape in brain tumors reveals disease-specific alterations of immune cells. Cell 181, 1643–1660.e17 (2020). - PMC - PubMed
    1. Ulland T. K., Song W. M., Huang S. C., Ulrich J. D., Sergushichev A., Beatty W. L., Loboda A. A., Zhou Y., Cairns N. J., Kambal A., Loginicheva E., Gilfillan S., Cella M., Virgin H. W., Unanue E. R., Wang Y., Artyomov M. N., Holtzman D. M., Colonna M., TREM2 maintains microglial metabolic fitness in Alzheimer’s disease. Cell 170, 649–663.e13 (2017). - PMC - PubMed