. 2023 May 12;8(83):eabq7486.
doi: 10.1126/sciimmunol.abq7486. Epub 2023 May 12.

Transcriptional programming of CD4+ TRM differentiation in viral infection balances effector- and memory-associated gene expression

Affiliations

Transcriptional programming of CD4+ TRM differentiation in viral infection balances effector- and memory-associated gene expression

Quynh P Nguyen et al. Sci Immunol. .

Abstract

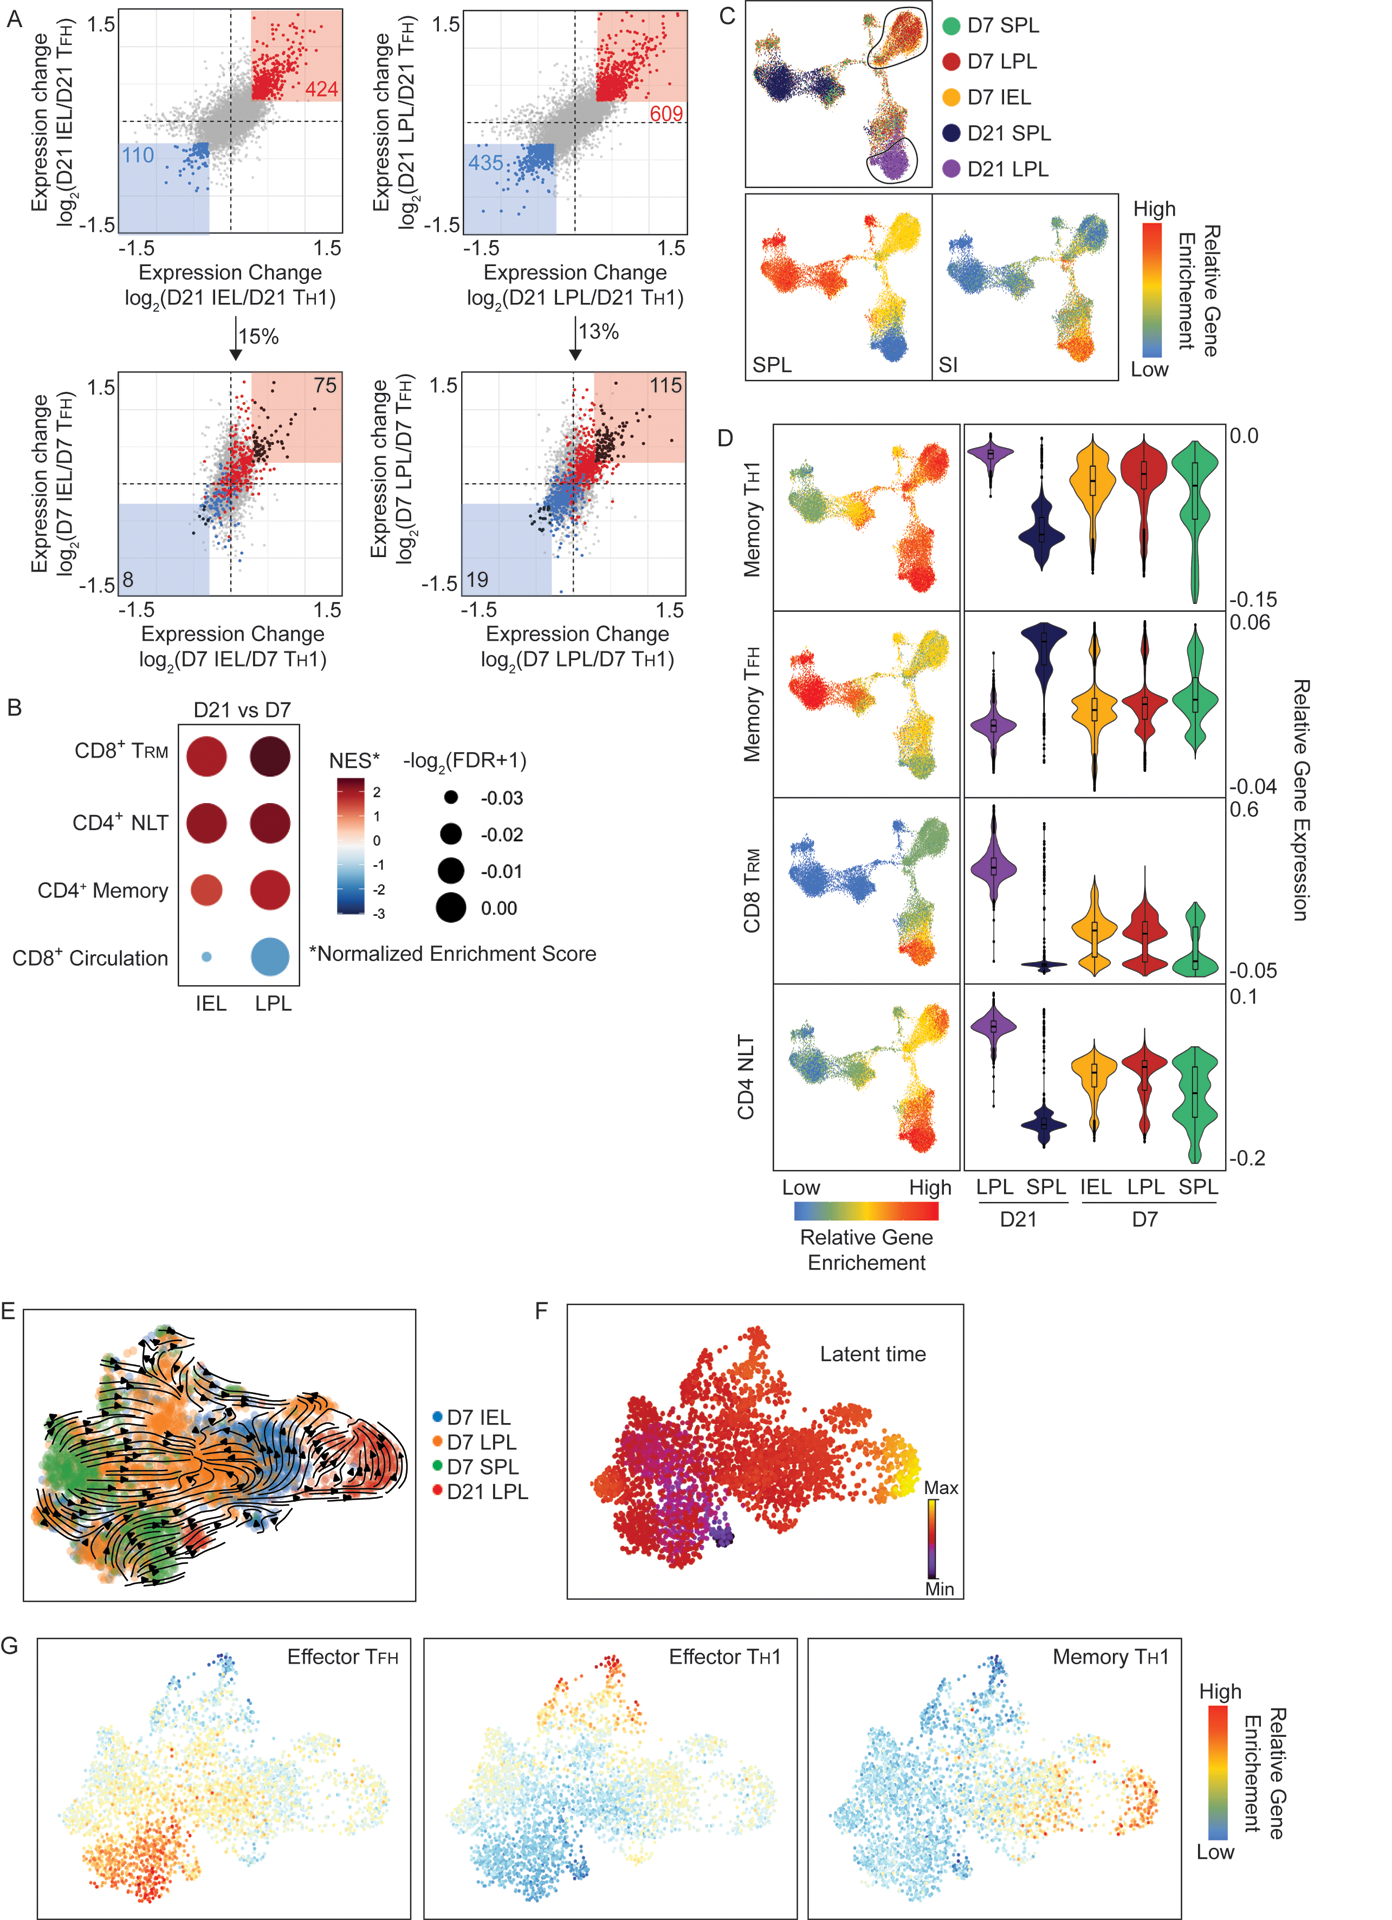
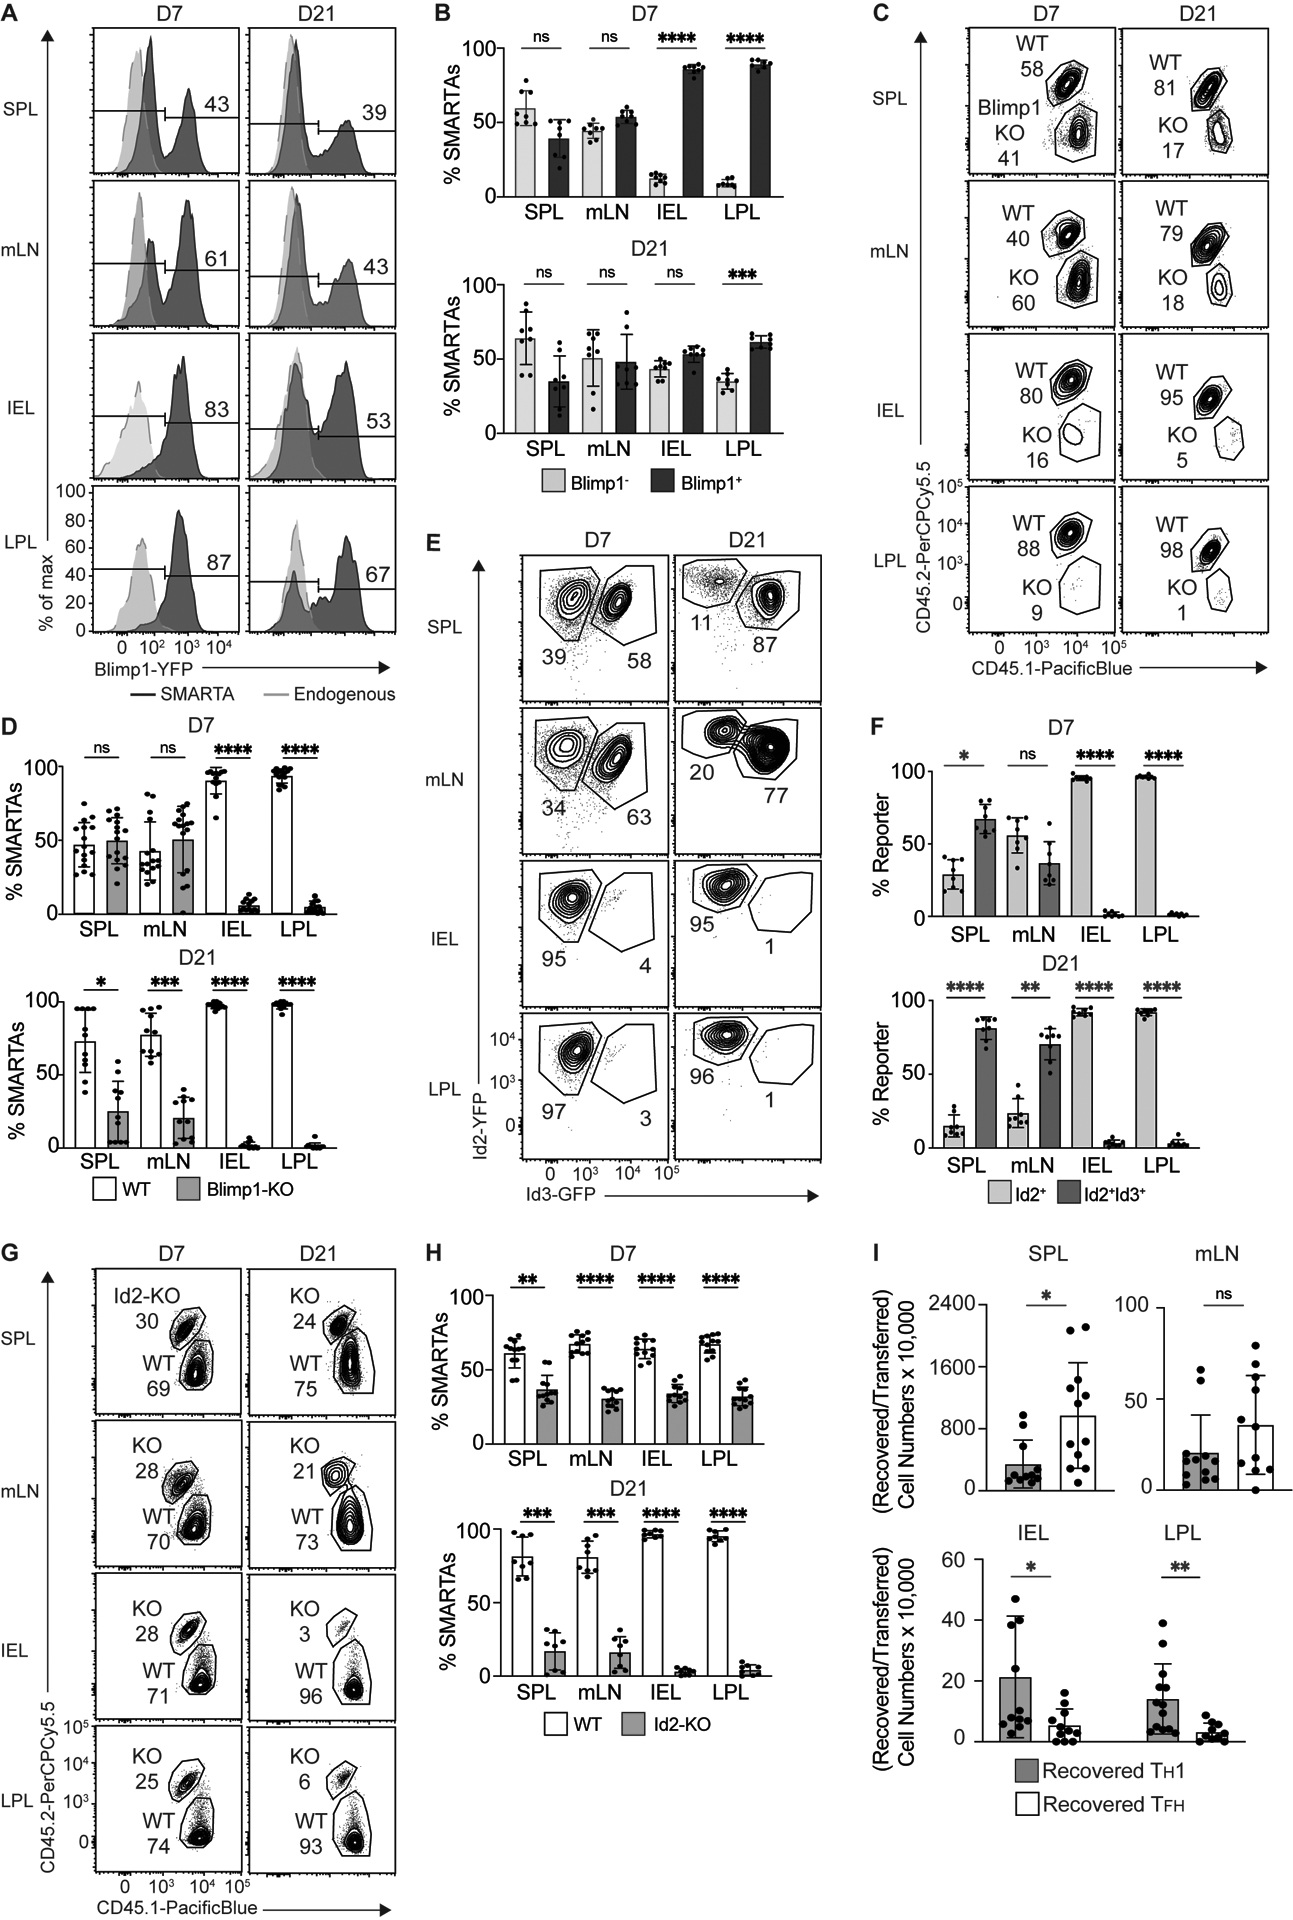
After resolution of infection, T cells differentiate into long-lived memory cells that recirculate through secondary lymphoid organs or establish residence in tissues. In contrast to CD8+ tissue-resident memory T cells (TRM), the developmental origins and transcriptional regulation of CD4+ TRM remain largely undefined. Here, we investigated the phenotypic, functional, and transcriptional profiles of CD4+ TRM in the small intestine (SI) responding to acute viral infection, revealing a shared gene expression program and chromatin accessibility profile with circulating TH1 and the progressive acquisition of a mature TRM program. Single-cell RNA sequencing identified heterogeneity among established CD4+ TRM, which were predominantly located in the lamina propria, and revealed a population of cells that coexpressed both effector- and memory-associated genes, including the transcriptional regulators Blimp1, Id2, and Bcl6. TH1-associated Blimp1 and Id2 and TFH-associated Bcl6 were required for early TRM formation and development of a mature TRM population in the SI. These results demonstrate a developmental relationship between TH1 effector cells and the establishment of early TRM, as well as highlighted differences in CD4+ versus CD8+ TRM populations, providing insights into the mechanisms underlying the origins, differentiation, and persistence of CD4+ TRM in response to viral infection.


Figures

Figure 1.
Figure 1.. CD4+ TRM retain a TH1 effector cell profile during viral infection.
Naive SMARTA CD4+ T cells were transferred into congenically distinct mice that were subsequently infected with LCMV-Arm. On days 7 and 21 of infection, SMARTA CD4+ T cells were isolated. (A) Representative flow plots showing frequency of IV SMARTA cells in peripheral blood (PBL), spleen (SPL), mesenteric lymph nodes (mLN), intraepithelial lymphocytes (IEL) and lamina propria lymphocytes (LPL) from the small intestine (SI), kidney (KID), liver (LIV), and lung on indicated day of infection. (B-C) Expression of SLAM and CXCR5 by SMARTA CD4+ T cells in PBL, SPL, mLN, IEL, LPL, kidney, liver, and lung on indicated day of infection. Representative flow cytometry plots (B) and quantification (C) of SLAM+ and SLAMCXCR5+ SMARTA CD4+ T cells. (D-E) Expression of CD69, CD103, CD27 and Ly6C by SMARTA CD4+ T cells in SPL, mLN, IEL, and LPL on indicated day of infection. Representative flow cytometry plots (D) and quantification (E) of frequencies of CD69+, CD27+, and Ly6C+ cells. Numbers in flow plots indicate percent of cells in corresponding gate. Data are representative (A,B) or cumulative (C,E) of 3 experiments (A-E) with n=2–4 mice. Graphs show mean ± SD; *p < 0.05, ** p<0.01, *** p<0.001, ****p< 0.0001. Paired t-test (C) or one-way ANOVA test (E) was performed for statistical significance.
Figure 2.
Figure 2.. CD4+ TRM in viral infections are transcriptionally and epigenetically similar to TH1 cells.
(A) Principal component analysis (PCA) of bulk RNAseq of circulating and resident SMARTA CD4+ T cells from spleen and SI, harvested on day 7 or 21 of LCMV-Arm infection. (B) Gene set enrichment analysis (GSEA) of day 21 RNAseq data. (C) Heatmap showing gene expression of transcriptional regulators (left) or cell surface receptors/cytokines (right). Values are calculated as a log2fold change between each sample and naive population. (D-G) ATACseq of circulating and resident SMARTA CD4+ T cells from spleen and IEL on day 7 or spleen on day 20 of infection. (D) Pearson correlation for peaks in differentially accessible regions. (E) Volcano plots comparing peak counts between D7 IEL and TH1 or TFH subsets. Numbers in volcano plots indicate number of differentially accessible regions in IEL compared to either TH1 or TFH samples. (F) Left, heatmap showing differentially accessible regions (DARs) between IEL compared to splenic TFH or TH1 populations. Right, heatmap showing expression of genes corresponding to DARs. Values are calculated as a log2fold change between IEL and TFH or TH1. (G) Genome browser tracks depict ATACseq chromatin accessibility across samples for indicated gene. Data from average of 3 replicates (A-C) or 2 replicates (D-G) with cells pooled from 4–5 mice per replicate for day 7 and n=12–15 mice per replicate for day 21.
Figure 3.
Figure 3.. TH1 effector cells from the spleen and mLNs express gut homing molecules.
(A-B) CCR9 and CD49d expression by CD4+ T cells in specified tissues on days 6–8 of LCMV-Arm infection. Representative flow cytometry plots (A), and quantification (B) of CCR9+CC49d+ SMARTA CD4+ T cells. CCR9+CD49d+ quadrants are highlighted in red (C-D) Expression of SLAM and CXCR5 by CCR9+CC49d+ SMARTA CD4+ T cells in the spleen or mLN on days 6–8 of LCMV-Arm infection. Representative flow cytometry plots (C) and quantification (D) of TH1 (SLAM+CXCR5) and TFH (SLAMCXCR5+) SMARTA cells. (E) IFNγ and TNFα expression by CD4+ T cells on indicated day of infection following ex vivo GP61–80 peptide stimulation in specified tissues. Representative flow cytometry plots (top) and quantification (bottom) of IFNγ+ and TNFα+ SMARTA CD4+ T cells. (F) Granzyme A (GzmA) and B (GzmB) expression by SMARTA CD4+ T cells in specified tissues on indicated day of infection. Representative flow cytometry plots (top) and quantification (bottom) of GzmA+ and GzmB+ SMARTA CD4+ T cells. Numbers in flow plots indicate frequency of cells in corresponding gate. Data are representative (A,C,E,F) or cumulative (B,D,E,F) of 2 experiments with n=3–4 mice. Graphs show mean ± SD; *p < 0.05, ** p<0.01, *** p<0.001, ****p< 0.0001. One-way ANOVA (B, E-F) or paired t-test (D) were performed for statistical significance.
Figure 4.
Figure 4.. Effector SI CD4+ T cells in viral infection progress towards a mature TRM program.
(A) Top, comparison of gene expression of IEL (left) and LPL (right) CD4+ TRM cells relative to TH1 and TFH subsets on day 21 of LCMV infection. Red denotes genes with increased expression in TRM relative to TH1 and TFH cells; blue denotes genes with increased expression in TH1 and TFH relative to TRM cells. Bottom, comparison of differentially expressed genes in mature TRM cells (from top panel) in cells from IEL or LPL on day 7 of infection. Black denotes genes from top panel (either blue or red) which are differentially expressed by day 7 SI SMARTA CD4+ T cells compared to day 7 splenic SMARTA CD4+ T cell subsets. (B) Gene set enrichment analysis (GSEA) comparing day 7 and 21 SI SMARTA CD4+ T cells. (C-G) Single-cell RNAseq of circulating and resident SMARTA CD4+ T cells from spleen and SI, harvested on day 7 or 21 post-infection. (C) UMAP dimensional reduction colored by sample (top) and relative enrichment of indicated gene signatures (bottom). (D) UMAP reduction and violin plots showing relative enrichment of indicated gene signatures. (E) Velocity field projected onto UMAP plot of specified tissues. Arrows show the local average velocity evaluated on a regular grid. (F) UMAP plots showing latent time with yellow representing the most terminal state. (G) UMAP plots showing enrichment of specified gene signature. Data are from 2–3 replicates (A-C) or 2 replicates (D-H) of cells pooled from 4–5 mice for day 7 and n=12–15 mice for day 21.
Figure 5.
Figure 5.. CD4+ SI TRM exhibit heterogeneity and express genes associated with both effector and memory fates.
Single-cell RNAseq of SMARTA CD4+ T cells from spleen and SI on day 21 following LCMV-Arm infection. (A) UMAP dimensional reduction of SI and LPL SMARTA CD4+ T cells colored by tissue identity. (B-C) UMAP reduction of SPL and LPL samples (B) or LPL samples only (C) showing relative enrichment of indicated gene signatures. (D) UMAP reduction showing relative expression of indicated transcriptional regulators, cell surface receptors or cytokines. (E) UMAP dimensional reduction showing merged expression of indicated TF pairs. (F) Bar plot showing relative fold-change of Bcl6 mRNA in indicated tissue compared to spleen in Blimp1+ versus Blimp1 SMARTA CD4+ T cells from mice on day 15 of LCMV-Arm infection. One-way ANOVA test was performed for statistical significance. Data are from 2 replicates (A-E) or 3 replicates (F) of cells pooled from 12–15 mice per replicate. Graphs show mean ± SD; *p < 0.05, ** p<0.01.
Figure 6.
Figure 6.. Loss of Blimp1 or Id2 impairs early CD4+ TRM differentiation.
(A) Representative histograms of Blimp1-YFP expression by SMARTA CD4+ T cells from spleen, mLN, and SI on day 7 or 21 following LCMV-Arm infection. (B) Quantification of Blimp-YFP+ cells of total SMARTA CD4+ T cells in indicated tissues. (C) Representative flow plots showing the frequency of WT and Blimp1-KO SMARTA CD4+ T cells in indicated tissues at specific time points. (D) Quantification of the frequency of WT and Blimp1-KO of total SMARTA CD4+ T cell population. (E) Representative flow plots of Id2-YFP and Id3-GFP expression by SMARTA CD4+ T cells from SPL, mLN, and SI on day 7 or 21 of infection. (F) Quantification of the frequency of Id2-YFP+ or ID2-YFP+Id3-GFP+ cells of total SMARTA CD4+ T cells. (G) Representative flow plots comparing the frequency of WT and Id2-KO SMARTA CD4+ T cells in indicated tissues at specific time points. (H) Quantification of the frequency of WT and Id2-KO of total SMARTA CD4+ T cell population. Numbers in flow plots or histograms indicate percent of cells in corresponding gate. (I) Ratio of number of SMARTA TH1 or TFH cells recovered at day 8 of infection (day 5 post-transfer) compared to number of SMARTA TH1 or TFH cells transferred at day 6 of infection. Data are representative (A,C,E,G) or cumulative (B,D,F,H,I) of 2–4 experiments with n=2–4 mice per experiments. Graphs show mean ± SD; *p < 0.05, ** p<0.01, *** p<0.001, ****p< 0.0001. One way ANOVA (B, D, F, H) or paired t-test (I) was performed for statistical significance.
Figure 7.
Figure 7.. Loss of Bcl6 at day 7 enhances the TRM differentiation program.
(A) Representative flow plots showing the frequency of WT and Bcl6-KO SMARTA CD4+ T cells in indicated tissues at specific time of infection. (B) Quantification of the frequency of WT and Bcl6-KO of total SMARTA CD4+ T cell population. (C,D) Bulk RNAseq of WT and Bcl6-KO SMARTA CD4+ T cells from SPL and SI, harvested at day 7 of LCMV-Arm infection. (C) Principal component analysis (PCA) of RNAseq data. (D) Gene enrichment analysis (GSEA) of indicated gene signatures in day 7 RNAseq data. (E-F) Single-cell RNAseq analysis of WT and Bcl6-KO SMARTA CD4+ T cells from SPL and SI, harvested at day 7 and 21 of LCMV-Arm infection. Violin plots showing relative enrichment of indicated gene signature (E) or relative gene expression of indicated gene (F). Data are representative (A), or cumulative (B-F) of 3 experiments with n=2–4 mice (A-B) or 2–3 replicates of cells pooled from 5–12 mice per replicate (C-F). Graphs show mean ± SD; *p < 0.05, ** p<0.01, *** p<0.001, ****p<0.0001. One way ANOVA was performed for statistical significance (B).

References

    1. Zhu J, Yamane H, Paul WE, Differentiation of Effector CD4 T Cell Populations. Annu. Rev. Immunol 28, 445–89 (2010). - PMC - PubMed
    1. Williams MA, V Ravkov E, Bevan MJ, Rapid Culling of the CD4 + T Cell Repertoire in the Transition from Effector to Memory. Immunity. 28, 533–545 (2008). - PMC - PubMed
    1. Pepper M, Linehan JL, Pagán AJ, Zell T, Dileepan T, Cleary PP, Jenkins MK, Different routes of bacterial infection induce long-lived TH1 memory cells and short-lived TH17 cells. Nat. Immunol 11, 83–89 (2010). - PMC - PubMed
    1. Pepper M, Pagán AJ, Igyá BZ, Taylor JJ, Jenkins MK, Igyártó BZ, Taylor JJ, Jenkins MK, Opposing Signals from the Bcl6 Transcription Factor and the Interleukin-2 Receptor Generate T Helper 1 Central and Effector Memory Cells. Immunity. 35, 583–595 (2011). - PMC - PubMed
    1. Hale JS, Youngblood B, Latner DR, Ur A, Mohammed R, Ye L, Akondy RS, Wu T, Iyer SS, Ahmed R, Mohammed AUR, Ye L, Akondy RS, Wu T, Iyer SS, Ahmed R, Distinct memory CD4+ T cells with commitment to T follicular helper- and T helper 1-cell lineages are generated after acute viral infection. Immunity. 38, 805–817 (2013). - PMC - PubMed

Publication types