. 2023 Sep 14;142(11):989-1007.
doi: 10.1182/blood.2022018718.

Paralog-specific signaling by IRAK1/4 maintains MyD88-independent functions in MDS/AML

Affiliations

Paralog-specific signaling by IRAK1/4 maintains MyD88-independent functions in MDS/AML

Joshua Bennett et al. Blood. .

Abstract

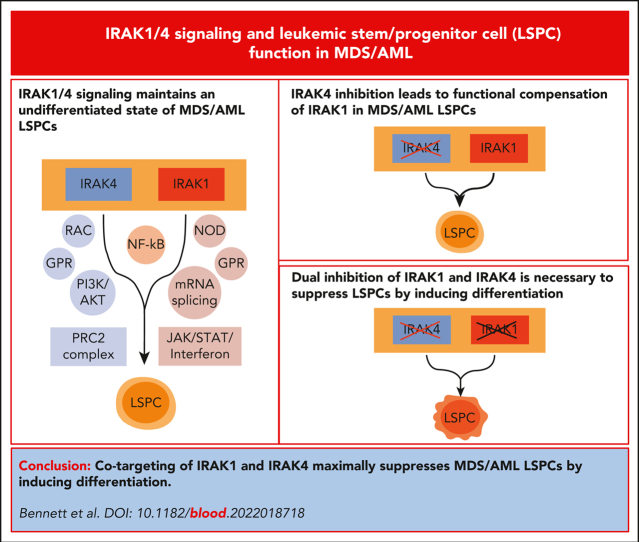
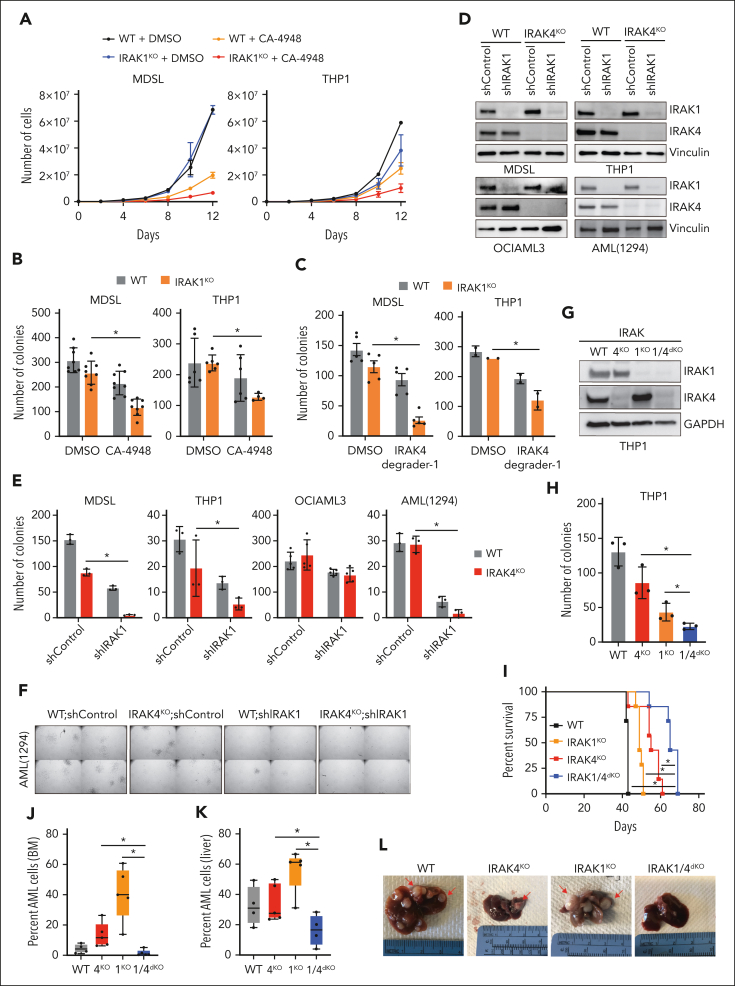
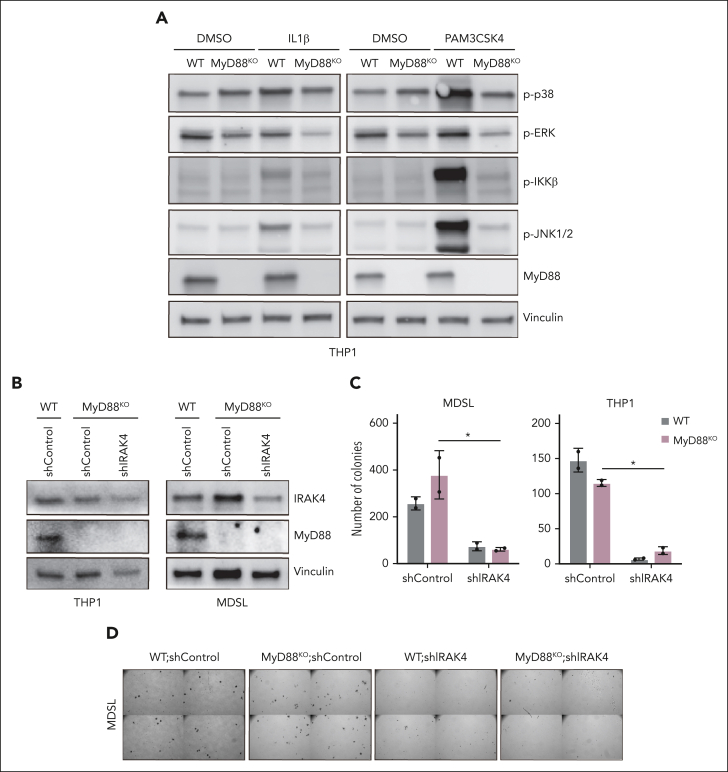
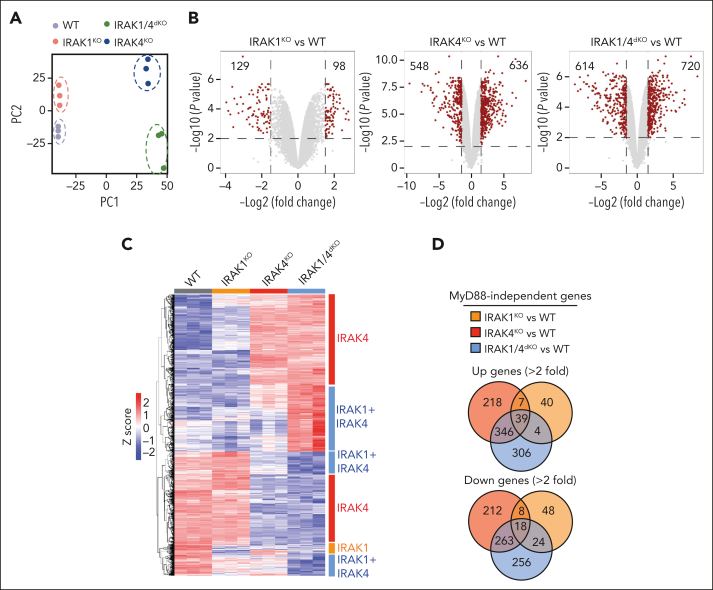
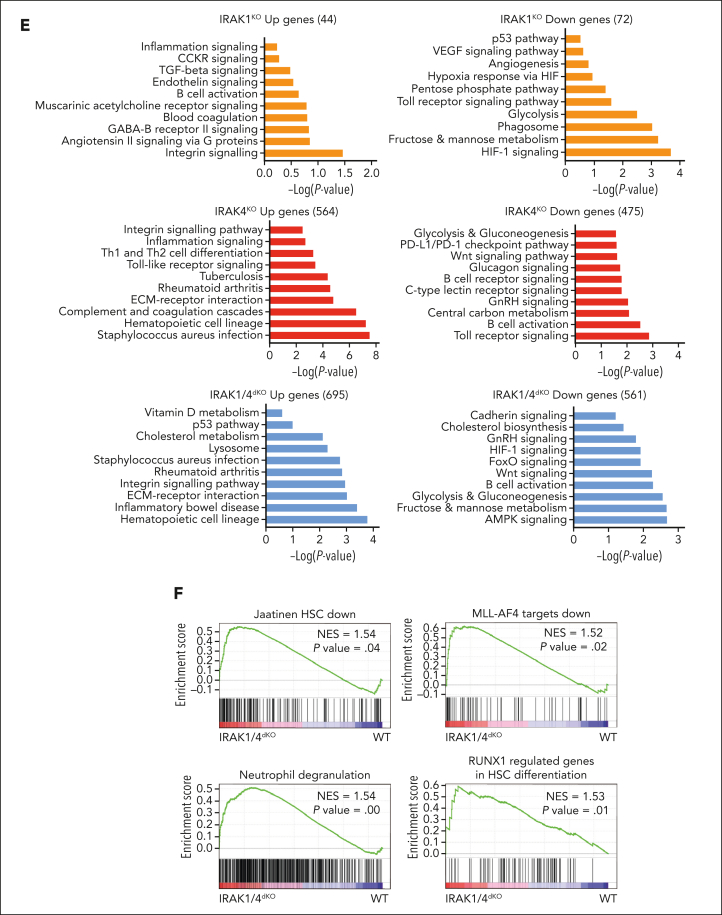
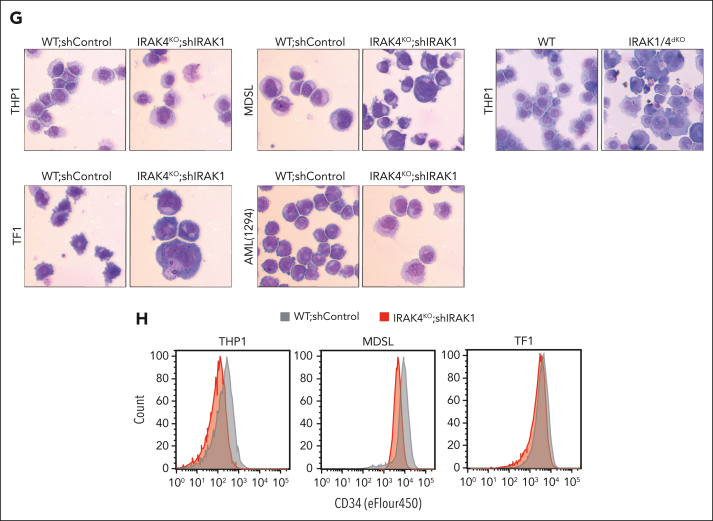
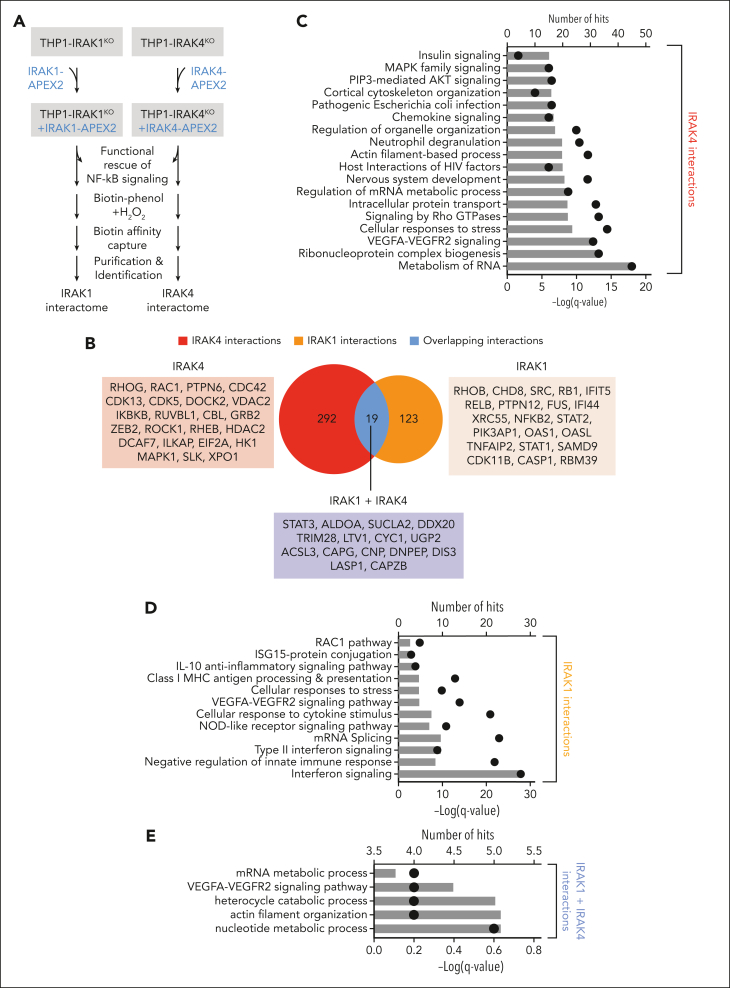
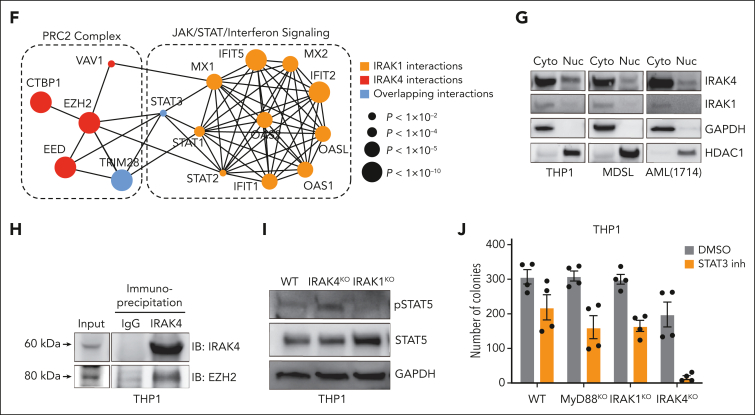
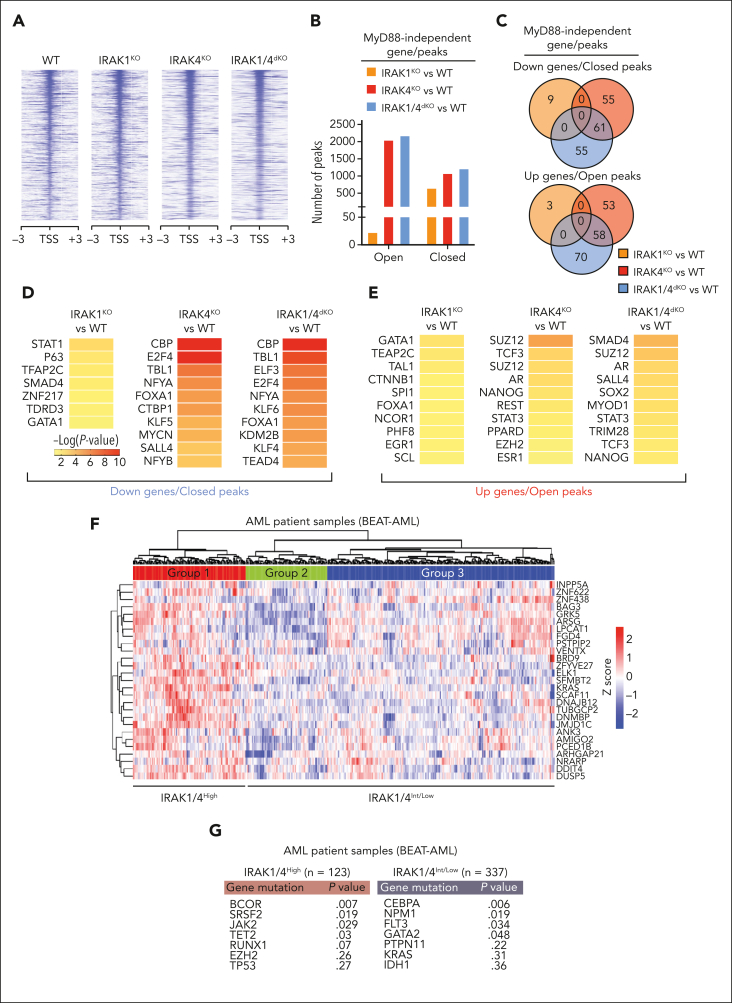
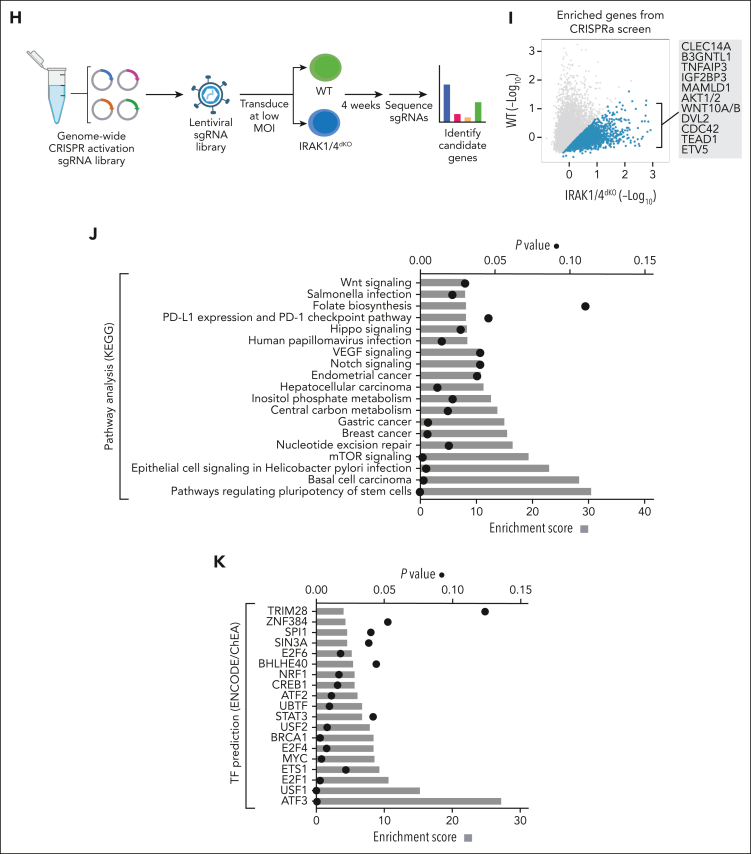
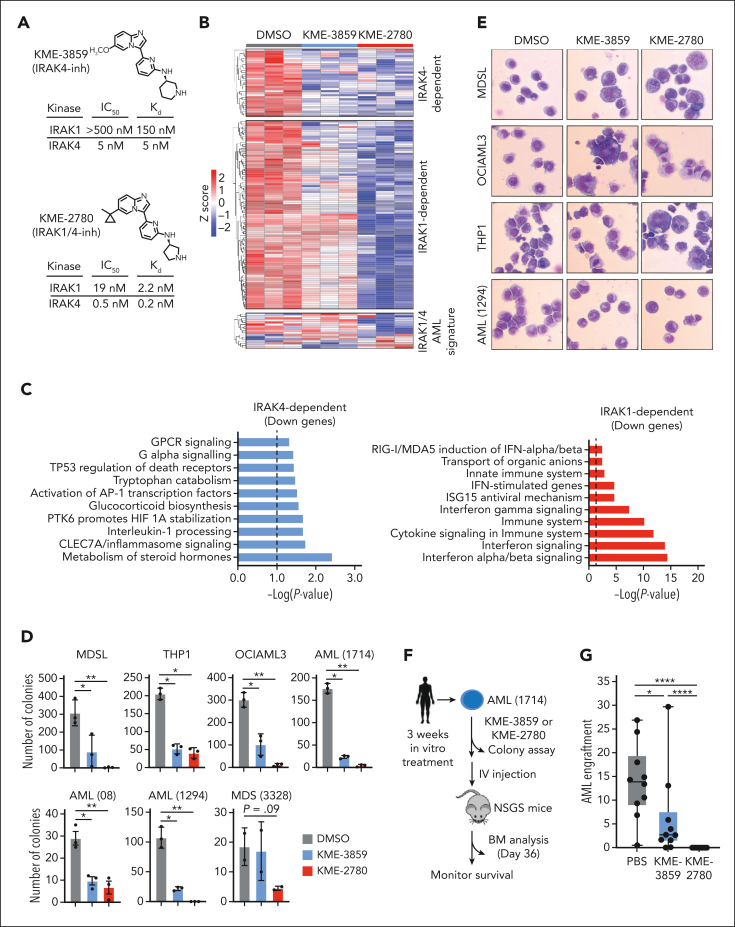
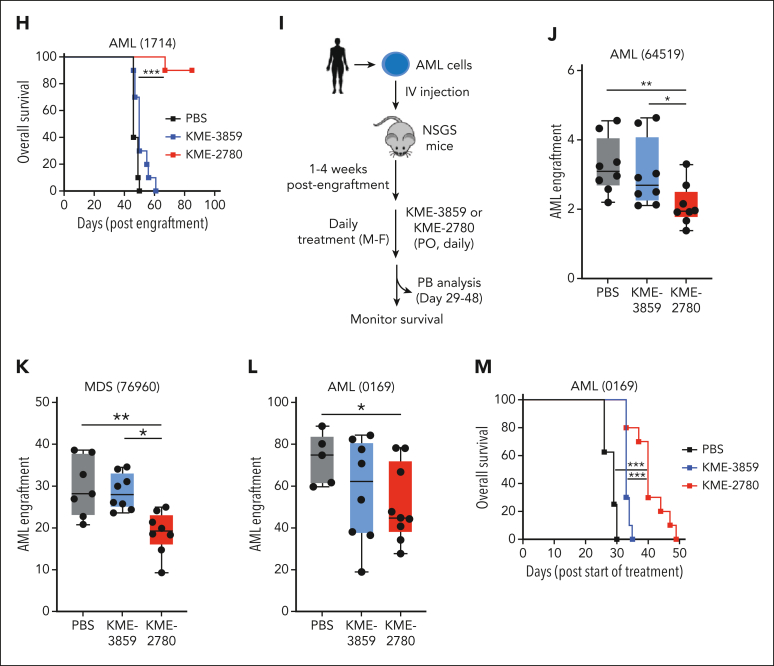
Dysregulation of innate immune signaling is a hallmark of hematologic malignancies. Recent therapeutic efforts to subvert aberrant innate immune signaling in myelodysplastic syndrome (MDS) and acute myeloid leukemia (AML) have focused on the kinase IRAK4. IRAK4 inhibitors have achieved promising, though moderate, responses in preclinical studies and clinical trials for MDS and AML. The reasons underlying the limited responses to IRAK4 inhibitors remain unknown. In this study, we reveal that inhibiting IRAK4 in leukemic cells elicits functional complementation and compensation by its paralog, IRAK1. Using genetic approaches, we demonstrate that cotargeting IRAK1 and IRAK4 is required to suppress leukemic stem/progenitor cell (LSPC) function and induce differentiation in cell lines and patient-derived cells. Although IRAK1 and IRAK4 are presumed to function primarily downstream of the proximal adapter MyD88, we found that complementary and compensatory IRAK1 and IRAK4 dependencies in MDS/AML occur via noncanonical MyD88-independent pathways. Genomic and proteomic analyses revealed that IRAK1 and IRAK4 preserve the undifferentiated state of MDS/AML LSPCs by coordinating a network of pathways, including ones that converge on the polycomb repressive complex 2 complex and JAK-STAT signaling. To translate these findings, we implemented a structure-based design of a potent and selective dual IRAK1 and IRAK4 inhibitor KME-2780. MDS/AML cell lines and patient-derived samples showed significant suppression of LSPCs in xenograft and in vitro studies when treated with KME-2780 as compared with selective IRAK4 inhibitors. Our results provide a mechanistic basis and rationale for cotargeting IRAK1 and IRAK4 for the treatment of cancers, including MDS/AML.


Conflict of interest statement

Conflict-of-interest disclosure: D.T.S. serves on the scientific advisory board at Kurome Therapeutics; is a consultant for and/or received funding from Kurome Therapeutics, Captor Therapeutics, Treeline Biosciences, and Tolero Therapeutics; and has equity in Kurome Therapeutics. L.C.B. consulted for Kurome Therapeutics. J.R. is employed by, and holds equity in, Kurome Therapeutics; holds equity in Airway Therapeutics; and is a consultant for Radius Health and MoglingBio. A.K. is employed by, and holds equity in, Kurome Therapeutics. The remaining authors declare no competing financial interests.

Figures

None
Graphical abstract
Figure 1.
Figure 1.
IRAK4 inhibition causes the activation of IRAK1. (A) Colony formation in a panel of MDS/AML cell lines and patient-derived samples treated with the indicated concentrations of CA-4948 (2 independent experiments). (B) Immunoblots for IRAK4 in WT and IRAK4KO AML cell lines and patient-derived samples. (C) Colony formation of WT and IRAK4KO AML cell lines and patient-derived samples. (D) Experimental overview: RNA sequencing was performed using WT and IRAK4KO THP1 cells, and THP1 cells were treated for 24 hours with the indicated inhibitors. Genes upregulated upon IRAK4 deficiency or chemical inhibition were used to annotate compensatory pathways. (E) Venn diagrams of overlapping upregulated genes upon IRAK4 deficiency or IRAK4 chemical inhibition. (F) Pathway enrichment of Kyoto Encyclopedia of Genes and Genomes (KEGG) data sets using overlapping genes increased upon the treatment with IRAK4 inhibitors. (G) Pathway enrichment of KEGG data sets using overlapping genes increased upon treatment with IRAK4 degrader-1 or after the deletion of IRAK4. (H) Overview of canonical Myd88-dependent signaling: upon TLR ligation, MyD88 nucleates a complex with IRAK4, which signals through IRAK1 and/or IRAK2 and then TRAF6 to activate the NF-κB and MAPK pathways. (I) Immunoblots for IRAK1, IRAK2, TRAF6, and MyD88 in WT and IRAK4KO AML cell lines and patient-derived samples. (J) Immunoblots for phoshpo-IRAK1, total IRAK1, and IRAK4 in WT and IRAK4KO cell lines. (K) Immunoblots for phoshpo-IRAK1, total IRAK1, and IRAK4 in MDSL and THP1 cells treated for 24 hours with IRAK4 degrader-1. (L) Immunoblots for phospho-IRAK1, total IRAK1, IRAK2, and IRAK4 in MDSL and AML (1714) treated for 24 hours with CA-4948 (10 μM). Significance was determined with a Student t test (∗P < .05). Error bars represent the standard deviation.
Figure 1.
Figure 1.
IRAK4 inhibition causes the activation of IRAK1. (A) Colony formation in a panel of MDS/AML cell lines and patient-derived samples treated with the indicated concentrations of CA-4948 (2 independent experiments). (B) Immunoblots for IRAK4 in WT and IRAK4KO AML cell lines and patient-derived samples. (C) Colony formation of WT and IRAK4KO AML cell lines and patient-derived samples. (D) Experimental overview: RNA sequencing was performed using WT and IRAK4KO THP1 cells, and THP1 cells were treated for 24 hours with the indicated inhibitors. Genes upregulated upon IRAK4 deficiency or chemical inhibition were used to annotate compensatory pathways. (E) Venn diagrams of overlapping upregulated genes upon IRAK4 deficiency or IRAK4 chemical inhibition. (F) Pathway enrichment of Kyoto Encyclopedia of Genes and Genomes (KEGG) data sets using overlapping genes increased upon the treatment with IRAK4 inhibitors. (G) Pathway enrichment of KEGG data sets using overlapping genes increased upon treatment with IRAK4 degrader-1 or after the deletion of IRAK4. (H) Overview of canonical Myd88-dependent signaling: upon TLR ligation, MyD88 nucleates a complex with IRAK4, which signals through IRAK1 and/or IRAK2 and then TRAF6 to activate the NF-κB and MAPK pathways. (I) Immunoblots for IRAK1, IRAK2, TRAF6, and MyD88 in WT and IRAK4KO AML cell lines and patient-derived samples. (J) Immunoblots for phoshpo-IRAK1, total IRAK1, and IRAK4 in WT and IRAK4KO cell lines. (K) Immunoblots for phoshpo-IRAK1, total IRAK1, and IRAK4 in MDSL and THP1 cells treated for 24 hours with IRAK4 degrader-1. (L) Immunoblots for phospho-IRAK1, total IRAK1, IRAK2, and IRAK4 in MDSL and AML (1714) treated for 24 hours with CA-4948 (10 μM). Significance was determined with a Student t test (∗P < .05). Error bars represent the standard deviation.
Figure 2.
Figure 2.
The inhibition of IRAK1 confers an exaggerated leukemic defect to IRAK4-deficient AML. (A) Growth curves of WT and IRAK1KO MDSL and THP1 cells treated with CA-4948 (10 μM) or vehicle (2 independent experiments). (B) Colony formation of WT and IRAK1KO MDSL and THP1 cells treated with CA-4948 (30 μM) or vehicle (3 independent experiments). (C) Colony formation of WT and IRAK1KO MDSL and THP1 cells treated with IRAK4 degrader-1 (MDSL, 5 μM; THP1, 10 μM) or vehicle. (D) Immunoblots for IRAK1 and IRAK4 in WT and IRAK4KO cell lines transduced with nontargeting control short hairpin RNA (shRNA; shControl) or shIRAK1. (E) Colony formation of WT and IRAK4KO AML cell lines transduced with nontargeting control shRNA (shControl) or shIRAK1. (F) Representative colony images of WT and IRAK4KO AML (1294) cells transduced with nontarget control shRNA (shControl) or shIRAK1 (original magnification ×40). (G) Immunoblots for IRAK1 and IRAK4 in WT, IRAK4KO, IRAK1KO, and IRAK1/4dKO THP1 cells. (H) Colony formation of isogenic THP1 cells. (I) Kaplan-Meier survival analysis of NSGS mice (n = 7 mice per group) that received engraftment with WT, IRAK4KO, IRAK1KO, and IRAK1/4dKO THP1 cells (Data represent 1 of 2 independent experiments with similar trends). (J) Bone marrow engraftment of WT (n = 4), IRAK4KO (n = 5), IRAK1KO (n = 5), and IRAK1/4dKO (n = 5) THP1 cells in NSGS mice that underwent xenograftment at the time of death. Leukemic engraftment was determined as the percentage of huCD45+huCD33+ cells. (K) Liver engraftment of WT (n = 4), IRAK4KO (n = 5), IRAK1KO (n = 5), and IRAK1/4dKO (n = 5) THP1 cells in NSGS mice that underwent xenograftment at the time of death. Leukemic engraftment was determined as the percentage of huCD45+huCD33+ cells normalized to the number of days. (L) Representative images of livers collected from NSGS mice that underwent xenograftment with WT, IRAK4KO, IRAK1KO, and IRAK1/4dKO THP1 cells. Arrows indicate examples of AML cell infiltration. Significance was determined with a Student t test (∗P < .05). Error bars represent the standard deviation.
Figure 3.
Figure 3.
MyD88 is dispensable for MDS/AML LSPCs. (A) Immunoblots for MyD88 and the activation of downstream pathways (phospho-p38, phospho-JNK, phospho-IKK, and phospho- extracellular signal-regulated kinase) in WT and MYD88KO THP1 cells upon a 30-minute treatment with IL-1β (10 ng/µL) or the TLR1/2 ligand PAM3CSK4 (1 µg/mL) as compared with DMSO. (B) Immunoblots for IRAK4 and MyD88 in WT and MYD88KO THP1 and MDSL cells transduced with nontargeting shControl or shIRAK4. (C) Colony formation of WT and MYD88KO THP1 and MDSL cells transduced with nontargeting shControl or shIRAK4. (D) Representative colony images of WT and MyD88KO MDSL cells transduced with nontargeting shControl or shIRAK4 (original magnification ×40). Significance was determined with a Student t test (∗P < .05). Error bars represent the standard deviation. DMSO, dimethyl sulfoxide.
Figure 4.
Figure 4.
Noncanonical IRAK1/4 signaling is essential for maintaining MDS/AML LSPCs. (A) Principal component analysis of gene expression profiles of WT, IRAK4KO, IRAK1KO, and IRAK1/4dKO THP1 cells. (B) Volcano plots of differentially expressed genes in IRAK4KO, IRAK1KO, and IRAK1/4dKO THP1 cells relative to WT THP1 cells (>2-fold change; ∗P < .05). (C) Heatmap of differentially expressed genes in IRAK4KO, IRAK1KO, and IRAK1/4dKO THP1 relative to WT. Bars on the right denote differentially expressed genes attributed to the deficiency of IRAK4 (red) or IRAK1 (orange), or are unique to IRAK1/4dKO (blue). (D) Venn diagrams of overlapping upregulated or downregulated genes in IRAK4KO, IRAK1KO, and IRAK1/4dKO relative to WT THP1. (E) Pathway enrichment of KEGG data sets of upregulated and downregulated genes in IRAK4KO, IRAK1KO, and IRAK1/4dKO THP1 cells. (F) Gene set enrichment analysis of genes dysregulated in IRAK1/4dKO vs WT THP1 cells. Absolute normalized enrichment score and the corresponding P value is shown for each pathway. (G) Representative Wright-Giemsa stains of WT and IRAK4KO cells expressing nontargeting shControl and shIRAK1, respectively (original magnification ×40). (H) Immunophenotyping of the indicated cells for CD34 expression.
Figure 4.
Figure 4.
Noncanonical IRAK1/4 signaling is essential for maintaining MDS/AML LSPCs. (A) Principal component analysis of gene expression profiles of WT, IRAK4KO, IRAK1KO, and IRAK1/4dKO THP1 cells. (B) Volcano plots of differentially expressed genes in IRAK4KO, IRAK1KO, and IRAK1/4dKO THP1 cells relative to WT THP1 cells (>2-fold change; ∗P < .05). (C) Heatmap of differentially expressed genes in IRAK4KO, IRAK1KO, and IRAK1/4dKO THP1 relative to WT. Bars on the right denote differentially expressed genes attributed to the deficiency of IRAK4 (red) or IRAK1 (orange), or are unique to IRAK1/4dKO (blue). (D) Venn diagrams of overlapping upregulated or downregulated genes in IRAK4KO, IRAK1KO, and IRAK1/4dKO relative to WT THP1. (E) Pathway enrichment of KEGG data sets of upregulated and downregulated genes in IRAK4KO, IRAK1KO, and IRAK1/4dKO THP1 cells. (F) Gene set enrichment analysis of genes dysregulated in IRAK1/4dKO vs WT THP1 cells. Absolute normalized enrichment score and the corresponding P value is shown for each pathway. (G) Representative Wright-Giemsa stains of WT and IRAK4KO cells expressing nontargeting shControl and shIRAK1, respectively (original magnification ×40). (H) Immunophenotyping of the indicated cells for CD34 expression.
Figure 5.
Figure 5.
IRAK1 and IRAK4 interactomes reveal noncanonical signaling in AML. (A) Experimental overview of IRAK1 and IRAK4 proximity labeling in THP1 cells: Doxycycline-inducible IRAK4- and IRAK1-APEX2 fusion constructs were transduced into IRAK4KO and IRAK1KO THP1 cells, respectively. Functional rescue of canonical signaling was confirmed in NF-κB assays. Biotin phenol was added to induce proximity labeling with biotin. Biotinylated proteins were isolated and identified via mass spectrometry. (B) Venn diagram of unique and overlapping proteins in the IRAK4 and IRAK1 proximal proteins. (C) Pathway enrichment using IRAK4-specific proximal proteins. Bars represent the number of IRAK4 interacting proteins that appear in the designated pathway. Dots represent the −log(q value) of the pathway enrichment. (D) Pathway enrichment using IRAK1-specific proximal proteins. Bars represent the number of IRAK1 interacting proteins that appear in the designated pathway. Dots represent the −log(q value) of the pathway enrichment. (E) Pathway enrichment using proximal proteins common to IRAK1 and IRAK4. Bars represent the number of interacting proteins that appear in the designated pathway. Dots represent the −log(q value) of the pathway enrichment. (F) Interaction map highlighting IRAK4 interactors in the PRC2 complex and IRAK1 interactors in JAK/STAT/interferon signaling. Circle sizes indicate the adjusted P value for the identified interaction with IRAK1 or IRAK4. (G) Immunoblots for IRAK1 and IRAK4 in the nuclear (Nuc) and cytoplasmic (Cyto) fractions isolated from the indicated cells. (H) Immunoprecipitation of IRAK4 (or immunoglobulin G control) followed by immunoblotting of IRAK4 and EZH2 from THP1 cells. (I) Immunoblots for phospho-STAT5 and STAT5 in WT, IRAK4KO, and IRAK1KO THP1 cells. (J) Colony formation of MyD88KO, IRAK1KO, and IRAK4KO THP1 cells treated with DMSO or BBI608 (STAT3 inhibitor) (500 nM). Error bars represent the standard error of the mean. DMSO, dimethyl sulfoxide.
Figure 5.
Figure 5.
IRAK1 and IRAK4 interactomes reveal noncanonical signaling in AML. (A) Experimental overview of IRAK1 and IRAK4 proximity labeling in THP1 cells: Doxycycline-inducible IRAK4- and IRAK1-APEX2 fusion constructs were transduced into IRAK4KO and IRAK1KO THP1 cells, respectively. Functional rescue of canonical signaling was confirmed in NF-κB assays. Biotin phenol was added to induce proximity labeling with biotin. Biotinylated proteins were isolated and identified via mass spectrometry. (B) Venn diagram of unique and overlapping proteins in the IRAK4 and IRAK1 proximal proteins. (C) Pathway enrichment using IRAK4-specific proximal proteins. Bars represent the number of IRAK4 interacting proteins that appear in the designated pathway. Dots represent the −log(q value) of the pathway enrichment. (D) Pathway enrichment using IRAK1-specific proximal proteins. Bars represent the number of IRAK1 interacting proteins that appear in the designated pathway. Dots represent the −log(q value) of the pathway enrichment. (E) Pathway enrichment using proximal proteins common to IRAK1 and IRAK4. Bars represent the number of interacting proteins that appear in the designated pathway. Dots represent the −log(q value) of the pathway enrichment. (F) Interaction map highlighting IRAK4 interactors in the PRC2 complex and IRAK1 interactors in JAK/STAT/interferon signaling. Circle sizes indicate the adjusted P value for the identified interaction with IRAK1 or IRAK4. (G) Immunoblots for IRAK1 and IRAK4 in the nuclear (Nuc) and cytoplasmic (Cyto) fractions isolated from the indicated cells. (H) Immunoprecipitation of IRAK4 (or immunoglobulin G control) followed by immunoblotting of IRAK4 and EZH2 from THP1 cells. (I) Immunoblots for phospho-STAT5 and STAT5 in WT, IRAK4KO, and IRAK1KO THP1 cells. (J) Colony formation of MyD88KO, IRAK1KO, and IRAK4KO THP1 cells treated with DMSO or BBI608 (STAT3 inhibitor) (500 nM). Error bars represent the standard error of the mean. DMSO, dimethyl sulfoxide.
Figure 6.
Figure 6.
IRAK1/4 maintains undifferentiated leukemic cell states through chromatin and transcription factor networks. (A) Heatmap of chromatin accessibility (assay for transposase-accessible chromatin sequencing) peaks within a 3 kb distance of transcription start sites of genes in WT, IRAK1KO, IRAK4KO, and IRAK1/4dKO THP1 cells. (B) The total number of accessibility peaks lost and acquired in IRAK1KO, IRAK4KO, and IRAK1/4dKO THP1 relative to WT cells. (C) Venn diagrams of overlap genes that are associated with both differential expression (RNA sequencing) and concordant changes in chromatin accessibility (assay for transposase-accessible chromatin sequencing) in IRAK1KO, IRAK4KO, and IRAK1/4dKO THP1 cells. (D-E) Heatmaps of transcription factor enrichment among genes associated with the downregulation and loss of chromatin peaks (D) or the upregulation and acquisition of open chromatin peaks (E) in IRAK1KO, IRAK4KO, and IRAK1/4dKO THP1 cells relative to WT cells. Enrichment of transcription factor signatures was determined with the Chromatin Immunoprecipitation (ChIP) Enrichment Analysis (ChEA) 2022 library. Color intensity reflects the Log (P value) of the enrichment score. (F) Heatmap of differential gene expression in patients with AML (relative to healthy controls) using gene expression data curated from the Beat AML data set. The heatmap represents a subset of genes that are downregulated and associated with the loss of chromatin accessibility in IRAK1/4dKO THP1 (IRAK1/4 gene signature). Unsupervised hierarchical clustering analysis resolved distinct cohorts of IRAK1/4-high signature (Group 1) and IRAK1/4-low/intermediate signature (Groups 2 and 3) patients with AML. (G) Enrichment of AML-associated mutations in IRAK1/4-high signature (Group 1) and IRAK1/4-low/intermediate signature (Groups 2 and 3) Patients with AML (from panel F) based on hypergeometric testing. (H) Schematic diagram of the CRISPR activation screen. WT and IRAK1/4dKO THP1 cells were transduced with the pooled sgRNA library targeting more than 18 000 coding isoforms. After 3 weeks, deep sequencing was performed to identify candidate genes. (I) Average Model-based Analysis of Genome-wide CRISPR-Cas9 Knockout (MAGeCK) score for candidate genes from WT and IRAK1/4dKO THP1 replicate samples. Blue circles represent genes selectively enriched in IRAK1/4dKO THP1 cells. (J) Most significant pathways (KEGG analysis) selectively enriched in IRAK1/4dKO THP1 cells among the top 438 candidate genes (based on fold change and P value). (K) Most significant transcription factors (ENCODE/ChEA analysis) selectively enriched in IRAK1/4dKO THP1 cells among the top 438 candidate genes.
Figure 6.
Figure 6.
IRAK1/4 maintains undifferentiated leukemic cell states through chromatin and transcription factor networks. (A) Heatmap of chromatin accessibility (assay for transposase-accessible chromatin sequencing) peaks within a 3 kb distance of transcription start sites of genes in WT, IRAK1KO, IRAK4KO, and IRAK1/4dKO THP1 cells. (B) The total number of accessibility peaks lost and acquired in IRAK1KO, IRAK4KO, and IRAK1/4dKO THP1 relative to WT cells. (C) Venn diagrams of overlap genes that are associated with both differential expression (RNA sequencing) and concordant changes in chromatin accessibility (assay for transposase-accessible chromatin sequencing) in IRAK1KO, IRAK4KO, and IRAK1/4dKO THP1 cells. (D-E) Heatmaps of transcription factor enrichment among genes associated with the downregulation and loss of chromatin peaks (D) or the upregulation and acquisition of open chromatin peaks (E) in IRAK1KO, IRAK4KO, and IRAK1/4dKO THP1 cells relative to WT cells. Enrichment of transcription factor signatures was determined with the Chromatin Immunoprecipitation (ChIP) Enrichment Analysis (ChEA) 2022 library. Color intensity reflects the Log (P value) of the enrichment score. (F) Heatmap of differential gene expression in patients with AML (relative to healthy controls) using gene expression data curated from the Beat AML data set. The heatmap represents a subset of genes that are downregulated and associated with the loss of chromatin accessibility in IRAK1/4dKO THP1 (IRAK1/4 gene signature). Unsupervised hierarchical clustering analysis resolved distinct cohorts of IRAK1/4-high signature (Group 1) and IRAK1/4-low/intermediate signature (Groups 2 and 3) patients with AML. (G) Enrichment of AML-associated mutations in IRAK1/4-high signature (Group 1) and IRAK1/4-low/intermediate signature (Groups 2 and 3) Patients with AML (from panel F) based on hypergeometric testing. (H) Schematic diagram of the CRISPR activation screen. WT and IRAK1/4dKO THP1 cells were transduced with the pooled sgRNA library targeting more than 18 000 coding isoforms. After 3 weeks, deep sequencing was performed to identify candidate genes. (I) Average Model-based Analysis of Genome-wide CRISPR-Cas9 Knockout (MAGeCK) score for candidate genes from WT and IRAK1/4dKO THP1 replicate samples. Blue circles represent genes selectively enriched in IRAK1/4dKO THP1 cells. (J) Most significant pathways (KEGG analysis) selectively enriched in IRAK1/4dKO THP1 cells among the top 438 candidate genes (based on fold change and P value). (K) Most significant transcription factors (ENCODE/ChEA analysis) selectively enriched in IRAK1/4dKO THP1 cells among the top 438 candidate genes.
Figure 7.
Figure 7.
A dual IRAK1/4 inhibitor is more effective at suppressing MDS/AML as compared with a selective IRAK4 inhibitor. (A) Chemical structures of KME-3859 (IRAK4-inh) and KME-2780 (dual IRAK1/4-inh) with IC50 and Kd values for IRAK1 and IRAK4. (B) Heatmap of differentially expressed genes downregulated by both KME-3859 and KME-2780 (IRAK4-dependent), genes downregulated by KME-2780 (“IRAK1-dependent”), and genes representing the IRAK1/4 AML signature (from Figure 6F). (C) Pathway enrichment using KEGG of downregulated genes upon treatment with both KME-3859 and KME-2780 (IRAK4-dependent genes) as compared with vehicle control (top). Pathway enrichment using KEGG of downregulated genes upon the treatment with KME-2780 (IRAK1-dependent genes) as compared with KME-3859 and vehicle control (bottom). (D) Colony formation of MDSL (250 nM), THP1 (1 μM), OCIAML3 (1 μM), AML (1714) (1 μM), AML (1294) (1 μM), AML (08) (250 nM), and MDS (3328) (250 nM) cells treated with DMSO, KME-3859, or KME-2780. (E) Representative Wright-Giemsa stains of cells treated with vehicle (DMSO), KME-3859 (500 nM), or KME-2780 (500 nM) for 12 days (original magnification ×40). (F) Experimental overview: AML (1714) cells derived from patients were treated in vitro with vehicle (DMSO), KME-3859 (500 nM), or KME-2780 (500 nM) for 21 days. After the treatment, live cells were evaluated for colony formation in mice that received xenografts. (G) Bone marrow engraftment of AML (1714) cells in NSGS mice that received xenografts on day 36. Leukemic engraftment was determined as the percentage of huCD45+huCD33+ cells. (H) Kaplan-Meier survival analysis of NSGS mice (n = 10 mice per group) engrafted with AML (1714) cells pretreated with the indicated inhibitors. (I) Experimental overview: AML (64519), AML (0169), and MDS (76960) cells derived from patients were engrafted into NSGS mice. Two weeks after the engraftment, mice were randomly assigned to groups and treated orally daily with vehicle (PBS), KME-3859 (30 mg/kg), or KME-2780 (100 mg/kg). These concentrations were selected to equilibrate the free drug concentrations (supplemental Table 14). (J-L) Peripheral blood engraftment of AML (64519) (J), MDS (76960) (K), and AML (0169) (L) cells in NSGS mice that received xenografts on day 40, 48, and 29 after the treatment. Leukemic engraftment was determined as the percentage of huCD45+huCD33+ cells. (M) Kaplan-Meier survival analysis of NSGS mice (n = 8 mice/group) engrafted with AML (0169) cells and treated with the indicated inhibitors. Significance was determined with a Student t test (∗P < .05; ∗∗P < .01; ∗∗∗P < .001; ∗∗∗∗P < .0001). Error bars represent the standard error of the mean or standard deviation.
Figure 7.
Figure 7.
A dual IRAK1/4 inhibitor is more effective at suppressing MDS/AML as compared with a selective IRAK4 inhibitor. (A) Chemical structures of KME-3859 (IRAK4-inh) and KME-2780 (dual IRAK1/4-inh) with IC50 and Kd values for IRAK1 and IRAK4. (B) Heatmap of differentially expressed genes downregulated by both KME-3859 and KME-2780 (IRAK4-dependent), genes downregulated by KME-2780 (“IRAK1-dependent”), and genes representing the IRAK1/4 AML signature (from Figure 6F). (C) Pathway enrichment using KEGG of downregulated genes upon treatment with both KME-3859 and KME-2780 (IRAK4-dependent genes) as compared with vehicle control (top). Pathway enrichment using KEGG of downregulated genes upon the treatment with KME-2780 (IRAK1-dependent genes) as compared with KME-3859 and vehicle control (bottom). (D) Colony formation of MDSL (250 nM), THP1 (1 μM), OCIAML3 (1 μM), AML (1714) (1 μM), AML (1294) (1 μM), AML (08) (250 nM), and MDS (3328) (250 nM) cells treated with DMSO, KME-3859, or KME-2780. (E) Representative Wright-Giemsa stains of cells treated with vehicle (DMSO), KME-3859 (500 nM), or KME-2780 (500 nM) for 12 days (original magnification ×40). (F) Experimental overview: AML (1714) cells derived from patients were treated in vitro with vehicle (DMSO), KME-3859 (500 nM), or KME-2780 (500 nM) for 21 days. After the treatment, live cells were evaluated for colony formation in mice that received xenografts. (G) Bone marrow engraftment of AML (1714) cells in NSGS mice that received xenografts on day 36. Leukemic engraftment was determined as the percentage of huCD45+huCD33+ cells. (H) Kaplan-Meier survival analysis of NSGS mice (n = 10 mice per group) engrafted with AML (1714) cells pretreated with the indicated inhibitors. (I) Experimental overview: AML (64519), AML (0169), and MDS (76960) cells derived from patients were engrafted into NSGS mice. Two weeks after the engraftment, mice were randomly assigned to groups and treated orally daily with vehicle (PBS), KME-3859 (30 mg/kg), or KME-2780 (100 mg/kg). These concentrations were selected to equilibrate the free drug concentrations (supplemental Table 14). (J-L) Peripheral blood engraftment of AML (64519) (J), MDS (76960) (K), and AML (0169) (L) cells in NSGS mice that received xenografts on day 40, 48, and 29 after the treatment. Leukemic engraftment was determined as the percentage of huCD45+huCD33+ cells. (M) Kaplan-Meier survival analysis of NSGS mice (n = 8 mice/group) engrafted with AML (0169) cells and treated with the indicated inhibitors. Significance was determined with a Student t test (∗P < .05; ∗∗P < .01; ∗∗∗P < .001; ∗∗∗∗P < .0001). Error bars represent the standard error of the mean or standard deviation.

Comment in

References

    1. Pandolfi A, Barreyro L, Steidl U. Concise review: preleukemic stem cells: molecular biology and clinical implications of the precursors to leukemia stem cells. Stem Cells Transl Med. 2013;2(2):143–150. - PMC - PubMed
    1. Shastri A, Will B, Steidl U, Verma A. Stem and progenitor cell alterations in myelodysplastic syndromes. Blood. 2017;129(12):1586–1594. - PMC - PubMed
    1. Stauber J, Greally JM, Steidl U. Preleukemic and leukemic evolution at the stem cell level. Blood. 2021;137(8):1013–1018. - PMC - PubMed
    1. Daver N, Wei AH, Pollyea DA, Fathi AT, Vyas P, DiNardo CD. New directions for emerging therapies in acute myeloid leukemia: the next chapter. Blood Cancer J. 2020;10(10):107. - PMC - PubMed
    1. Krivtsov AV, Evans K, Gadrey JY, et al. A menin-MLL inhibitor induces specific chromatin changes and eradicates disease in models of MLL-rearranged leukemia. Cancer Cell. 2019;36(6):660–673.e11. - PMC - PubMed

Publication types

MeSH terms

Substances