. 2023 May 11;186(10):2111-2126.e20.
doi: 10.1016/j.cell.2023.04.022.

An in vivo neuroimmune organoid model to study human microglia phenotypes

Affiliations

An in vivo neuroimmune organoid model to study human microglia phenotypes

Simon T Schafer et al. Cell. .

Abstract

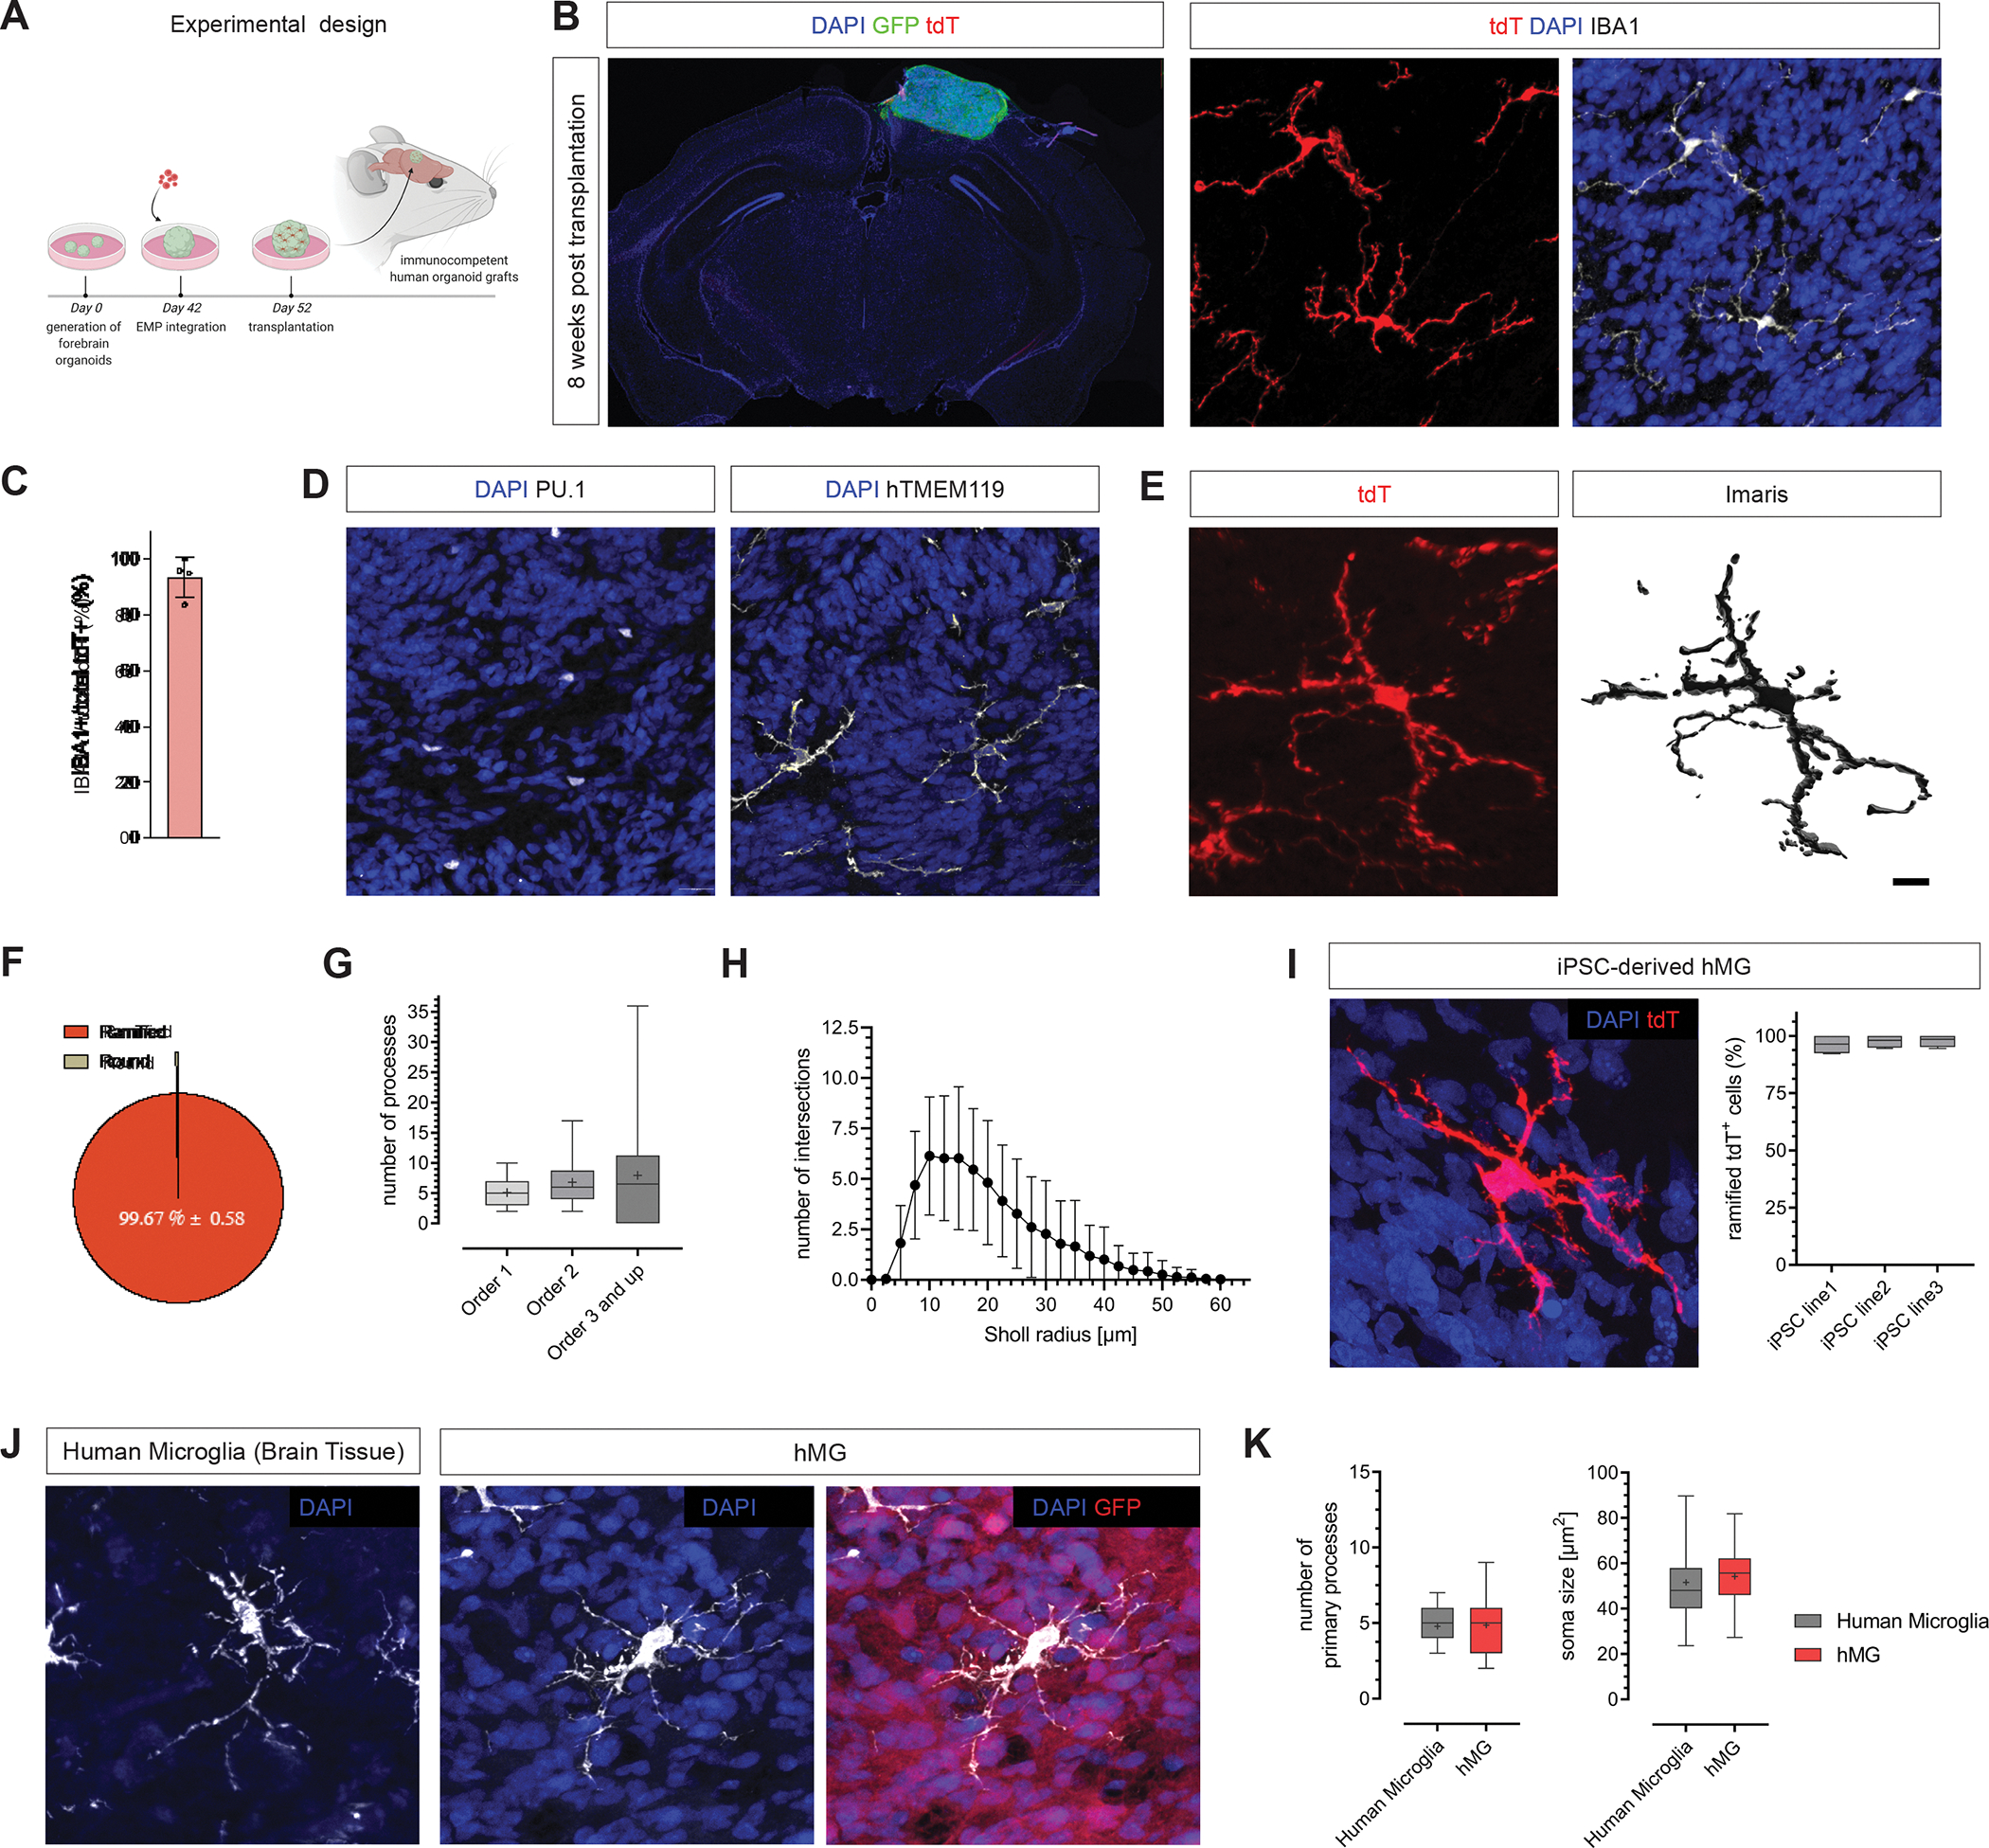
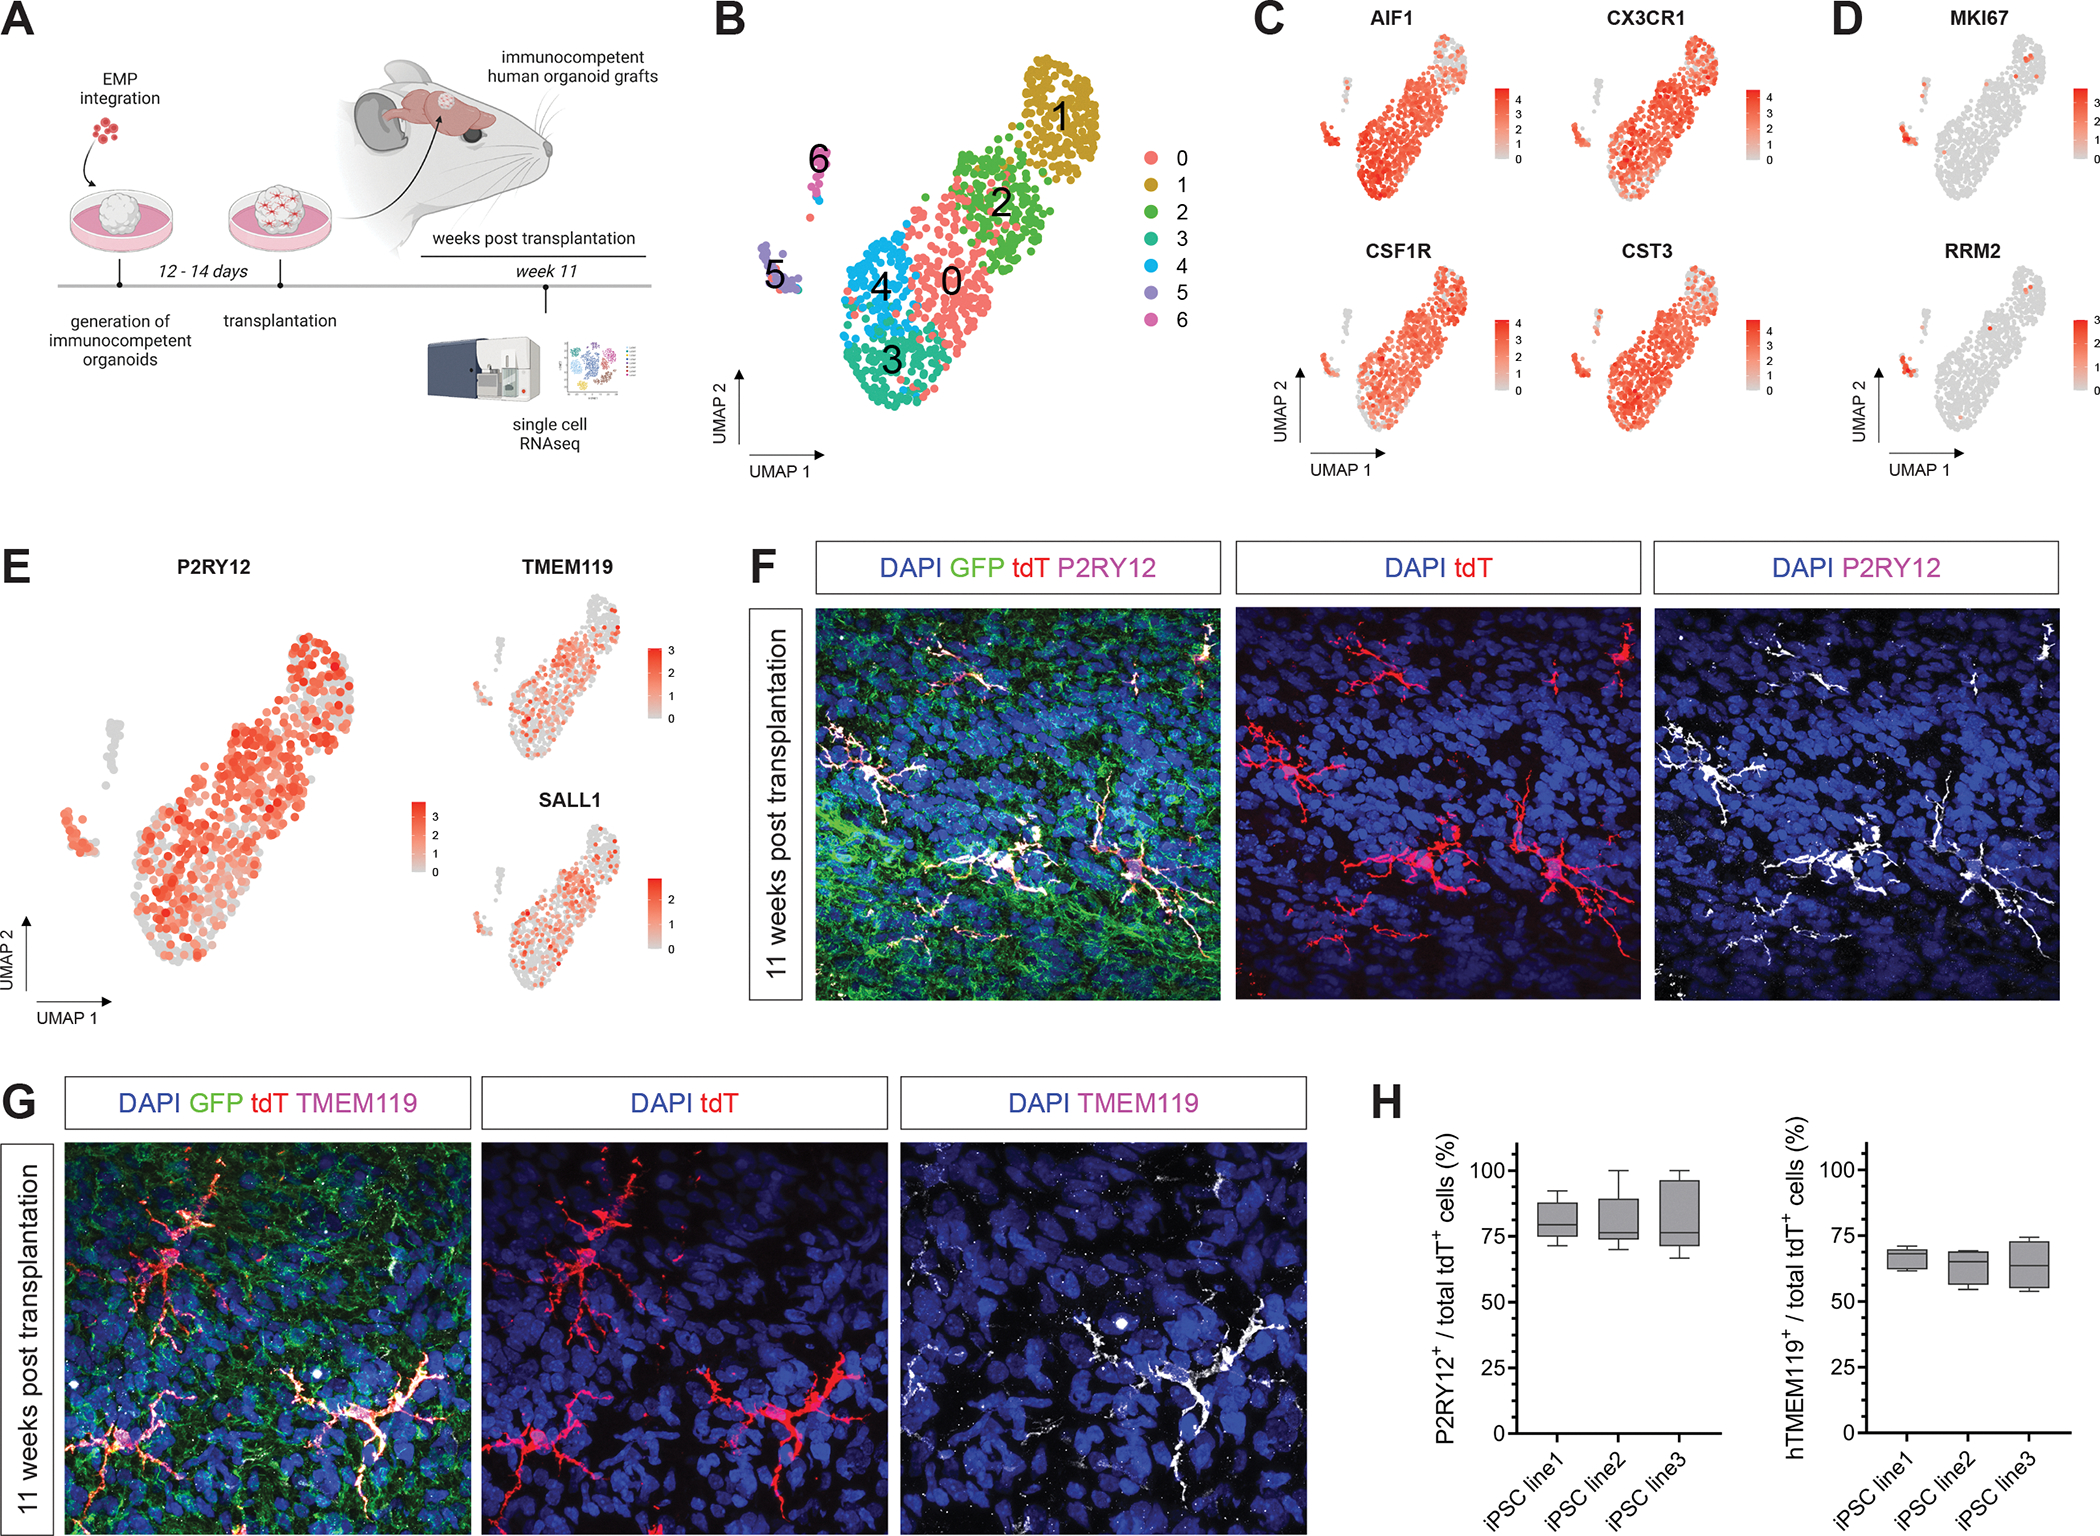
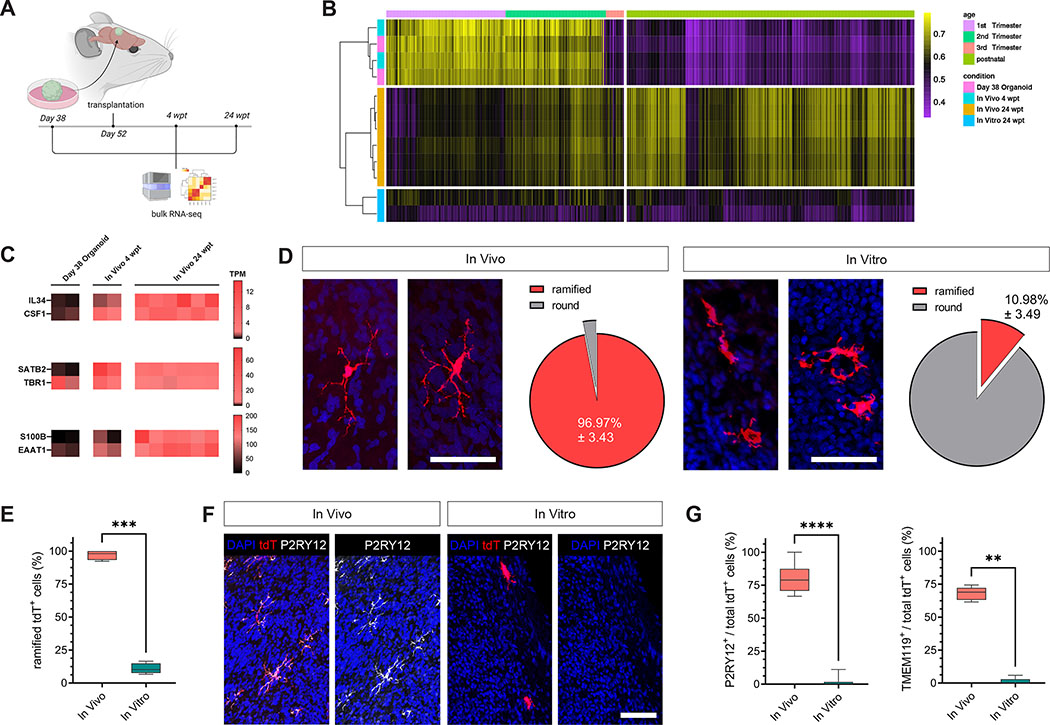
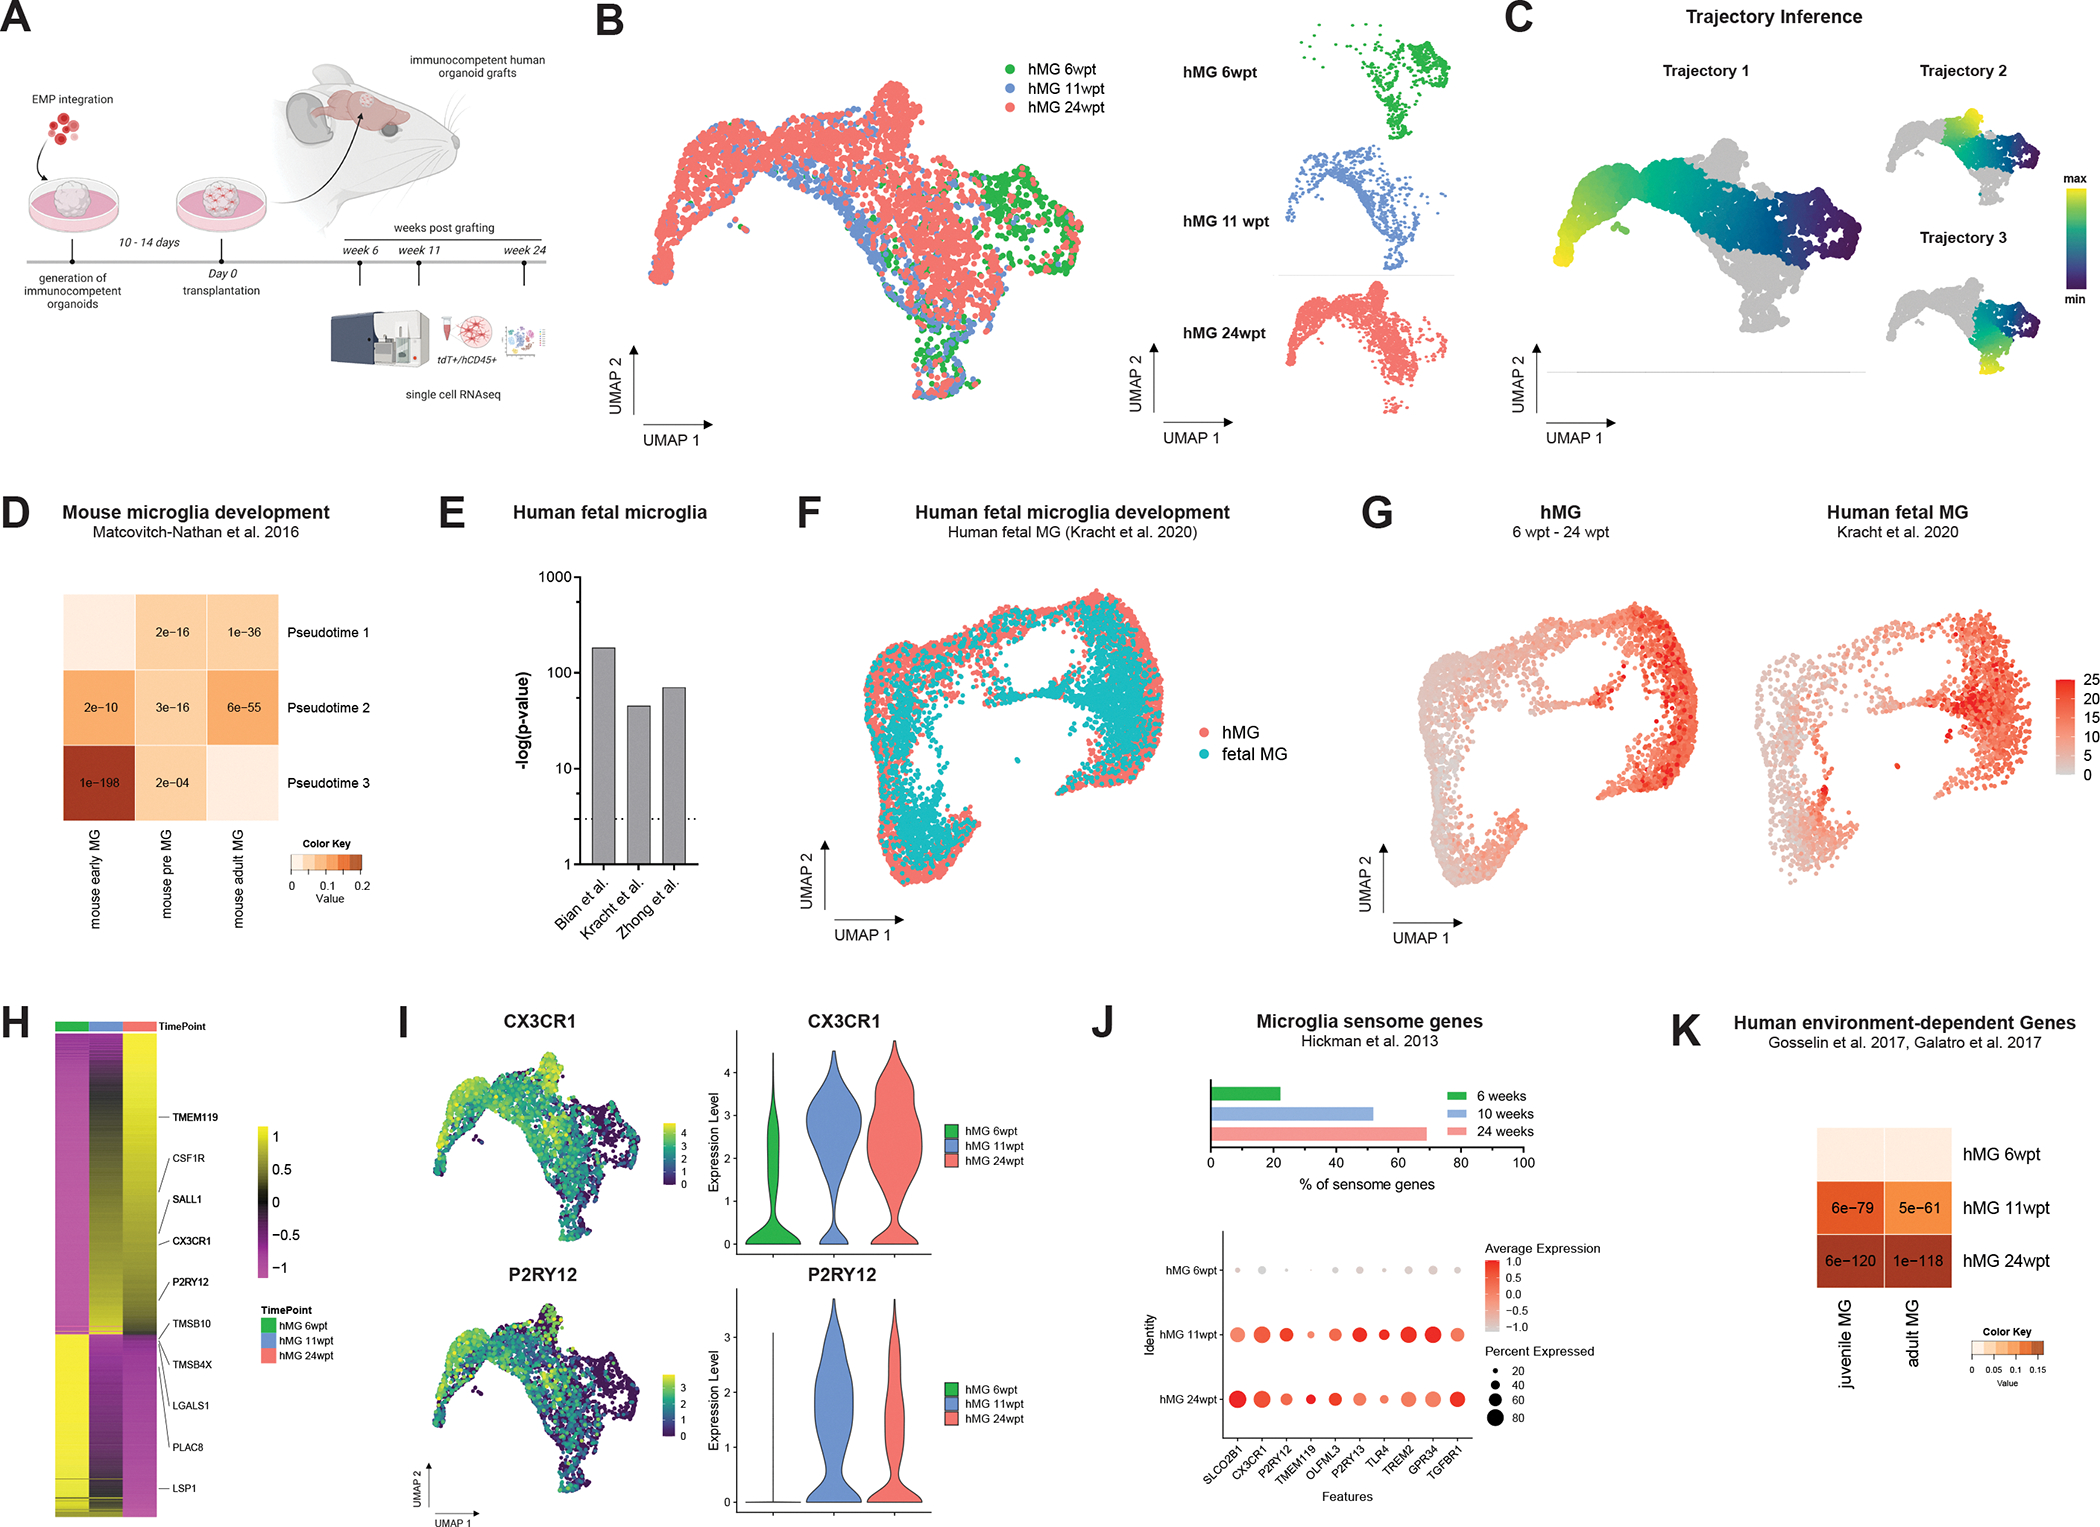
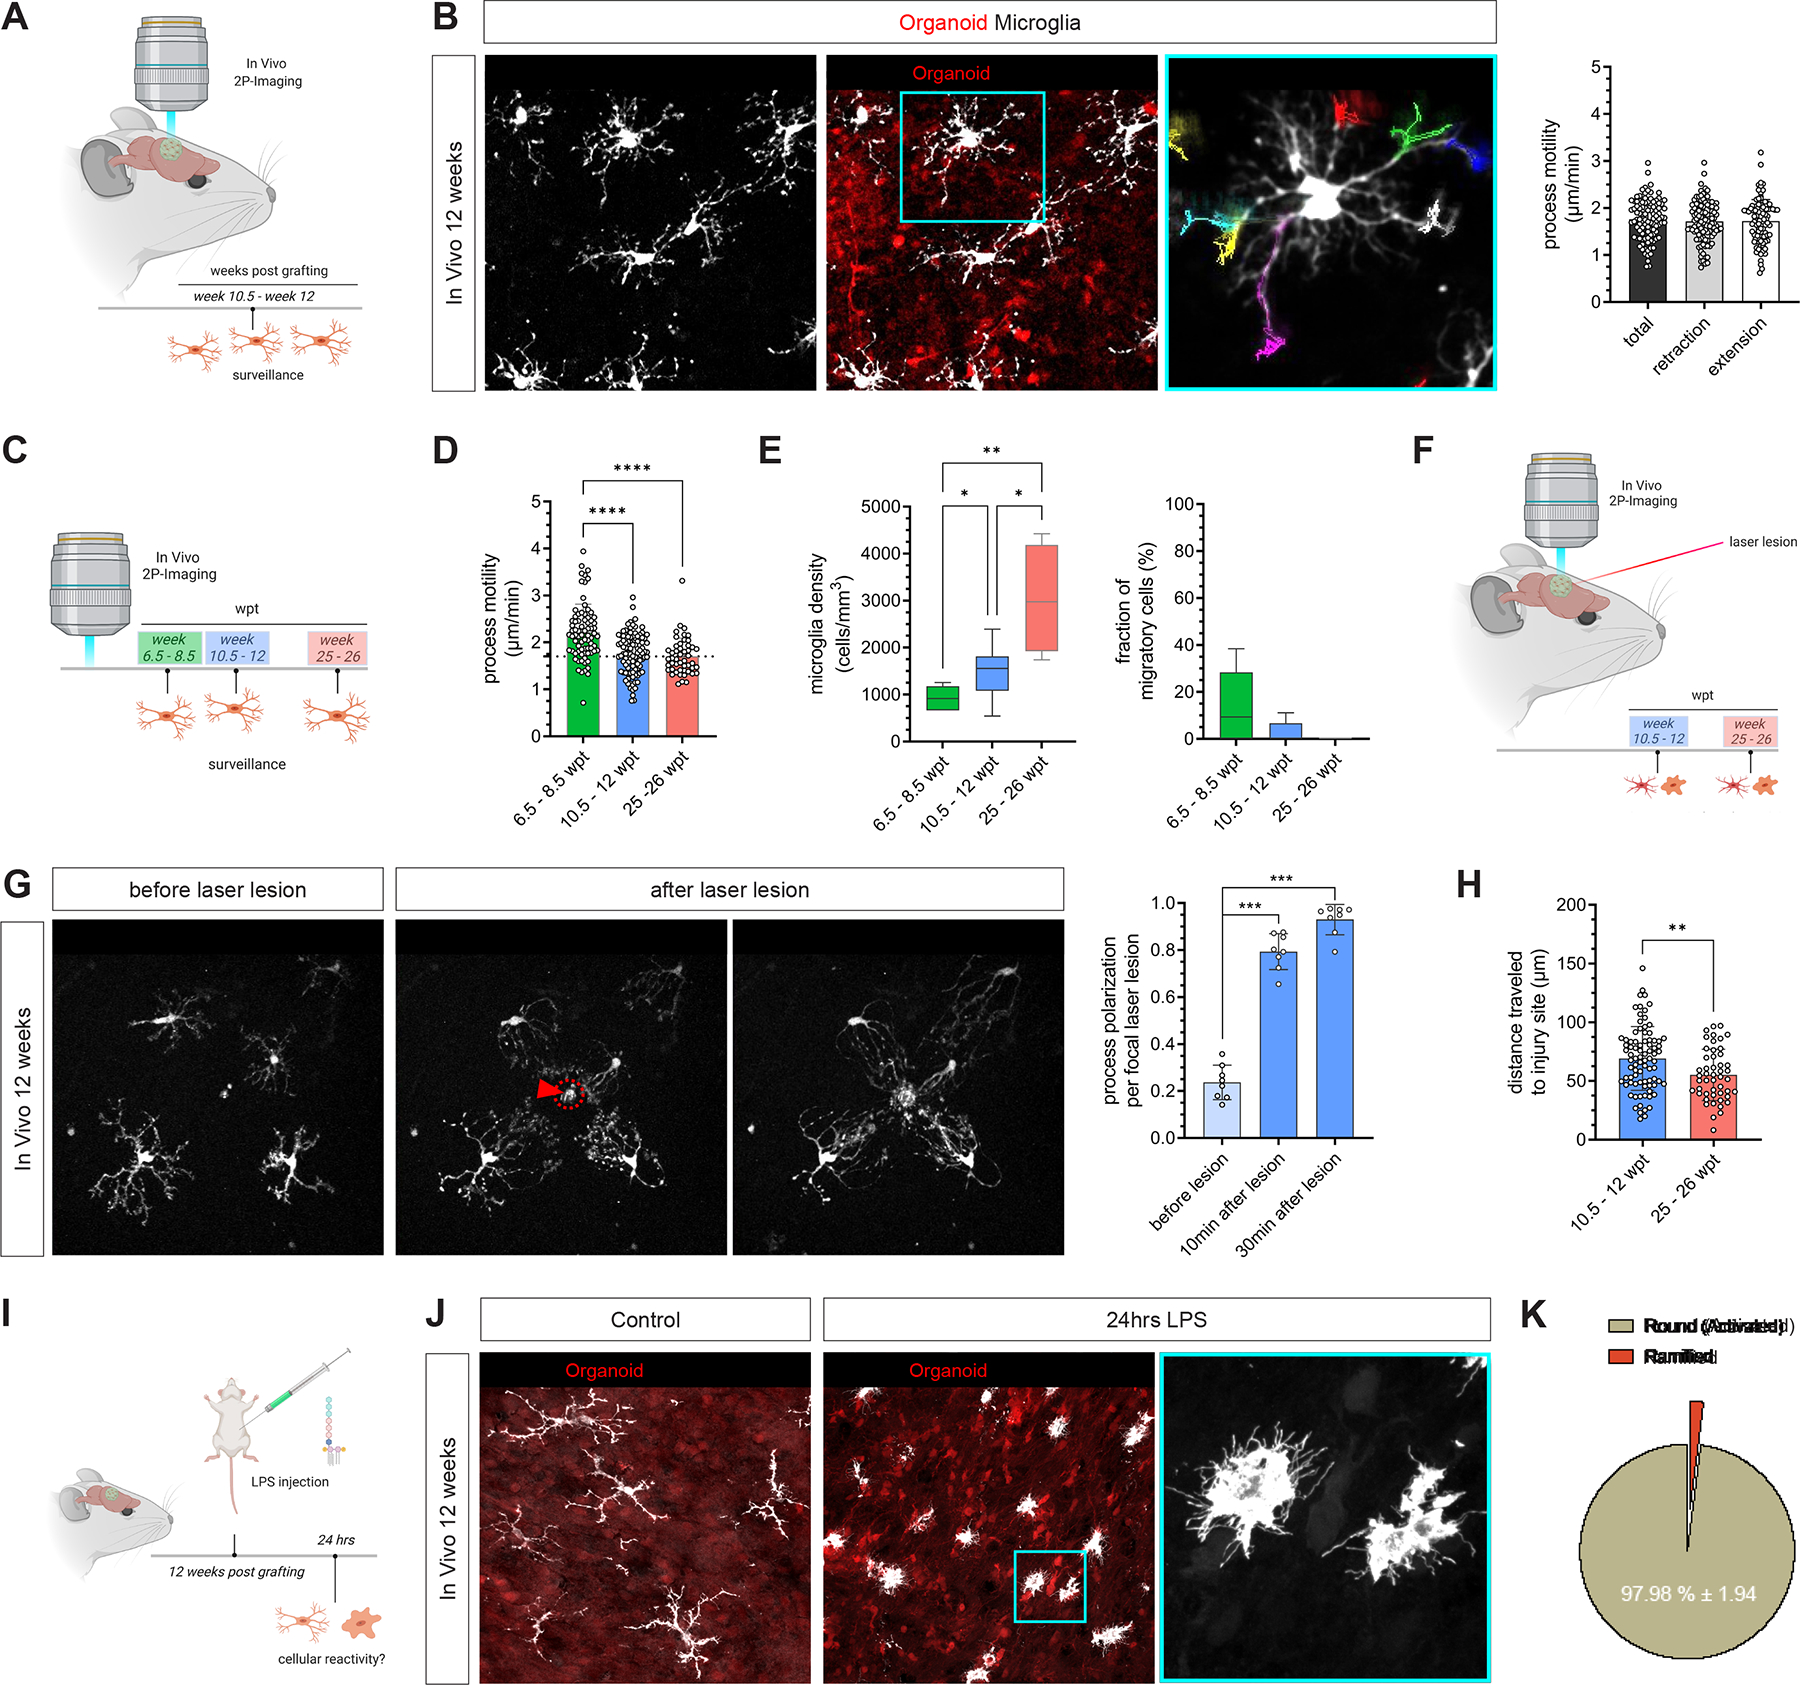
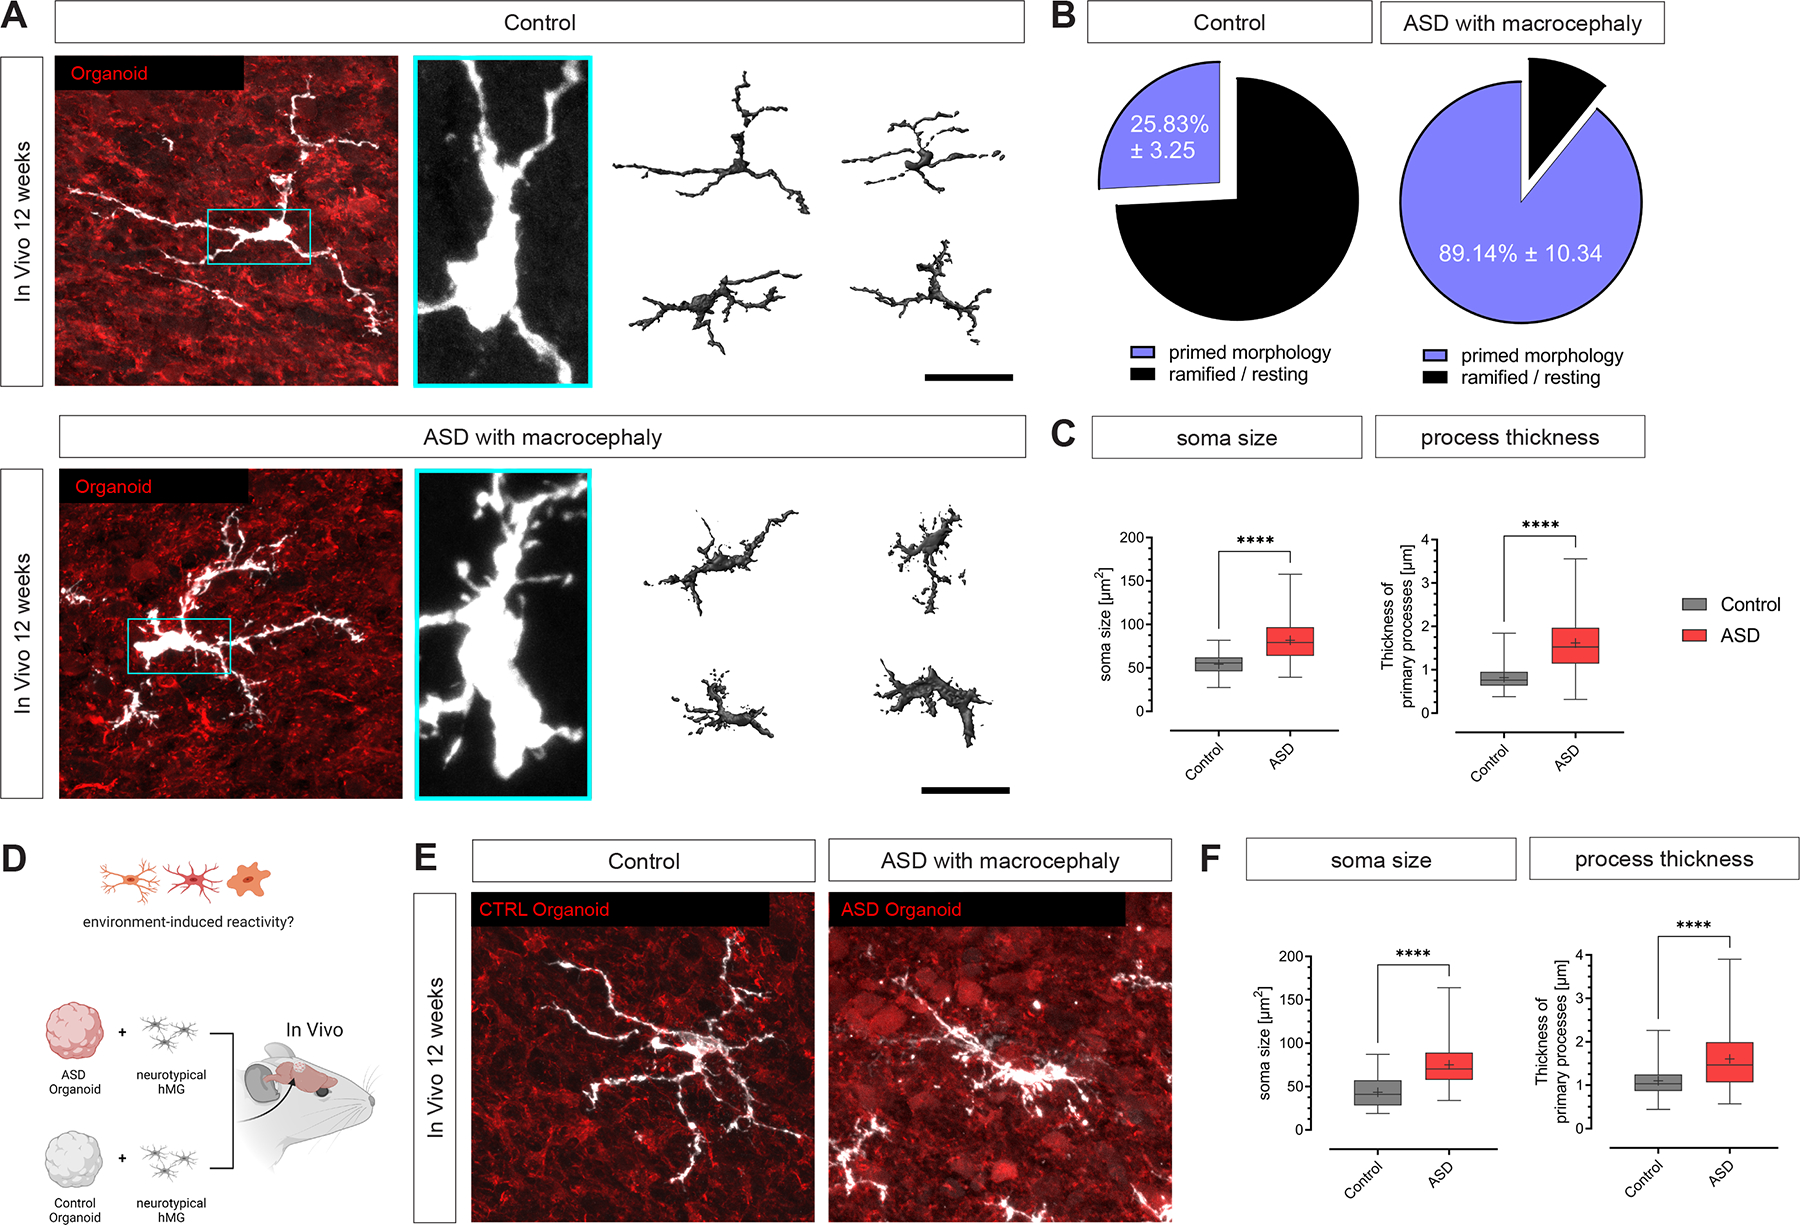
Microglia are specialized brain-resident macrophages that play crucial roles in brain development, homeostasis, and disease. However, until now, the ability to model interactions between the human brain environment and microglia has been severely limited. To overcome these limitations, we developed an in vivo xenotransplantation approach that allows us to study functionally mature human microglia (hMGs) that operate within a physiologically relevant, vascularized immunocompetent human brain organoid (iHBO) model. Our data show that organoid-resident hMGs gain human-specific transcriptomic signatures that closely resemble their in vivo counterparts. In vivo two-photon imaging reveals that hMGs actively engage in surveilling the human brain environment, react to local injuries, and respond to systemic inflammatory cues. Finally, we demonstrate that the transplanted iHBOs developed here offer the unprecedented opportunity to study functional human microglia phenotypes in health and disease and provide experimental evidence for a brain-environment-induced immune response in a patient-specific model of autism with macrocephaly.

Keywords: Human microglia; autism spectrum disorders; brain organoids; iPSCs; microglia in vivo identity; microglia surveillance; neuro-immune interactions; organoid transplantation; xenotransplantation.


Conflict of interest statement

Declaration of interests The authors declare no competing interests.

Figures

Figure 1.
Figure 1.. Transplantation permits maturation and long-term survival of human microglia in human brain organoids in vivo.
(A) EMP-containing forebrain organoids were transplanted into the retro-splenial cortex of NOD/SCID mice and harvested 8 weeks post transplantation (wpt) for histological characterization. (B) Left, representative slide scan image showing a coronal brain section grafted with a human organoid (GFP) containing tdT+ cells. Right, representative confocal images showing tdT+ cells that co-express IBA1 at 8 wpt. Scale bar 20 μm. (C) Bar graph showing percentages of tdT+ cells expressing the myeloid marker IBA1; Mean ± SD; n=4 independent transplantation experiments. (D) Representative images showing presence of cells expressing the myeloid-specific transcription factor PU.1 and the homeostatic human-specific microglia marker TMEM119 at 8 wpt in vivo. Scale bars 20 μm. (E) Representative confocal image showing the ramified morphology of a human microglia and 3D reconstruction using Imaris. Scale bar 10 μm. (F) Pie chart showing relative abundance of microglia morphologies observed at 8 wpt in vivo. (G) Box plots showing quantifications of process numbers observed in hMGs at 8 wpt in vivo. Box plots show median (center line), mean (‘+’) and interquartile range (IQR), with whiskers representing the minimum and the maximum; n=42 cells analyzed. (H) Sholl plot showing the distribution of process intersections as a measure of cellular complexity. Mean ± SD. (I) Left, representative confocal image showing the characteristic ramified morphology of a human microglia derived from an independent iPSC line at 11 wpt in vivo. Scale bar 20 μm. Right, Bar graph showing percentages of tdT+ cells featuring ramified morphologies as quantified for 3 independent iPSC lines at 11 wpt. (J) Representative confocal images of human IBA+ microglia (brain tissue) and tdT+ hMG at 11 wpt in human brain organoids in vivo. Scale bar 50 μm. (K) Box plots showing the distributions of primary process numbers and soma size of microglia in human brain tissue and hMG in human brain organoids in vivo. Quantifications were conducted on tissue from 5 independent human subjects and hMG derived from 3 independent iPSC lines. See also Figure S4.
Figure 2.
Figure 2.. Transcriptomic characterization of human microglia identity in vivo.
(A) Schematic showing the experimental design. EMP-containing forebrain organoids were grafted into the retro-splenial cortex of NOD/SCID mice and harvested at 11 wpt for profiling tdT+-expressing hMG using scRNAseq. (B) UMAP plot of 1,027 tdT+ cells derived from 3 independent iPSC lines profiled that passed quality selection criteria (see Figure S5). (C) Feature plots showing expression of key microglia genes AIF1, CX3CR1, CSF1R and CST3 in vivo. (D) Feature plots showing expression of proliferative marker genes MKI67 and RRM2 in vivo. (E) Feature plots showing expression of homeostatic microglia genes P2RY12, TMEM119 and SALL1 in hMG in vivo. (F) Representative confocal images of hMG expressing the homeostatic microglia marker P2RY12. Scale bar 20 μm. (G) Representative confocal images showing expression of TMEM119 by tdT+ hMG. Scale bar 20 μm. (H) Box plots showing quantifications of tdT+ cells co-expressing P2RY12 or TMEM119 at 11 wpt for 3 independent iPSC lines. See also Figure S5.
Figure 3.
Figure 3.. Transplanted organoids support the development of a homeostatic microglia state in vivo.
(A) Schematic showing the experimental design. GFP+ forebrain organoids were transplanted at day 38 and profiled using bulk RNA-seq before (day 38) and after transplantation (4 and 24 wpt). (B) Heatmap showing Spearman correlations of the entire transcriptome of transplanted and non-transplanted organoid samples to the human Brain Span dataset. (C) Heatmaps showing expression of neuronal marker genes (SATB2, TBR1), astrocyte marker genes (S100B, EAAT1) and microglia-supporting factors IL34 and CSF1; TPM – Transcripts per million. (D) Morphometric comparisons between hMG in vivo at 11 wpt and their cellular correlates that developed in brain organoids in vitro. Scale bars 50 μm. Comparisons were performed using 3 independent iPSC lines for each condition. (E) Box plots showing percentages of tdT+ cells featuring ramified morphologies at 11 wpt in vivo as compared to in vitro. Comparisons were performed using 3 independent iPSC lines for each condition. Mann-Whitney U test (***P = 0.007). (F) Representative confocal images of tdT+ cells co-expressing P2RY12 at 11 wpt in vivo and in vitro. Scale bar 50 μm. (G) Box plots showing percentages of tdT+ co-expressing P2RY12 or TMEM119 at 11 wpt in vivo and in vitro. Comparisons were performed using 3 independent iPSC lines for each condition. Mann-Whitney U test (P2RY12: ****P < 0.0001; TMEM119: **P = 0.0043). See also Figure S6.
Figure 4.
Figure 4.. Human microglia follow defined developmental trajectories and acquire human brain environment-dependent signatures in vivo.
(A) Schematic showing the experimental design. Following EMP colonization, neuro-immune organoids were transplanted into immunocompromised mice, harvested at 6, 11 and 24 weeks post transplantation (wpt) using FACS and subsequently processed for scRNAseq. (B) UMAP plot of 4,322 tdT+ cells from a total of 7 animals at 3 time points profiled that passed quality selection criteria; n6wpt=2, n11wpt=3 and n24wpt=2. (C) Trajectory interference identifies 3 cellular trajectories that reflect a transition from early to late time points during hMG development. (D) Heatmap showing significant overlap of pseudo-temporal genes with microglial genes that change during mouse microglia development (E) Pseudo-temporal genes show significant overlap with genes that define human fetal microglia development ,,. (F) UMAP plot showing integrative analysis of fetal human microglia from 9 to 18 gestational weeks with hMG from 6 to 24 wpt. (G) Feature plots showing the expression of a human microglia-specific gene set that defines the developmental transition to an immune-sensing microglia state. (H) Heatmap showing differentially expressed genes between 6, 11 and 24 wpt. (I) Feature and violin plots showing expression of key microglia genes CX3CR1 and P2RY12 that are upregulated during hMG development in vivo. (J) Bar plot and dot plot showing expression and relative abundance of microglia-specific sensome genes (Hickman et al.). (K) Heatmap showing acquisition of human brain environment dependent and mature human microglia signatures , between 11 to 24 wpt. See also Figure S7, S8 and S9.
Figure 5.
Figure 5.. Human microglia show characteristic immune-sensing properties and react to local and systemic perturbations in vivo.
(A) Intravital imaging of tdT+ hMG was performed between 10.5 and 12 wpt to assess motility and immune-sensing properties of human microglia in vivo. (B) Representative images showing in vivo 2P-imaging of tdT+ hMG performed between 10.5 and 12 wpt in vivo. Note process motility tracking summed over a 90-min imaging interval. Bar graph shows individual process motilities quantified for n=102 processes from 3 independent animals. Scale bars 50 μm. See Video S3. (C) Schematic showing experimental design. (D) Bar graph shows individual process motilities quantified at 3 different time points. Number of processes quantified from 3 independent animals each: n6.5–8.5wpt=77, for n10.5–12wpt=102 and n25–26wpt=102. 2-way ANOVA with Tukey’s multiple comparisons test (green vs blue: ****Padj < 0.0001; green vs red: ****Padj < 0.0001 (E) Box plot showing hMG densities (left) and fraction of migratory cells (right) at the time points assessed in D. Kruskal-Wallis test (green vs blue: *q-value = 0.0289; blue vs red: *q-value = 0.0289, green vs red: **q-value = 0.0013). (F) Intravital imaging was performed following acute laser lesions within the human organoid grafts at 12 and 26 wpt. (G) Representative images of in vivo 2P-imaging before (left) and 10 min and 30 min following acute laser lesions (right) that were performed within the human organoid graft (arrowhead and red circle). Quantifications show process polarity indices before as well as 10 min and 30 min following acute laser lesions. Scale bar 50 μm; Mann-Whitney U test (10 min: ***P = 0.0002, 30 min: ***P = 0.0002). See Video S4. (H) Box plot showing measurements of distances travelled per process to the injury site at 12 and 26 wpt; Mann-Whitney U test (**P = 0.0056). (I) Schematic showing the experimental design. Intraperitoneal injection of the Gram-negative bacterial endotoxin lipopolysaccharide (LPS) at a concentration of 5 mg/kg was used to elicit a rapid innate immune response. Animals were harvested 24 hrs after injection to assess hMG reactivity. (J) Representative confocal images of control and LPS-challenged hMGs shows a strong cellular response to LPS. Scale bars 50 μm (left) and 25 μm (turquoise box, right). (K) Percentages of different morphological phenotypes observed within the population of hMG 24 hrs after systemic LPS administration. See also Figure S10.
Figure 6:
Figure 6:. Generation of human patient-specific models reveals a brain environment-induced immune response in ASD with macrocephaly.
(A) Representative confocal images showing hMGs from ASD and control subjects at 12 wpt. Scale bars 50 μm (left) and 10 μm (right). The 3D reconstructions depicting different microglia morphologies observed in ASD and control samples were generated using Imaris. Scale bar 50 μm. (B) Pie charts showing relative abundance of microglia with and without somal filopodia. Values indicate mean ± SD; nControl=3 independent neurotypical control lines; nASD=3 independent patient lines. (C) Box plots showing quantifications of soma size, primary process thickness and filopodia density of control and ASD hMGs at 12 wpt. Box plots show median (center line), mean (‘+’) and interquartile range (IQR), with whiskers representing the minimum and the maximum; nControl=3 independent neurotypical control lines with a total of 71 cells; nASD=3 independent patient lines with a total of 74 cells. Mann-Whitney U test (soma size: ****P < 0.0001, process thickness: ****P < 0.0001). (D) Schematic illustrating the experimental design for generating heterogenic neuroimmune models harboring ‘sensor’ hMG. (E) Representative confocal images of ‘sensor’ hMG in ASD and control organoids in vivo at 12 wpt. Scale bar 25 μm. (F) Box plots showing quantifications of soma size and primary process thickness of ‘sensor’ hMG in ASD and control organoids in vivo at 12 wpt; nControl=3 independent neurotypical control lines. Box plots show median (center line), mean (‘+’) and interquartile range (IQR), with whiskers representing the minimum and the maximum; Mann-Whitney U test (soma size: ****P < 0.0001, process thickness: ****P < 0.0001). See also Figure S10.

Comment in

References

    1. Monier A, Evrard P, Gressens P, and Verney C (2006). Distribution and differentiation of microglia in the human encephalon during the first two trimesters of gestation. Journal of Comparative Neurology 499, 565–582. 10.1002/cne.21123. - DOI - PubMed
    1. Monier A, Adle-Biassette H, Delezoide A-L, Evrard P, Gressens P, and Verney C (2007). Entry and Distribution of Microglial Cells in Human Embryonic and Fetal Cerebral Cortex. J Neuropathol Exp Neurol 66, 372–382. 10.1097/nen.0b013e3180517b46. - DOI - PubMed
    1. Verney C, Monier A, Fallet-Bianco C, and Gressens P (2010). Early microglial colonization of the human forebrain and possible involvement in periventricular white-matter injury of preterm infants. J Anat 217, 436–448. 10.1111/j.1469-7580.2010.01245.x. - DOI - PMC - PubMed
    1. Vargas DL, Nascimbene C, Krishnan C, Zimmerman AW, and Pardo CA (2005). Neuroglial activation and neuroinflammation in the brain of patients with autism. Annals of Neurology 57, 67–81. 10.1002/ana.20315. - DOI - PubMed
    1. Morgan JT, Chana G, Pardo CA, Achim C, Semendeferi K, Buckwalter J, Courchesne E, and Everall IP (2010). Microglial Activation and Increased Microglial Density Observed in the Dorsolateral Prefrontal Cortex in Autism. Biological Psychiatry 68, 368–376. 10.1016/j.biopsych.2010.05.024. - DOI - PubMed

Publication types