. 2023 Jul 11;35(7):1209-1226.e13.
doi: 10.1016/j.cmet.2023.04.013. Epub 2023 May 11.

Extracellular vesicles in fatty liver promote a metastatic tumor microenvironment

Affiliations

Extracellular vesicles in fatty liver promote a metastatic tumor microenvironment

Zhijun Wang et al. Cell Metab. .

Abstract

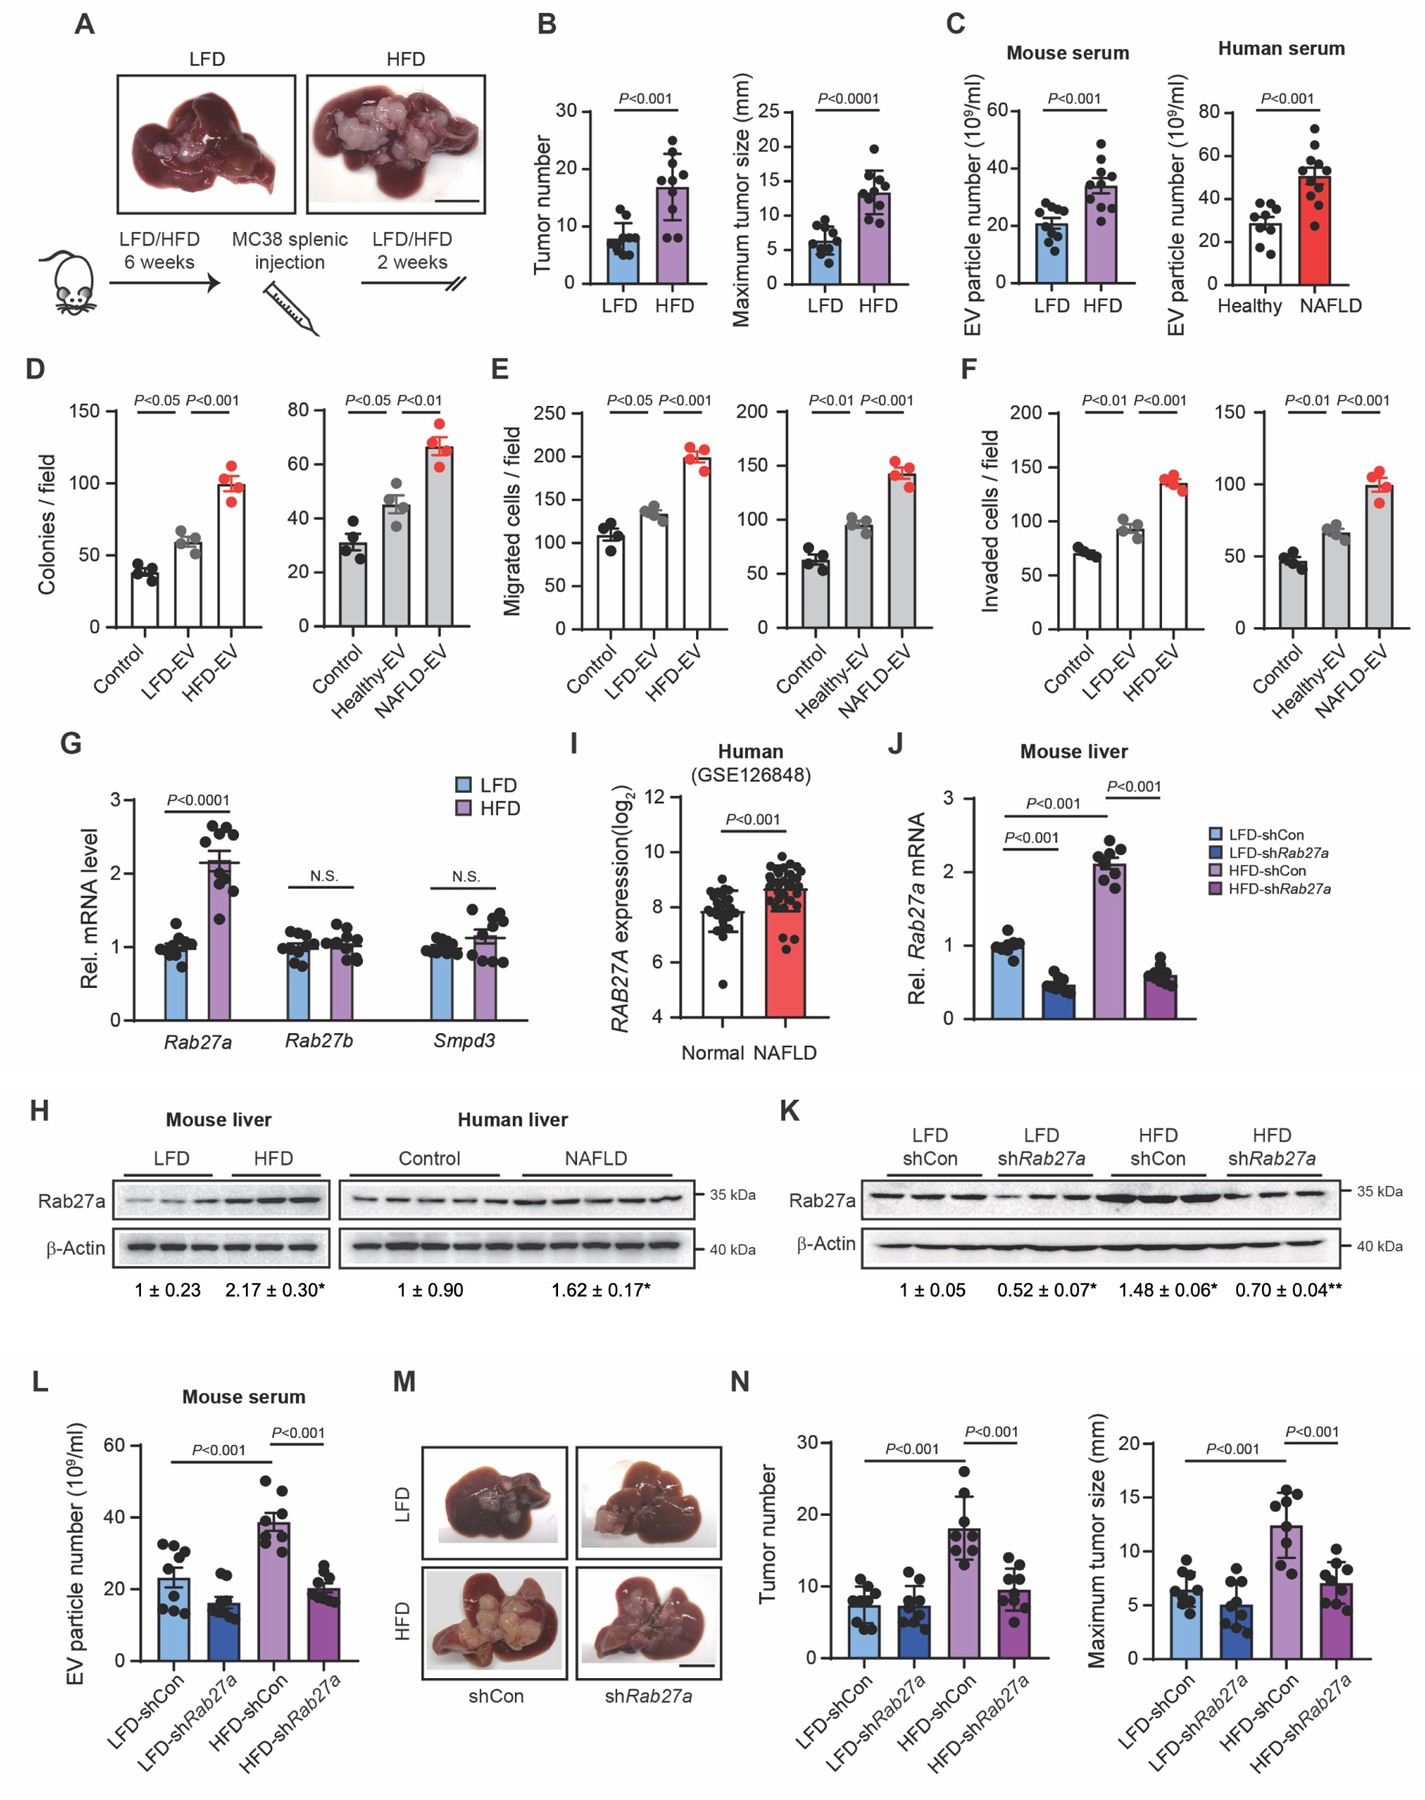
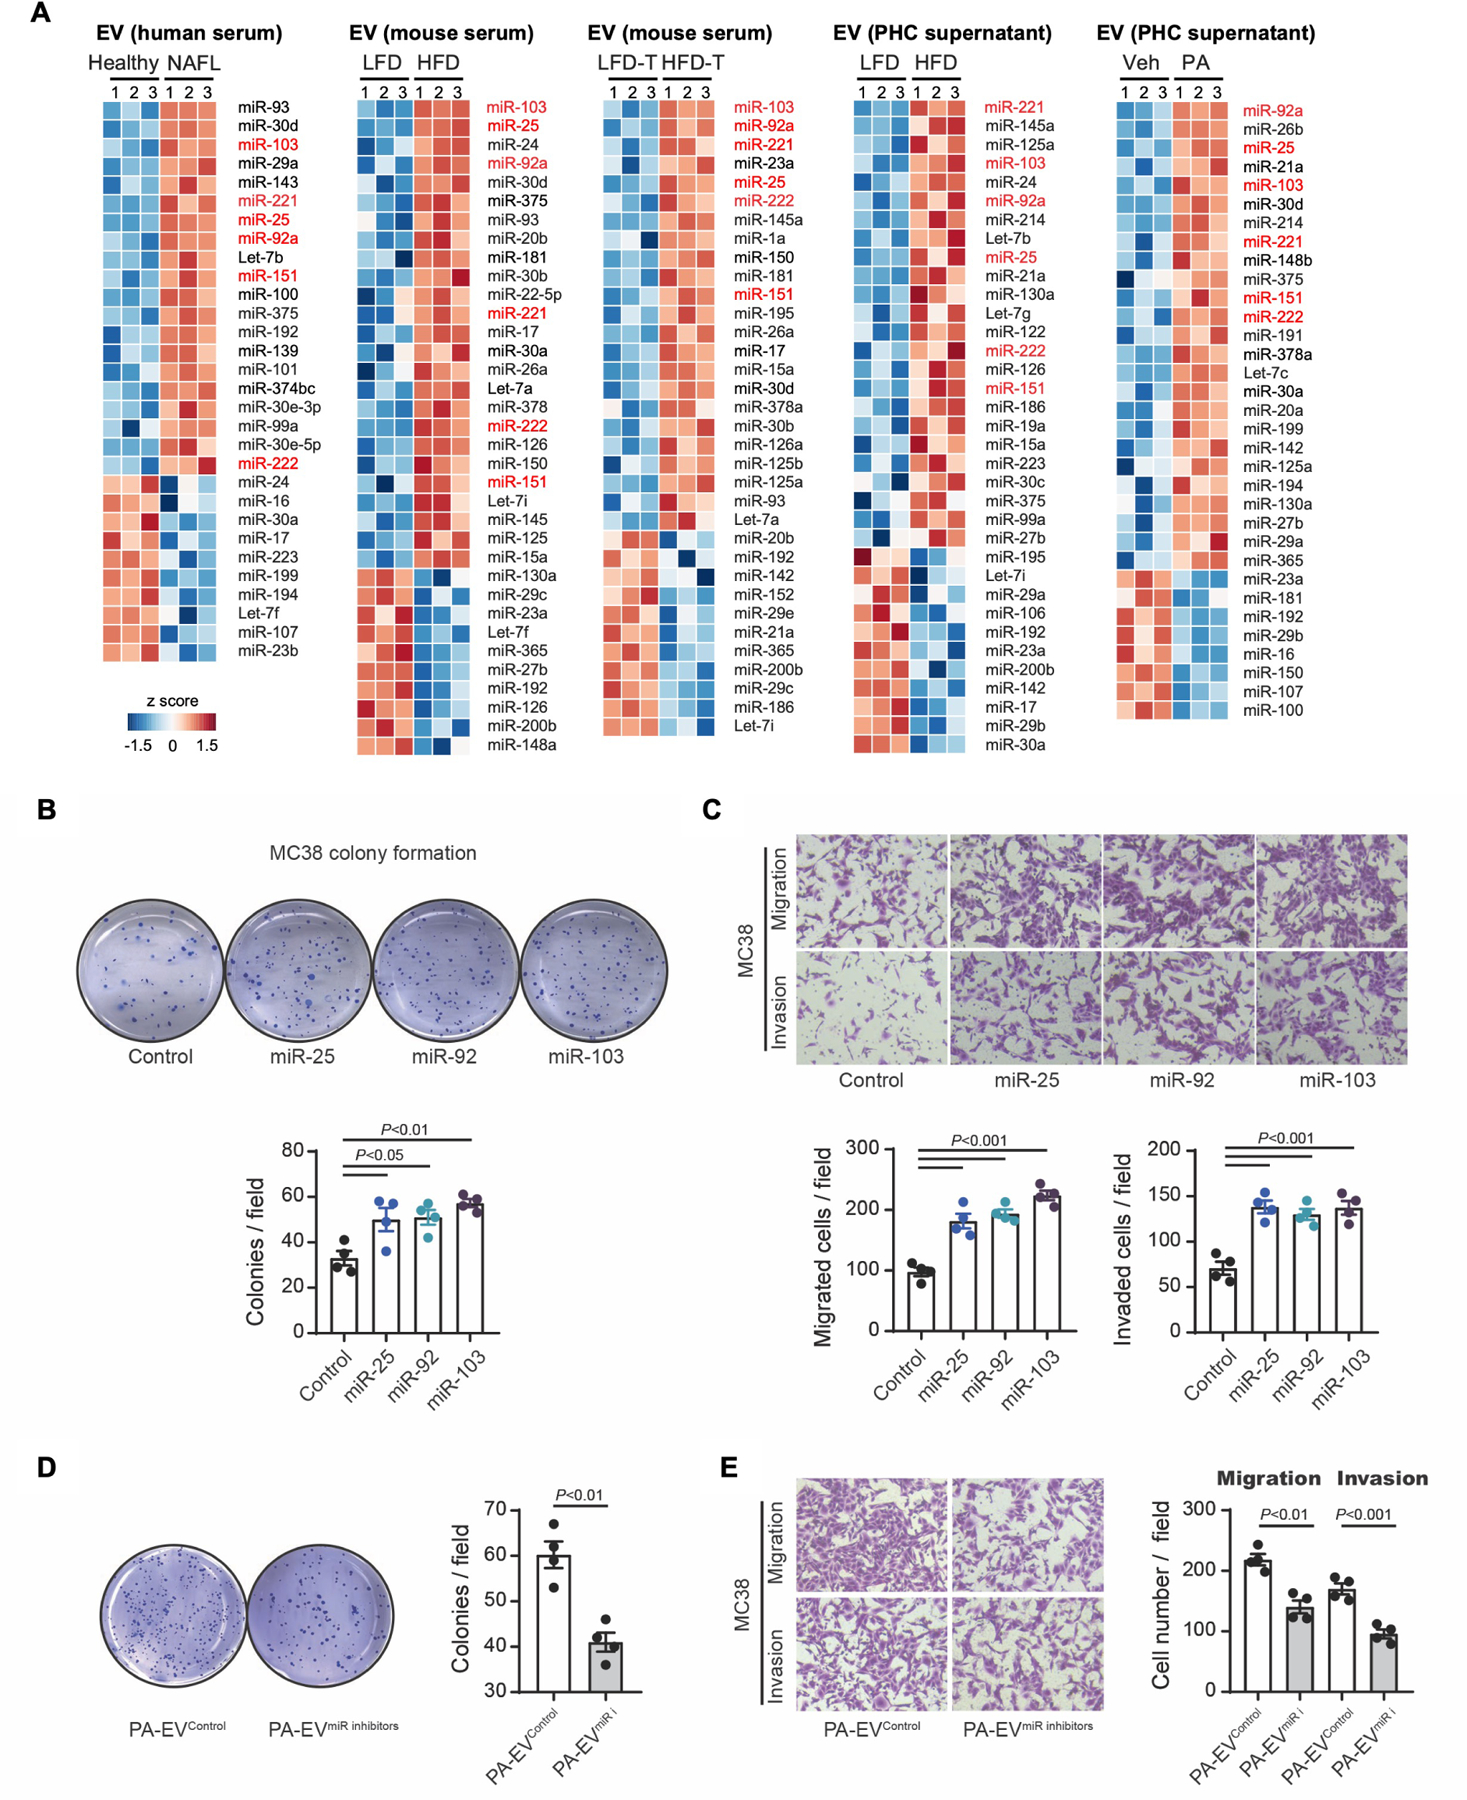
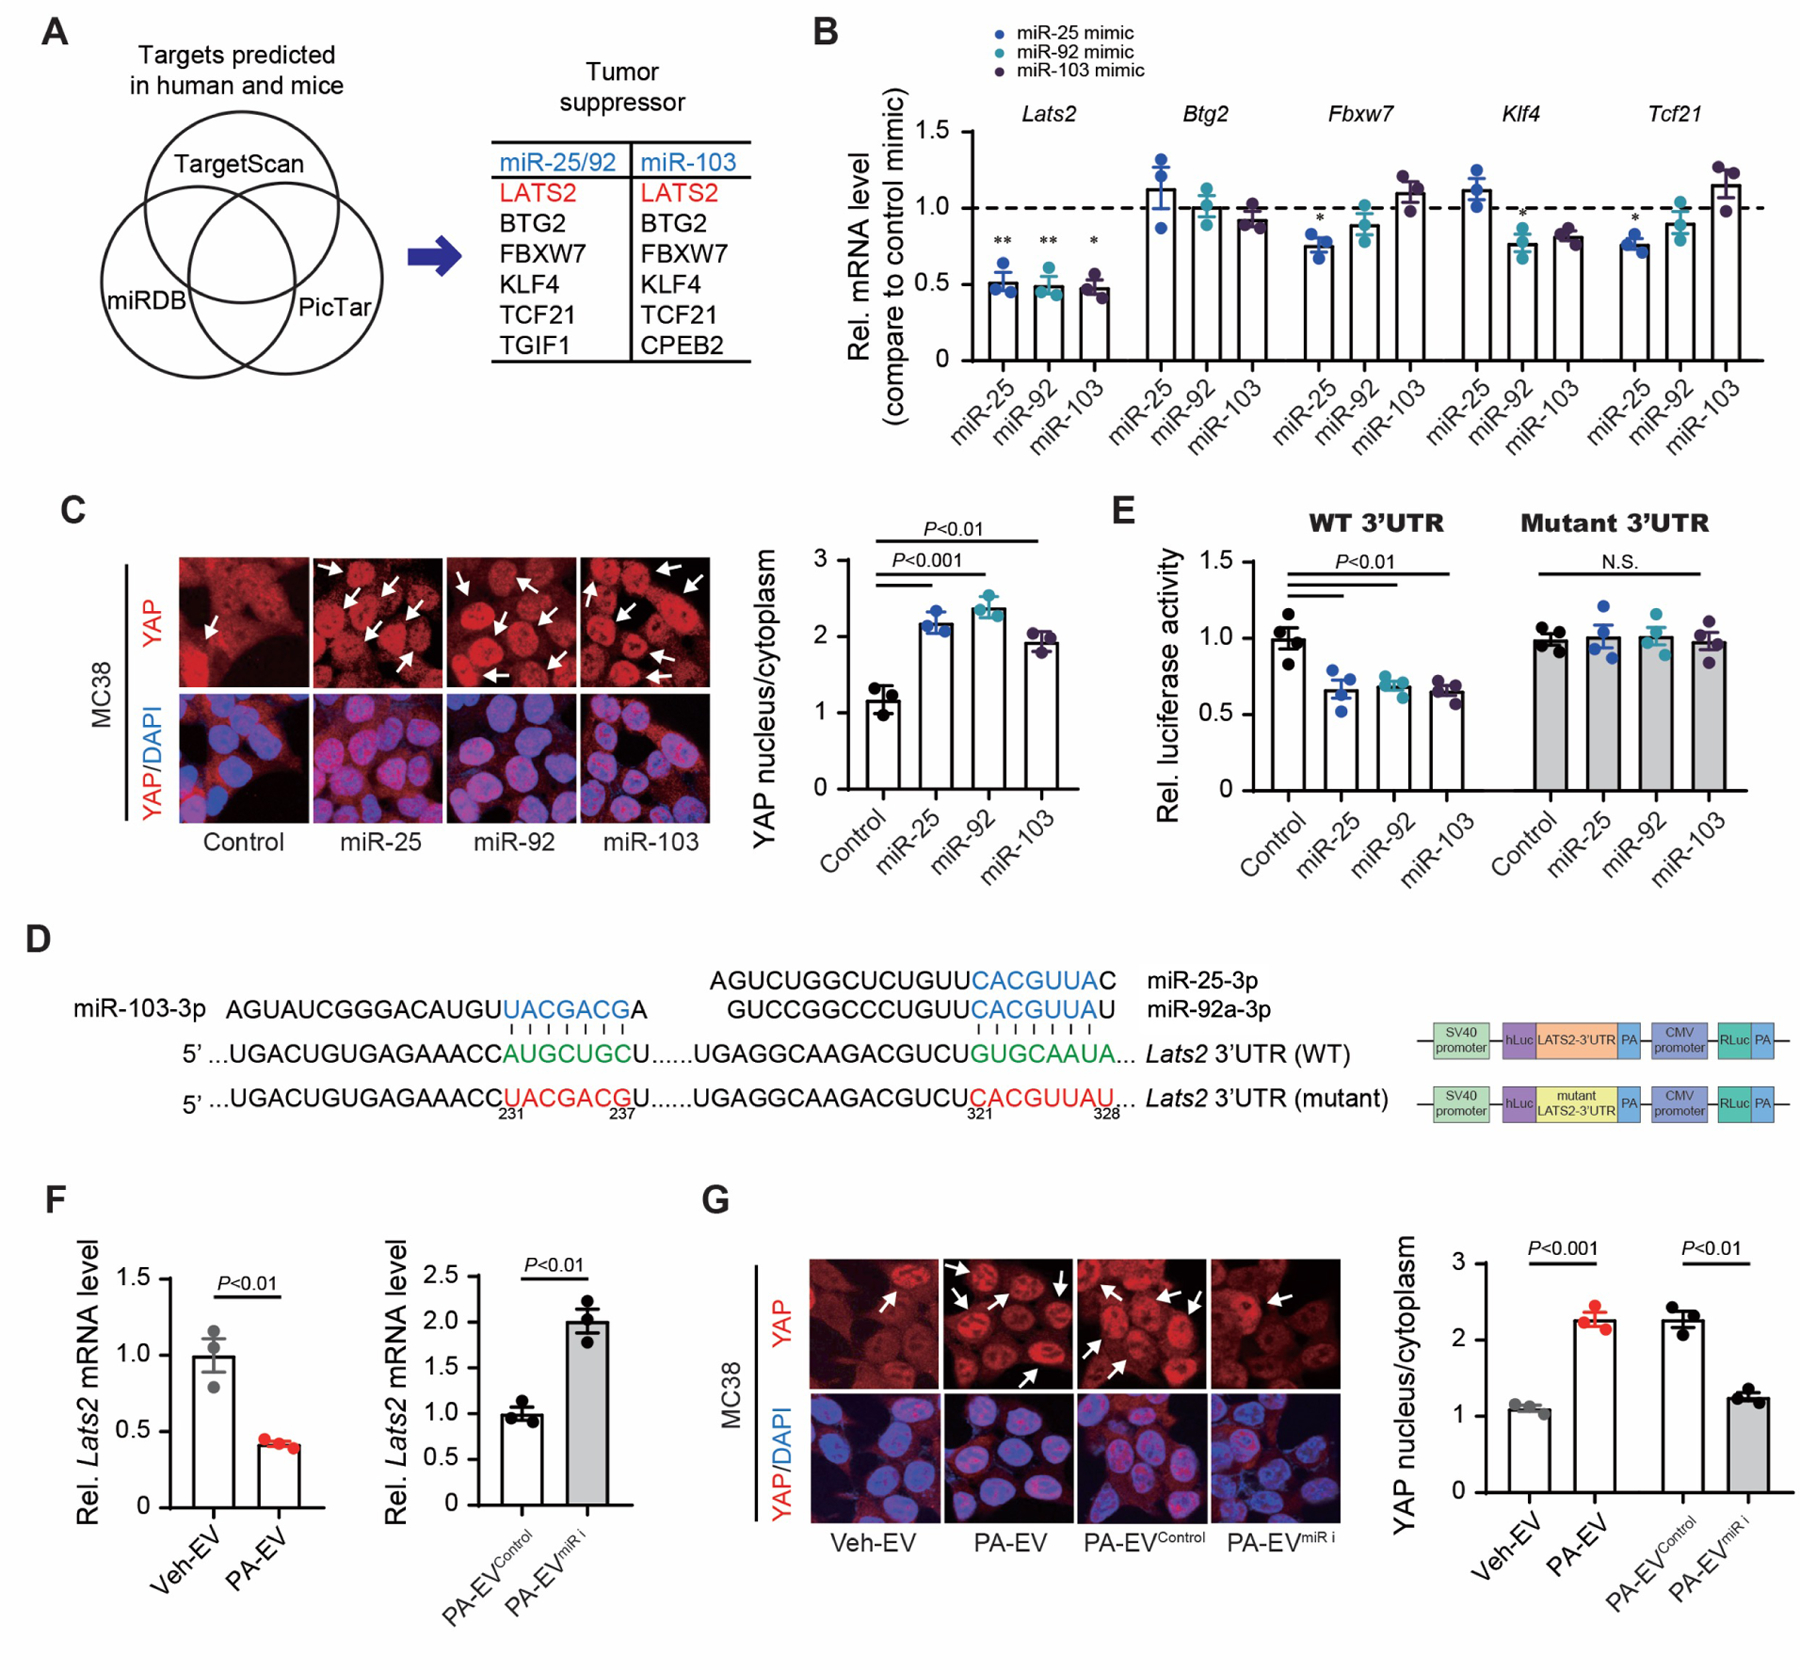
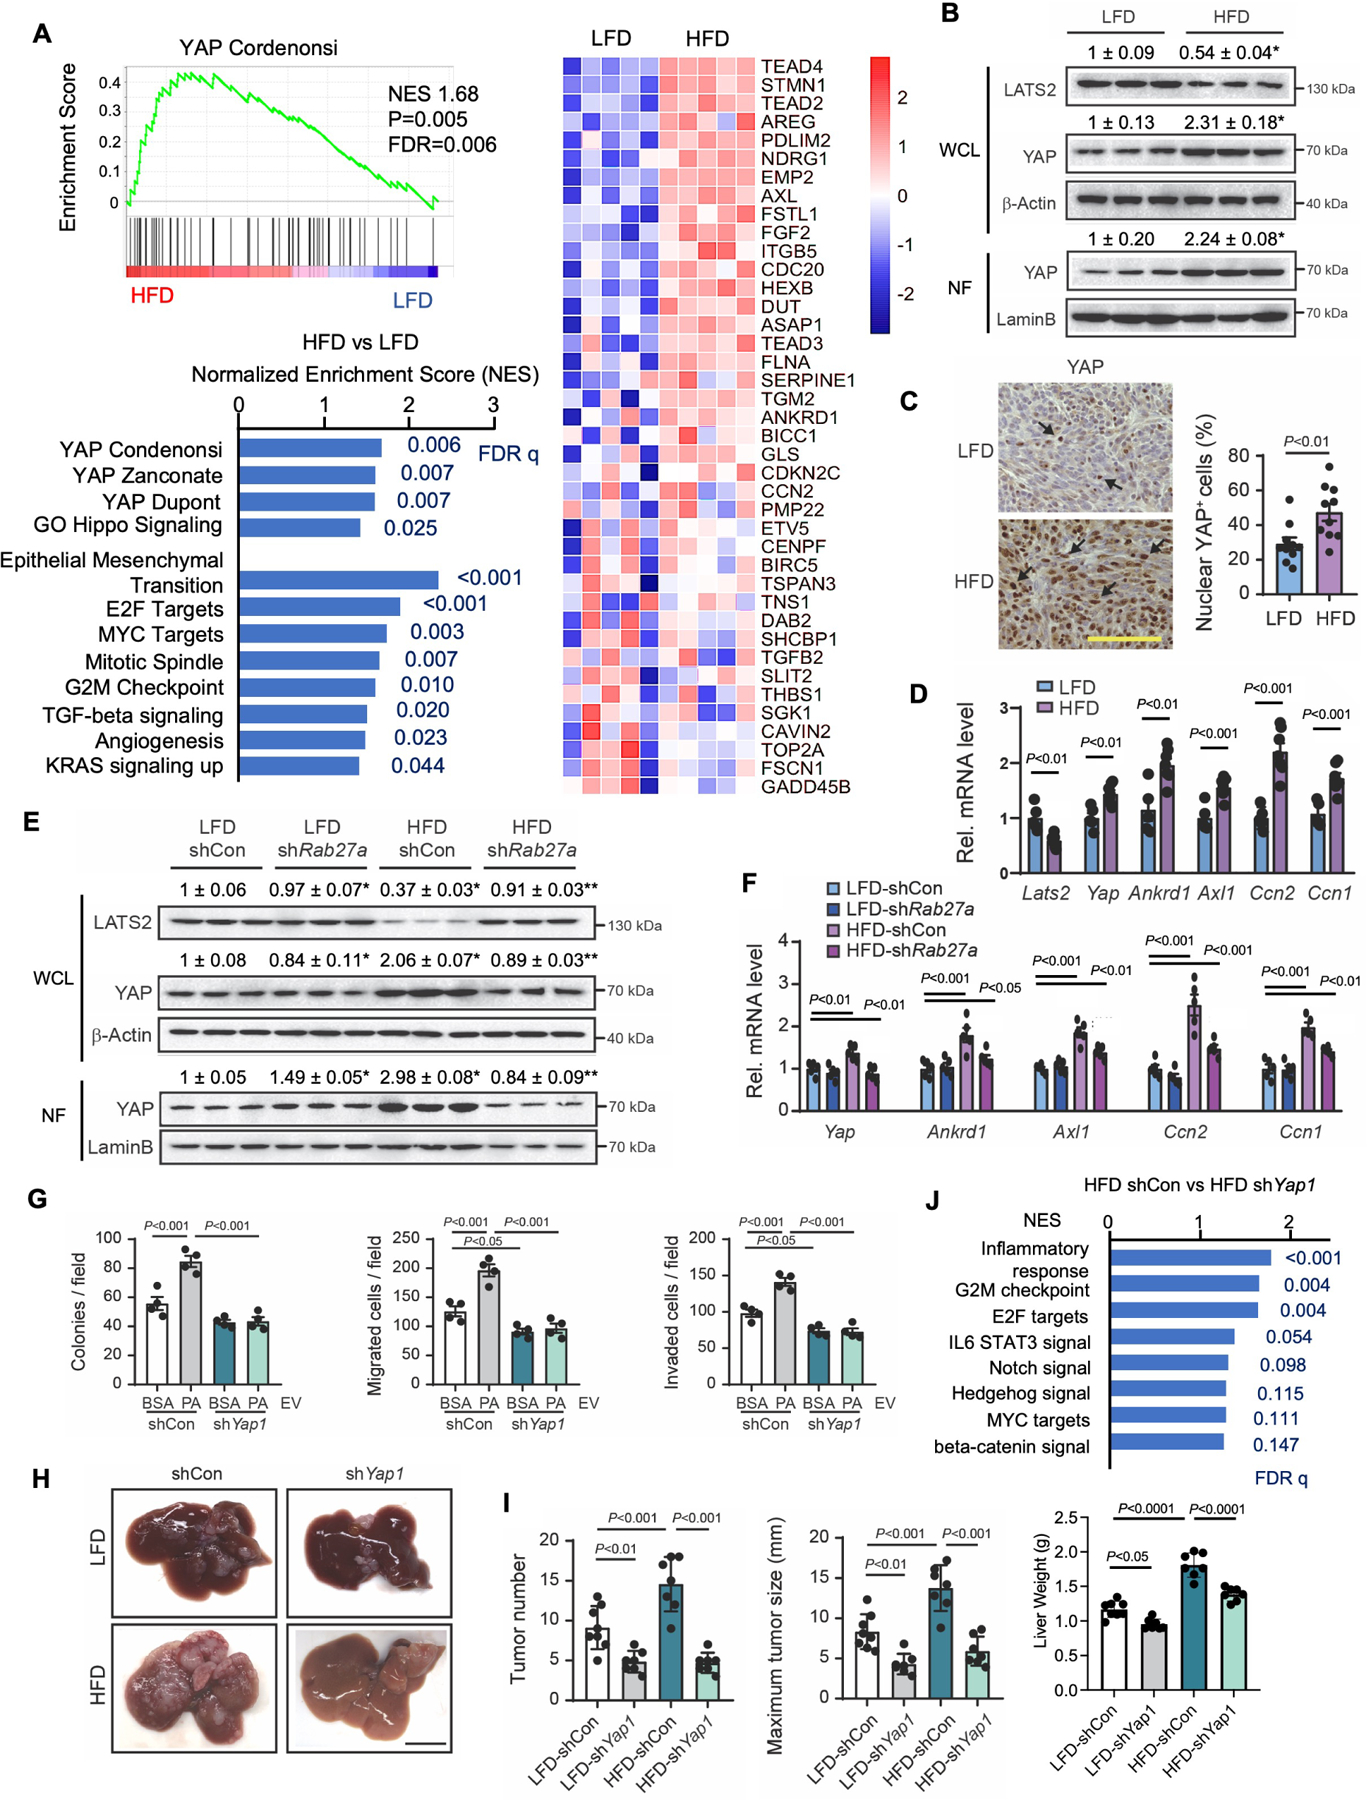
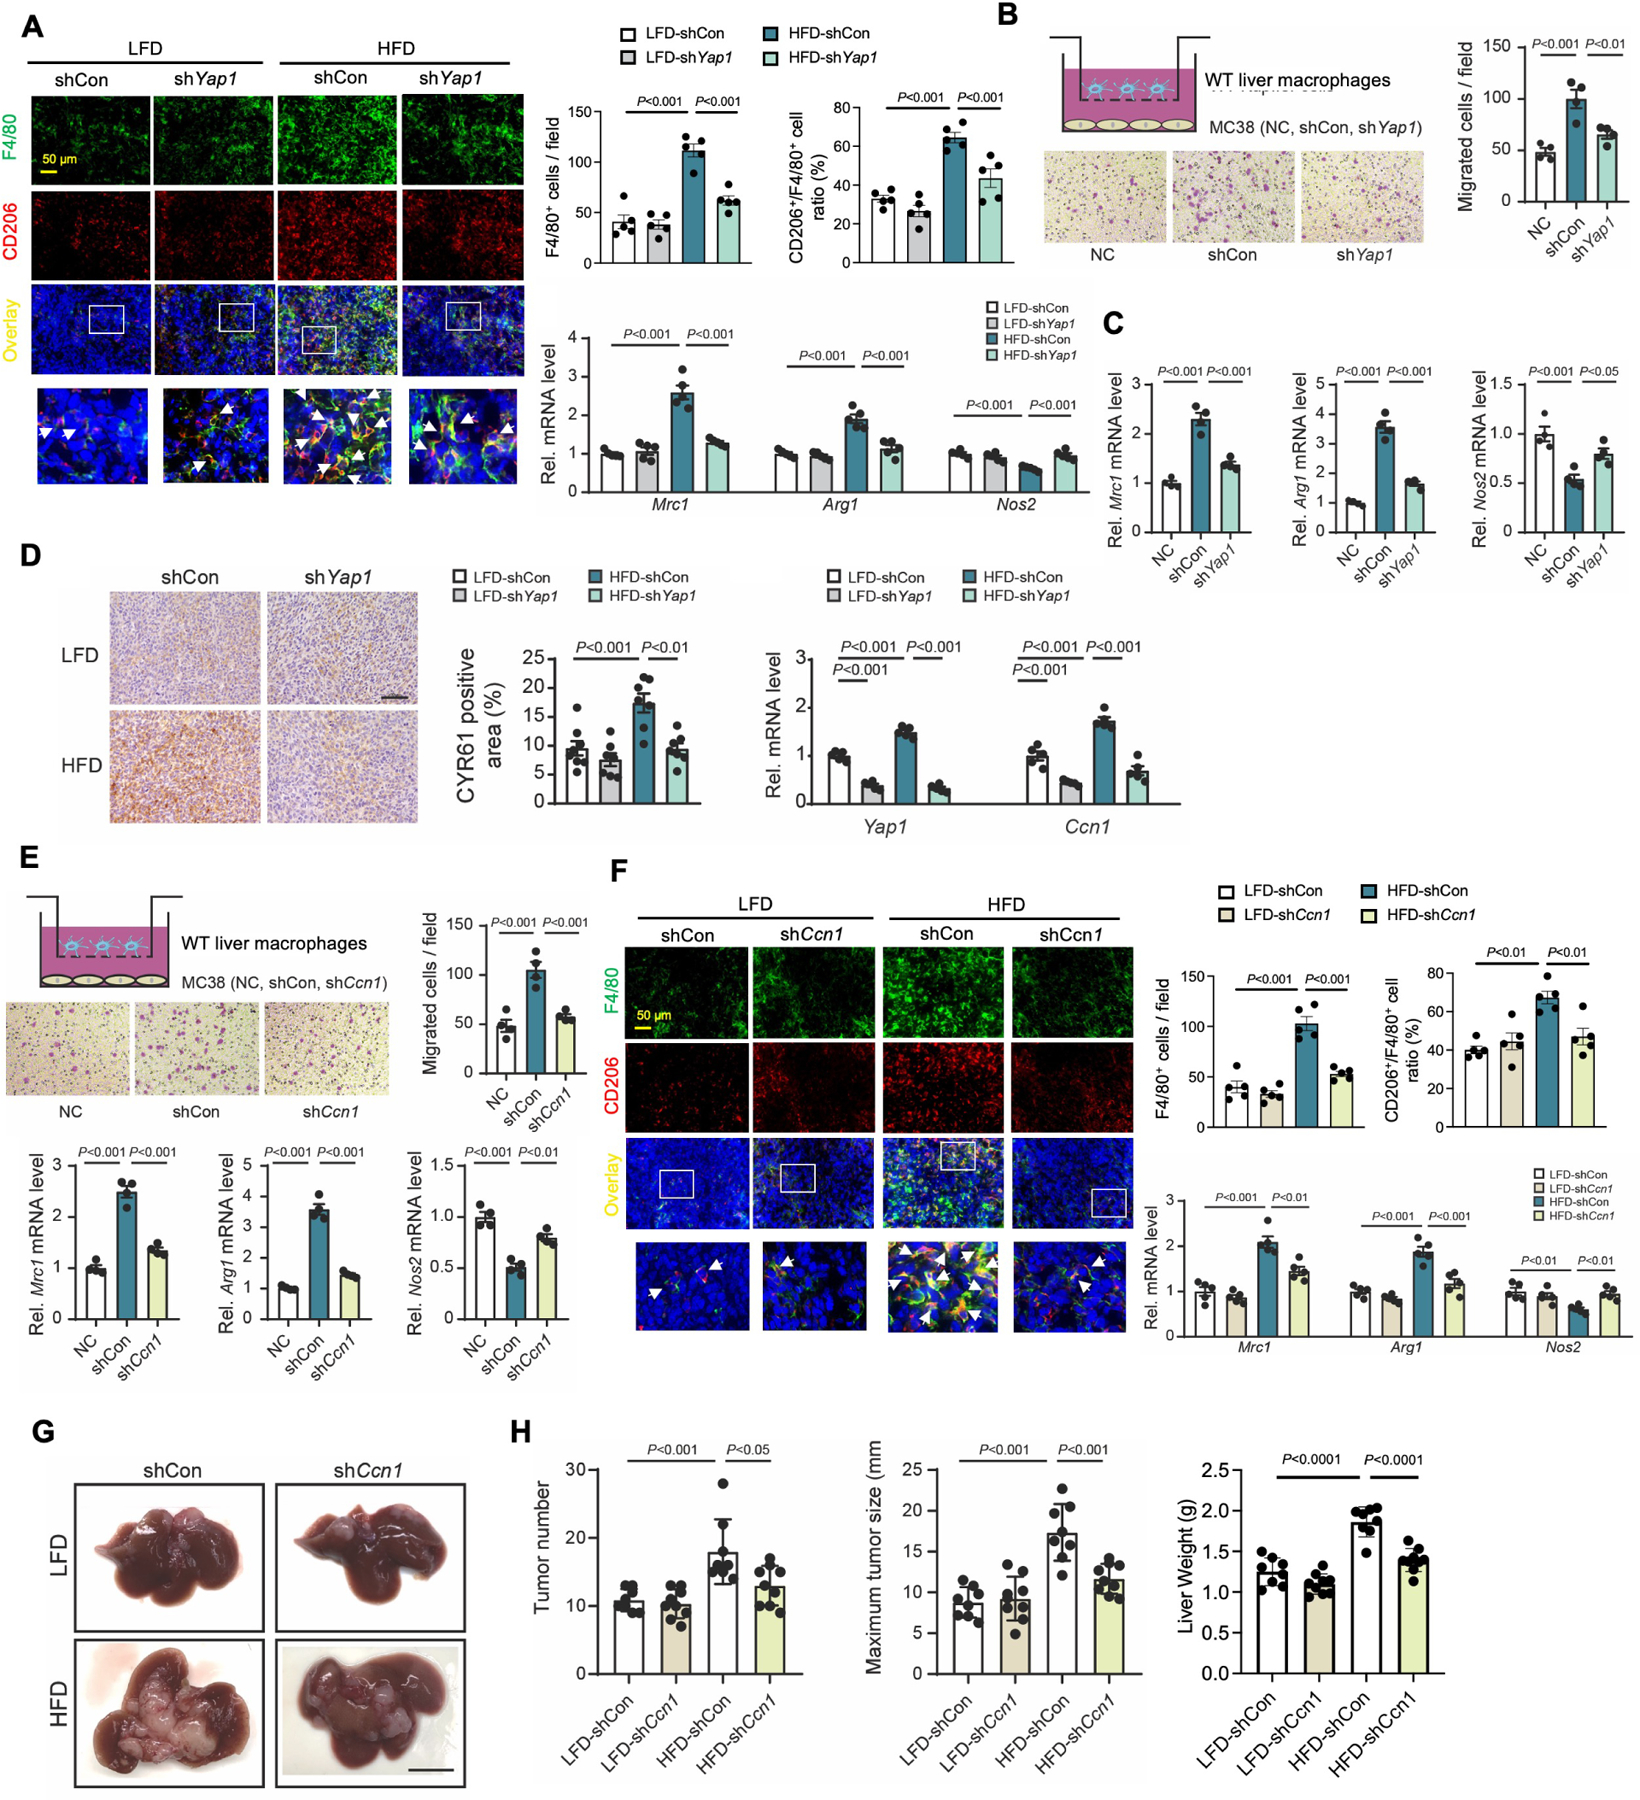
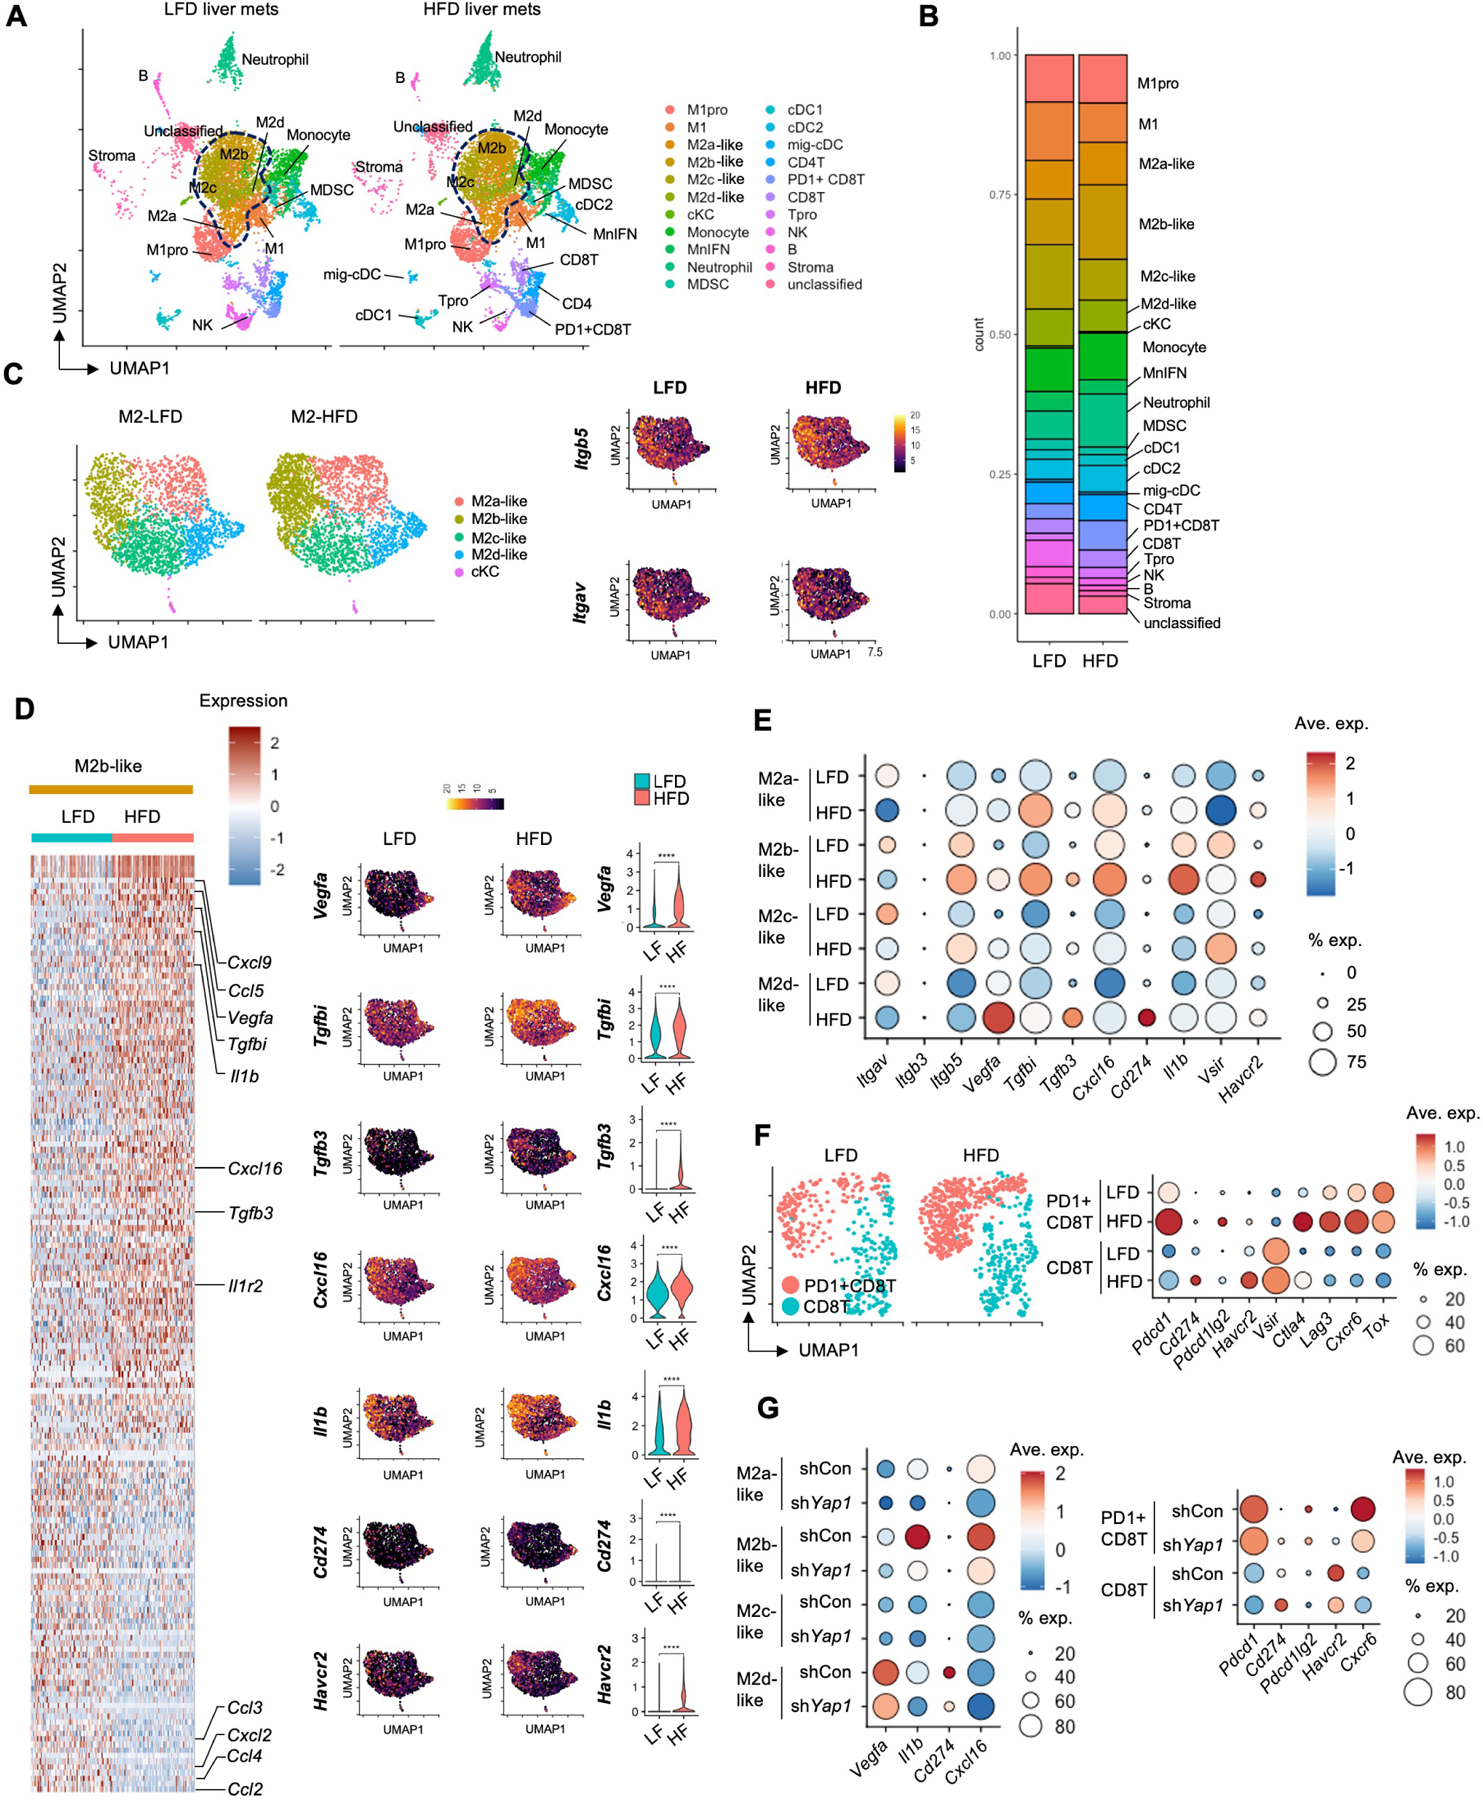
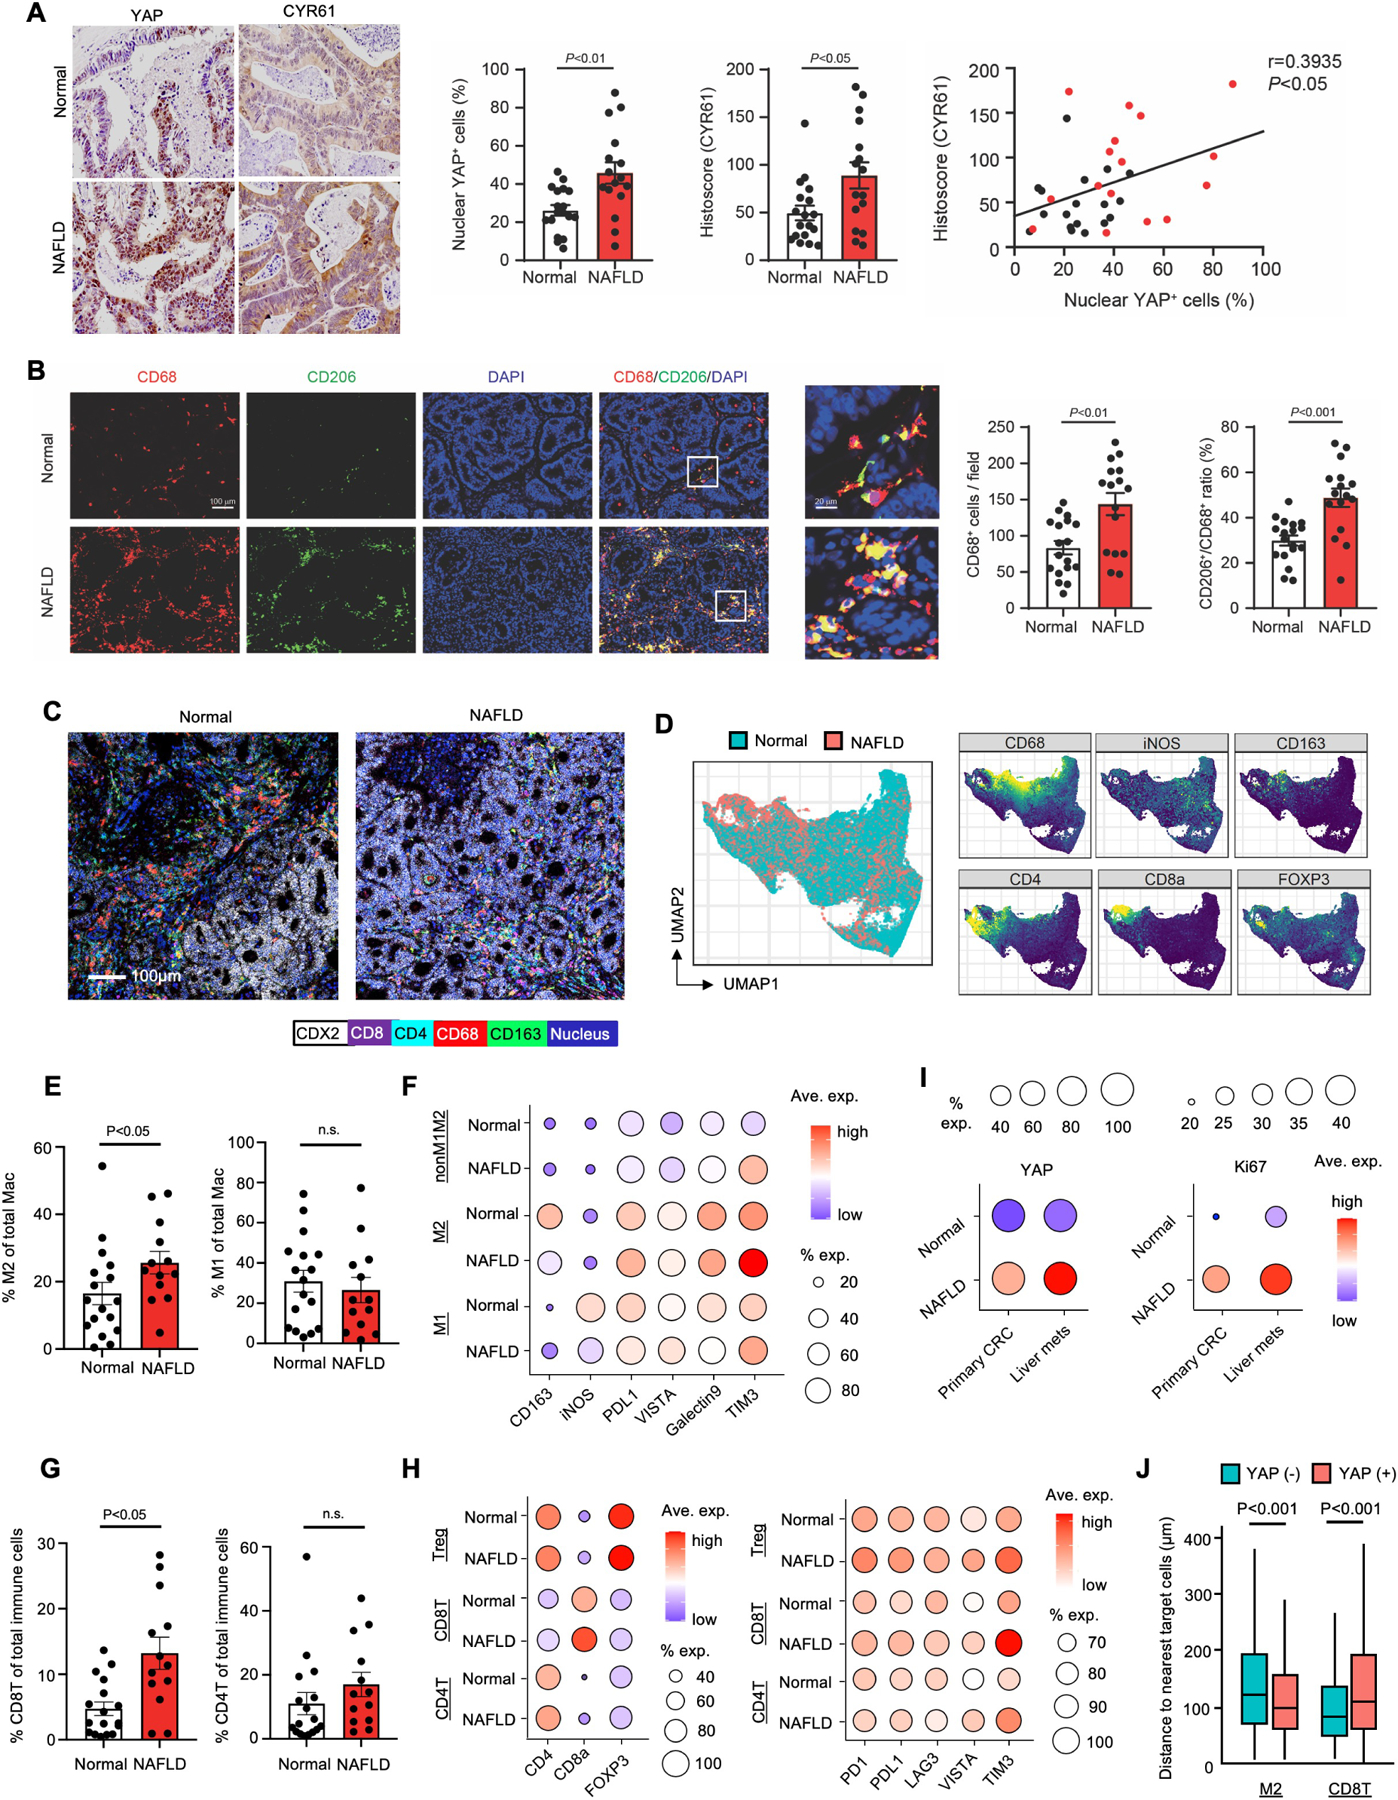
Liver metastasis is a major cause of death in patients with colorectal cancer (CRC). Fatty liver promotes liver metastasis, but the underlying mechanism remains unclear. We demonstrated that hepatocyte-derived extracellular vesicles (EVs) in fatty liver enhanced the progression of CRC liver metastasis by promoting oncogenic Yes-associated protein (YAP) signaling and an immunosuppressive microenvironment. Fatty liver upregulated Rab27a expression, which facilitated EV production from hepatocytes. In the liver, these EVs transferred YAP signaling-regulating microRNAs to cancer cells to augment YAP activity by suppressing LATS2. Increased YAP activity in CRC liver metastasis with fatty liver promoted cancer cell growth and an immunosuppressive microenvironment by M2 macrophage infiltration through CYR61 production. Patients with CRC liver metastasis and fatty liver had elevated nuclear YAP expression, CYR61 expression, and M2 macrophage infiltration. Our data indicate that fatty liver-induced EV-microRNAs, YAP signaling, and an immunosuppressive microenvironment promote the growth of CRC liver metastasis.

Keywords: CYR61; M2 macrophage; Rab27a; colon cancer; exosome; high-fat diet; liver metastasis; microRNA; non-alcoholic fatty liver disease; palmitate.


Conflict of interest statement

Declaration of interests M.N. is a member of the advisory board of Altimmune, BI, BMS, Cytodyn, 89BIO, EchoSens, Gilead, GSK, Madrgial, Merck, Novo Nordisk, OWL, Prespecturm, Pfizer, Roche Diagnostic, and Siemens, Terns and Takeda; received research support from Allergan, Akero, BMS, Gilead, Galectin, Genfit, GSK, Conatus, Corcept, Enanta, Madrigal, Novartis, Novo Nordisk, Shire, Takeda, Terns, Viking, and Zydus; and is a stockholder in Anaetos, Rivus Pharma, CIMA, ChronWell, and Viking.

Figures

Figure 1.
Figure 1.. Increased Extracellular Vesicle Release by Fatty Liver Enhances Metastatic Tumor Growth in the Liver
(A) Protocol for the HFD-induced CRC liver metastasis model. Mice were fed a HFD or a LFD for 8 weeks. MC38 cells were injected into the spleen two weeks before euthanasia. Representative macroscopic images. Scale bar, 1 cm. (B) Tumor number(Left). Maximum tumor size measured as the largest diameter of the largest tumor(right) (n=10/group). (C) EV particle numbers in the sera of LFD-fed and HFD-fed mice inoculated with MC38 cells (n=10/group)(left) and in the sera of healthy subjects (n=9) or patients with NAFLD (n=11)(right). (D) MC38 cells were treated with EVs from sera of LFD-fed and HFD-fed mice(left). HCT116 cells were treated with EVs from healthy controls and patients with NAFLD(right). Colony-forming assay (n=4/group). Control indicates cells without EV treatment. (E,F) In vitro migration and invasion assay. MC38 cells (left) and HCT116 cells (right) treated with EVs were placed in the upper chamber, and the number of cells that migrated and invaded to the lower chamber were quantified (n=4/group). Control indicates cells without EV treatment. (G) The expression of Rab27a, Rab27b, and Smpd3 in liver extracts of mice fed with a LFD or a HFD for 8 weeks (n=10/group). (H) Immunoblots and quantifications of liver lysates from (G)(left). Hepatic RAB27A protein expression in healthy controls or patients with NAFLD(right). (I) Comparison of hepatic RAB27A expression between healthy controls (n=26) and patients with NAFLD (n=31) from GSE126848. (J-N) After 6 weeks of LFD or HFD feeding, adenovirus expressing short hairpin RNA (shRNA) for Rab27a (shRab27a) or a scrambled-shRNA control (shCon) was administered intravenously to mice. MC38 cells were injected into the spleen 48 hours after adenoviral vector administration (n=8–9/group). (J) Hepatic Rab27a mRNA expression in non-tumor liver tissues. (K) Immunoblots and quantifications for Rab27a. (L) EV particle numbers in mouse serum. (M) Macroscopic images. Scale bar, 1 cm. (N) Number of metastatic tumors, and maximum tumor size. Data shown as mean ± SD (B,I,N) or mean ± SEM (C-G,J,L). Significance determined by two-tailed Student’s t-test (B,C,G,I) or one-way analysis of variance (ANOVA) with Tukey’s post hoc analysis (D-F,H,J-L,N). N.S., not significant. *P<0.05 versus LFD or control (H). *P<0.05 versus LFD-shCon; **P<0.01 versus HFD-shCon. (K). See also Figure S1 and Table S1.
Figure 2.
Figure 2.. MiRNAs Are the Functional Extracellular Vesicle Contents That Aggravate Colorectal Cancer Growth in Fatty Liver
(A) A heatmap of miRNAs. MiRNA PCR array for (1) EVs from the sera of healthy controls and patients with NAFLD, (2) EVs from mouse sera (8-week-LFD or HFD feeding), (3) EVs from sera of metastatic tumor-bearing mice fed a LFD or HFD, (4) EVs from primary hepatocytes (PHCs) of LFD or HFD-fed mice, and (5) EVs from vehicle (Veh)-treated or PA-treated mouse PHCs. The heatmaps illustrate the log2 (fold change) values. The heatmap diagram highlights six common miRNAs. miR-103, miR-25, and miR-92a are the top three differentially expressed miRNAs. (B) Effect of miR-25, miR-92, and miR-103 on colony formation. Representative images from the colony-forming assay of MC38 cells(upper), and the average colony numbers per field(lower) (n=4/group). (C) Transwell migration and invasion assay. MC38 cells were transfected with 50 nM control, miR-25, miR-92, or miR-103 mimics. Representative pictures are shown(upper). Quantification of migrated and invaded cells(lower) (n=4/group). (D,E) Effect of EVs with compound inhibition of miR-25, miR-92, and miR-103. Mouse PHCs were transfected with a combination of three antagomiRs or a control (100 nM each) for 48 hours. Then, cells were treated with 400 μM PA for an additional 24 hours. EVs were collected from the cells transfected with antagomiRs (PA-EVmiR-i) or a control (PA-EVControl). (D) Colony-forming assay. MC38 cells were treated with PA-EVmiR-i or PA-EVControl (n=4/group). (E) Transwell migration and invasion assay. MC38 cells were treated with PA-EVmiR-i or PA-EVControl for 48 hours and then placed in the top chamber, and the migration and invasion to the lower chamber were quantified (n=4/group). Data shown as mean ± SEM (B-E). Significance determined by one-way analysis of variance (ANOVA) with Tukey’s post hoc analysis (B,C) or two-tailed Student’s t-test (D,E). See also Figure S2 and Table S1.
Figure 3.
Figure 3.. Extracellular vesicle-miRNAs Promote YAP Activation in Colorectal Cancer Cells
(A) Venn diagram comparing three target-gene prediction algorithms by TargetScan, miRDB, and PicTar. Among the target genes predicted in humans and mice, tumor suppressor genes based on Gene Ontology and the KEGG Pathway were presented in the table. (B) Quantitative real-time PCR (qRT-PCR) assay for the predicted target genes of miR-25/92 and miR-103. MC38 cells were transfected with 50 nM miR-92, miR-25, and miR-103 mimics (n=3/group). (C) Effects of miR-25, miR-92, and miR-103 on YAP localization in MC38 cells. Representative immunofluorescent images(left). Quantification of nuclear/cytoplasmic YAP ratios(right) (n=3/group). DAPI, 4′,6-diamidino-2-phenylindole. (D) Vector constructs of WT and mutant pEZX-LATS2-3--UTR. (E) LATS2-3′-UTR luciferase activity assay using MC38 cells transfected with control, miR-25, miR-92, or miR-103 mimics for 48 hours (n=4/group). (F) qRT-PCR assay for Lats2 in lysates of MC38 cells treated with EVs. EVs were obtained from supernatants of hepatocytes treated with vehicle (Veh-EV), PA (PA-EV)(left), or hepatocytes transfected with antagomiRs for miR-25, miR-92, and miR-103 (PA-EVmiR-i) or a control (PA-EVControl) followed by PA treatment(right) (n=3/group). (G) Effects of EVs on YAP localization in MC38 cells. MC38 cells were treated with Veh-EV, PA-EV, PA-EVmiR-i, or PA-EVControl. Representative immunofluorescent images(left). Quantification of nuclear/cytoplasmic YAP ratios(right) (n=3/group). Data shown as mean ± SEM (B,C,E-G). Significance determined by two-tailed Student’s t-test (B,F,G) or one-way analysis of variance (ANOVA) with Tukey’s post hoc analysis (C,E). *P<0.05 and **P<0.01 versus control (B). N.S., not significant. See also Figure S3.
Figure 4.
Figure 4.. YAP Activity Contributes to Colorectal Cancer Liver Metastasis Enhanced by Non-Alcoholic Fatty Liver Disease
(A) RNA-seq for tumor samples from Figure 1A (n=5/group). GSEA for YAP target and oncogenic gene sets in tumors from LFD-fed and HFD-fed mice. A heatmap of YAP target genes. NES, normalized enrichment score; FDR, false discovery rate. (B) Immunoblots and quantification of whole cell lysates (WCL) and nuclear fractions (NF) from tumors in Figure 1A. (C) Representative images of immunohistochemistry for YAP in metastatic liver tumors in mice fed a LFD or HFD (n=10/group). Quantification of nuclear YAP+ cells. Scale bar, 100 μm. (D) qRT-PCR assays for Lats2, Yap, and YAP target genes (Ankrd1, Axl1, Ccn2, and Ccn1) in metastatic liver tumors in mice fed a LFD (n=5) or HFD (n=7). (E) Representative immunoblot images and quantifications for LATS2 and YAP in metastatic tumors. Samples were from Figure 1K. Adenovirus expressing shRab27a or shCon was administered into the tail vein before splenic injection of MC38 cells. (F) qRT-PCR assays for Yap and its target genes (Ankrd1, Axl1, Ccn2, and Ccn1) in metastatic liver tumors. (G) The effect of Yap1 knockdown in MC38 cells on colony formation, migration, and invasion (n=4 per group). MC38 cells with shCon or shRNA for Yap1 (shYap1) were treated with EVs from supernatant of vehicle-treated (bovine serum albumin, BSA) or PA-treated PHCs. (H-J) After 6 weeks of LFD or HFD feeding, MC38 cells with shCon or shYap1 were injected into the spleens of mice (n=7–8/group). (H) Representative macroscopic images of liver metastases. Scale bar, 1 cm. (I) Number of tumors, maximum tumor size (mm), and liver weights (g). (J) GSEA oncogenic gene sets in tumors from control and Yap-silenced tumors. Data shown as mean ± SEM (C,D,F,G) or mean ± SD (I). Significance determined by two-tailed Student’s t-test (C,D) or oneway ANOVA with Tukey’s post hoc analysis (B, E-G, and I). *P<0.05 versus LFD (B). *P<0.05 versus LFD-shCon; **P<0.01 versus HFD-shCon. (E). N.S., not significant. See also Figure S4.
Figure 5.
Figure 5.. CYR61 Is the Critical Factor for YAP-Mediated Liver Metastasis by Induction of an Immunosuppressive Tumor Microenvironment
(A) Co-localization of F4/80 and CD206 in tumors from Figure 4H. Representative immunofluorescent images. Quantification of F4/80+ cells and ratio of CD206+/F4/80+. qRT-PCR assays for Mrc1 (CD206), Arg1 (arginase 1), and Nos2 (iNOS) in tumors (n=5/group). (B) Liver macrophage migration assay. WT liver macrophages were placed in the upper chamber. Culture media only (negative control, NC) or MC38 cells stably overexpressing shCon or shYap1 were seeded in the lower chamber. Representative images (left). Quantification of migrated cells (right) (n=4/group). (C) qRT-PCR assays for Mrc1, Arg1, and Nos2 in liver macrophages. Liver macrophages were treated with media only (NC) or co-cultured with MC38 cells (shCon or shYap1) (n=4/group). (D) Representative images of immunohistochemistry for CYR61 in tumors from Figure 4H (LFD-shCon, LFD-shYap1, HFD-shCon, and HFD-shYap1). Scale bar, 100 μm. Quantification of CYR61-positive area. qRT-PCR assays for Yap1 and Ccn1 (n=5/group). (E) Liver macrophage migration assay. WT liver macrophages were placed in the upper chamber. Culture media only (NC) or MC38 cells with shCon or shRNA for Ccn1 (shCcn1) were seeded in the lower chamber. Representative images (left). Quantification of migrated cells (right) (n=4/group). qRT-PCR assays for Mrc1, Arg1, and Nos2 in liver macrophages. Liver macrophages were treated with media only (NC) or co-cultured with MC38 cells (shCon or shCcn1) (n=4/group). (F-H) MC38 cells with shCon or shCcn1 (LFD-shCon, LFD-shCcn1, HFD-shCon, and HFD-shCcn1) were inoculated in LFD-fed or HFD-fed mice. (F) Co-localization of F4/80 and CD206 in tumors. Representative immunofluorescent images (left). Quantification of F4/80+ cells, and ratio of CD206+/F4/80+ (n=5/group)(right). qRT-PCR assays for Mrc1, Arg1, and Nos2 in tumors (n=5/group). (G) Macroscopic pictures of livers (n=8=9/group). Scale bar, 1 cm. (H) Number of tumors. Maximum tumor size (mm). Liver weights (g). Data shown as mean ± SEM (A-F) or mean ± SD (H). Significance determined by one-way analysis of variance (ANOVA) with Tukey’s post hoc analysis (A-F,H). See also Figure S5.
Figure 6.
Figure 6.. Non-Alcoholic Fatty Liver Disease Contributes to Tumor-Promoting Tumor-associated Macrophages and CD8 T Cell Phenotypes in the Tumor Microenvironment of Colorectal Cancer Liver Metastasis
(A) Determination of tumor-infiltrating immune cell populations. Uniform manifold approximation and projection (UMAP) of single-cell RNA-seq (scRNA-seq) from 15,141 CD45+ cells showing 22 clusters determined by integrated analysis, colored by cluster. Cells were from metastatic liver tumors of LFD-fed and HFD-fed mice (n=3/group). (B) Stacked bar plots depict the proportion of immune cell types in metastatic liver tumors of LFD-fed and HFD-fed mice. (C) Re-clustered M2 macrophage subpopulations. Expression of CYR61 receptors Itgb5 and Itgav. (D) Heatmap of the M2b-like subpopulation is shown at a single-cell level. UMAPs and violin plots for Vegfa, Tgfbi, Tgfb3, Cxcl16, Il1b, Cd274, and Havcr2 expression. ****P<0.0001. (E) Dot plot for expression of key tumor-promoting and immunomodulatory genes (columns) by specific M2 subpopulations (rows). Dot size represents the cell fraction within the M2 subpopulations. Fill color indicates average expression (ave. exp.). (F) Re-clustering of CD8 T cells with and without Pdcd1 expression. Dot plot for expression of key immunomodulatory genes (columns) by CD8 T cell subpopulations (rows). (G) scRNA-seq of CD45+ cells from control and Yap1-silenced tumors of HFD-fed mice (n=3/group). Dot plot for expression of key tumor-promoting and immunomodulatory genes (columns) by specific M2 and CD8 T cell subpopulations (rows). See also Figure S6.
Figure 7.
Figure 7.. Increased YAP Activity and Immunosuppressive Tumor Microenvironment in Colorectal Cancer Liver Metastasis Patients with Non-Alcoholic Fatty Liver Disease
(A) Representative immunohistochemistry images of YAP and CYR61 in metastatic liver tumors of patients with NAFLD (n=16) or without NAFLD (n=18; Normal). Quantification of nuclear YAP+ cells and CYR61-positive areas in human CRC liver metastasis. The correlation between nuclear YAP+ cells and the CYR61-positive areas (right). (B) Co-localization of CD68 and CD206 in metastatic tumors of patients with NAFLD or without NAFLD (Normal). Representative immunofluorescent images. Quantification of CD68+ cells. Ratio of CD206+/CD68+ cells in human CRC liver metastasis. (C-H) IMC for TMA comprising CRC liver metastasis patients with NAFLD (n=13) and without NAFLD (n=17; Normal). (C) Representative IMC images for metastatic liver tumors for CDX2, CD8, CD4, CD68, and CD163 expression. (D) UMAP of IMC from 147,328 immune cells, colored to distinguish normal and NAFLD conditions (left). UMAPs of expression of CD68, iNOS, CD163, CD8, CD4, and FOXP3 (right). (E) Quantification of CD163-expressing (M2) and iNOS-expressing (M1) macrophages (Mac). (F) Dot plot for expression of key cluster-identification and immunomodulatory molecules (columns) by macrophage subpopulations from patients with or without NAFLD (rows). Dot size represents the cell fraction within each cell population. Fill color indicates average expression. (G) Quantification of CD8 and CD4 T cells. (H) Dot plot for expression of key cluster-identification and immunomodulatory molecules (columns) by T cell subpopulations in patients with or without NAFLD (rows). Dot size represents the cell fraction within each cell population. Fill color indicates average expression. (I) Dot plot for YAP and Ki67 expression in primary CRC and metastatic tumors (columns) in patients with or without NAFLD (rows). Dot size represents the cell fraction within each cell population. Fill color indicates average expression. (J) Spatial analysis of IMC to measure the distances between immune cells (M2 macrophages or CD8 T cells) and metastatic liver tumor cells with and without YAP expression (n=146,429 cells). Data shown as mean ± SEM (A,B,E,G) or mean ± SD (J). Significance determined by two-tailed Student’s t-test (A,B,G,J) or Mann-Whitney U test (E). See also Figure S7 and Table S2–S4.

Comment in

References

    1. Keum N, and Giovannucci E (2019). Global burden of colorectal cancer: emerging trends, risk factors and prevention strategies. Nat Rev Gastroenterol Hepatol 16, 713–732. 10.1038/s41575-019-0189-8. - DOI - PubMed
    1. Helling TS, and Martin M (2014). Cause of death from liver metastases in colorectal cancer. Ann Surg Oncol 21, 501–506. 10.1245/s10434-013-3297-7. - DOI - PubMed
    1. Wang J, Li S, Liu Y, Zhang C, Li H, and Lai B (2020). Metastatic patterns and survival outcomes in patients with stage IV colon cancer: A population-based analysis. Cancer Med 9, 361–373. 10.1002/cam4.2673. - DOI - PMC - PubMed
    1. Allen AM, Hicks SB, Mara KC, Larson JJ, and Therneau TM (2019). The risk of incident extrahepatic cancers is higher in non-alcoholic fatty liver disease than obesity - A longitudinal cohort study. J Hepatol 71, 1229–1236. 10.1016/j.jhep.2019.08.018. - DOI - PMC - PubMed
    1. Hamady ZZ, Rees M, Welsh FK, Toogood GJ, Prasad KR, John TK, and Lodge JP (2013). Fatty liver disease as a predictor of local recurrence following resection of colorectal liver metastases. Br J Surg 100, 820–826. 10.1002/bjs.9057. - DOI - PubMed

Publication types

MeSH terms