. 2023 May 18;30(5):486-498.e7.
doi: 10.1016/j.chembiol.2023.04.011. Epub 2023 May 11.

Human nuclear hormone receptor activity contributes to malaria parasite liver stage development

Affiliations

Human nuclear hormone receptor activity contributes to malaria parasite liver stage development

Nimisha Mittal et al. Cell Chem Biol. .

Abstract

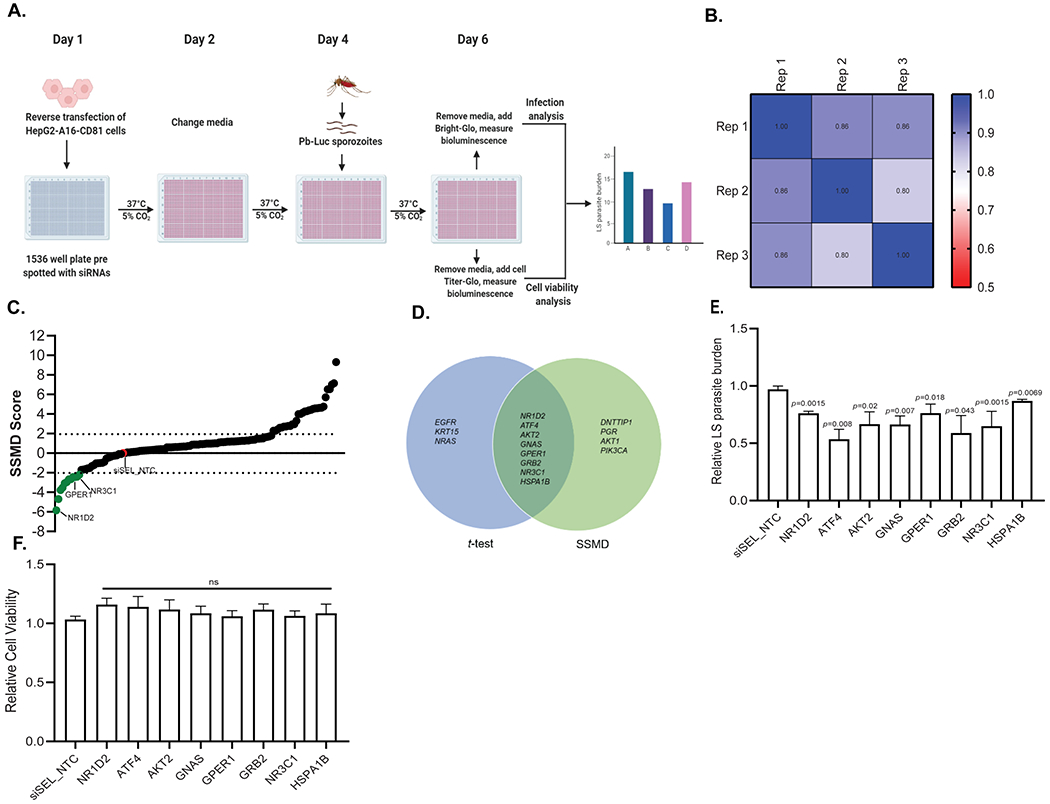
Chemical genetic approaches have had a transformative impact on discovery of drug targets for malaria but have primarily been used for parasite targets. To identify human pathways required for intrahepatic development of parasite, we implemented multiplex cytological profiling of malaria infected hepatocytes treated with liver stage active compounds. Some compounds, including MMV1088447 and MMV1346624, exhibited profiles similar to cells treated with nuclear hormone receptor (NHR) agonist/antagonists. siRNAs targeting human NHRs, or their signaling partners identified eight genes that were critical for Plasmodium berghei infection. Knockdown of NR1D2, a host NHR, significantly impaired parasite growth by downregulation of host lipid metabolism. Importantly, treatment with MMV1088447 and MMV1346624 but not other antimalarials, phenocopied the lipid metabolism defect of NR1D2 knockdown. Our data underlines the use of high-content imaging for host-cellular pathway deconvolution, highlights host lipid metabolism as a drug-able human pathway and provides new chemical biology tools for studying host-parasite interactions.

Keywords: Plasmodium; drug discovery; malaria; nuclear hormone receptors; phenotypic screening; siRNA.


Conflict of interest statement

Declaration of interests All authors affiliated with Recursion Pharmaceuticals, Inc have real or potential ownership of public equities in the company and thereby declare a potential conflict.

Figures

Figure 1:
Figure 1:. Plasmodium adapted Cell Painting assay applied to infected HepG2 cells identifies compounds that modulate host pathways.
(A) Morphological profiling of Plasmodium infected cellsOverview of the assay. 3000 HepG2 cells are were seeded in 384 multi-well plates. The cells were pretreated with the test antimalarials and reference compounds, respectively. Eighteen hours later cells were infected with P. berghei sporozoites at an MOI 1:3. Forty eight hours later cells were fixed. The cells were stained with different dyes and antibodies MitoTracker Deep Red, Hoechst 33342, Concanavalin A, SYTO 14 green fluorescent nucleic acid stain, Phalloidin, and wheat germ agglutinin. To visualize the schizonts PyHSP70 antibodywas used.. Images are acquired using ImageXpress MicroConfocal microscope. Each of 6 fluorescent channels were captured as an individual grayscale image. Using in-house deep learning algorithms, approximately 1000 morphological features were extracted from the acquired images using a deep convolutional neural network. These features were then used to create a phenoprint of the HepG2 cells treated with the test compound and compared with the profiles of those treated with reference compounds for pathway identification. Illustration was created with BioRender.com (B) HepG2 cells 48-hours post P. berghei sporozoite infection labeled with Hoechst 33342, ConA, Syto14, Phalloidin, WGA, Mitotracker Deep Red, and mouse anti HSP70 (P. berghei). Cells exposed to healthy sporozoites were compared to those exposed to irradiated sporozoites (negative control) from the same parasite extraction at the same concentration of sporozoites/mL. See also Figure S1. (C) A scaled (0-1), 1-dimensional projection of the positive (infected) and negative (irradiated) control populations illustrates the separability of the two classes in a representative experiment. This representation considers non-HSP70 features of the high dimensional space, with replicates aggregated (encompassing multiple sites for each well, and multiple wells that are sampled from the positive and negative control populations). (D) Antimalarial compounds compared to 10 MoA profiles extracted from the Recursion Landmark Library. The number of compounds in each class is displayed in black (left axis) and pathways that show a class enrichment in the 72 hits highlighted in pink (right axis). See also Table S1, S2, S3 and S4.
Figure 2:
Figure 2:. siRNA screen of NHR pathway members identifies host factors critical for P. berghei liver stage
(A) Schematic representation of the siRNA screenHepG2 cells were reverse tranfected with individual siRNAs in a 1536 well plate. Forty eight hours post siRNA transfection, P. berghei sporozoites expressing luciferase (Pb Luc) were added to the cells (MOI=0.3 and relative liver cell viability and parasite load were measured at forty eight hours post infection.. Illustration was created with BioRender.com. See also Table S5. (B) Pearson correlation analysis of all three biological replicates. The r value was calculated using GraphPad Prism V 8.3.0. (C) SSMD score analysis of 137 genes tested for reduction in Plasmodium liver stage infections. Genes highlighted in green represent those wherein knockdown had reduced infection with SSMD score ≤ −2. See also Table S6. (D) Venn diagram of the genes that were identified as hits with two tailed t-tests and SSMD score analysis. (E & F) Bar graph representing the relative infection leve€(E) and relative cell viability (F) in the eight genes that were identified as common hits between the two methods. The p value is indicated on top of each bar. Data represents Mean ± S.D.
Figure 3:
Figure 3:. Knockdown of host NR1D2 affects the intra-hepatic development of the schizonts.
(A) Reads per kilo base per million mapped reads (RPKM) of NR1D2 transcripts detected in infected sorted and uninfected sorted cells. The bars represent expression in indicated cells lines at varying time points. Statistical significance was calculated using GraphPad Prism V 8.3.0 (unpaired t-test). (B) P. berghei infection levels (Pb18s/hhPRT) in HepG2 shNR1D2 and HC-04 shNR1D2 cell lines. Briefly, cells were infected with P. berghei sporozoites at a MOI of 1:2. Forty eight hours later, cells were harvested, total RNA was extracted and cDNA was synthesized to set up qRT PCR reactions. The infection levels were estimated by calculating the relative amounts of Pb 18s mRNA against the Hypoxanthine Guanine Phosphoribosyltransferase (HPRT) housekeeping gene. Data shown above represents mean ± S.D., with n=3 for HC-04 (G) cells and n=2 for HepG2 cells. Statistical significance was calculated using GraphPad Prism V 8.3.0 (unpaired students t-test).See also Figure S2, Table S7. (C) Knockdown of NR1D2 does not impair the invasion of the host cells by the parasite, rather causes either developmental arrest or enhanced clearance of the parasite, in vitro.Briefly, HC-04 shNR1D2 and shSCR cells were infected with P. berghei sporozoites at a MOI of 1:2, cells were harvested at 4 hours and 48 hours post infection, RNA was extracted, and qPCR was set up. Infection level was estimated by calculating the relative amounts of Pb 18s mRNA against the Hypoxanthine Guanine Phosphoribosyltransferase (HPRT) housekeeping gene. The data shown above represents mean ± S.D., with n=2. Statistical significance was calculated using GraphPad Prism V 8.3.0 (unpaired student’s t-test). (D & E) Percent infection (D) and the relative size of the EEFs (μM2) (E) in HC-04 shSCR and shNR1D2. Cells wereinfected with P. berghei sporozoites at an MOI of 1:1. 48 hpi, cells were fixed, stained, and imaged using Operetta Confocal High Content Screening System. The percent infection and the size of the EEFs were determined as described in the methods section. Data shown represents two independent experiments (n=50). Statistical significance was calculated using GraphPad Prism V 8.3.0 (unpaired student’s t-test, assuming unequal variance). (F) Confocal microscopy images of representative HC-04 shSCR and shNR1D2 cells infected with P. berghei for 48 h. Cells were labelled with HsNR1D2 rabbit polyclonal antibody (dilution 1:500) and visualized using Alexa Fluor® 647 AffiniPure Mouse Anti-Rabbit IgG (H+L) (dilution 1:500) for host NR1D2. EEFs were stained using UIS4 (Plasmodium berghei UIS4) goat polyclonal antibody (dilution 1:1000 from a 2 mg/ml stock) and visualized using Alexa Fluor 488-conjugated AffiniPure Goat Anti-Rabbit IgG, (dilution 1:1000). DAPI (blue) was used to visualize the nuclei. Merged images for PbUIS4, HsNR1D2 and DAPI are shown. Scale bars represent 10 μM, 63x oil objective at zoom 4. (G) Number of merozoites per schizont in HC-04 shSCR and shNR1D2 cells, respectively. The number of merozoites/ schizont in each cell line was counted using ImageJ software. The data represents two biological replicates (n=14). Statistical significance was calculated using GraphPad Prism V 8.3.0 (unpaired student’s t-test, assuming unequal variance). (H) Volcano plot of gene-expression pattern vs. p value. Genes with Log2 fold change <−1 or >1 are highlighted in red and green, respectively. The position of genes specifically downregulated in the lipid metabolic pathways are indicated. See also Table S8, S9 and S10. (I) Bar plot showing the enriched pathways for the genes downregulated in HC-04 shNR1D2 cells, relative to control shSCR cells. The x-axis indicates the enrichment significance (−log10 (p value) for each pathway term and the y-axis represents the GO term. Ordering is based on significance, with the bottom terms having the highest significance. See also Table S8, S9 and S10. (J) Confocal microscopy images of representative HC-04 shSCR and shNR1D2 cells infected with P. berghei for 48 h. Cells were stained with HCS LipidTOX (dilution 1:500) to visualize the lipid droplets. EEFs were stained using UIS4 (Plasmodium berghei UIS4) goat polyclonal antibody (dilution 1:1000 from a 2 mg/ml stock) and visualized using Alexa Fluor 488-conjugated AffiniPure Goat Anti-Rabbit IgG, (dilution 1:1000). DAPI (blue) was used to visualize the nuclei.Merged images for PbUIS4, HCS LipidTox and DAPI are shown. Scale bars represent 10 μM, 63x oil objective at zoom 4. See also Figure S3 (K) Mean fluorescence intensity (MFI) of the lipid droplets in HC-04 shSCR and shNR1D2 cells infected with P. berghei for 48 h. The MFI for each infected field was counted using ImageJ software. The data represents two biological replicates (n=17). Statistical significance was calculated using GraphPad Prism V 8.3.0 (unpaired student’s t-test, assuming unequal variance).
Figure 4:
Figure 4:. NHR modulating compounds phenocopy NR1D2 knockdown in host cells
(A) Chemical structures of MMV1088447 and MMV1346624, that were identified as potential nuclear hormone receptor modulating compounds. The IC50 values of these compounds in P. berghei luciferase, cytotoxicity, recombinant luciferase (rLuc) and asexual blood stage assays are mentioned. See also Figure S6 and S7. (B) Confocal microscopy images of P. berghei infected HC-04 cells treated with DMSO, MMV1088447, MMV1346624 and ARN5187, respectively, for 48h. HC-04 cells were pretreated with the mentioned concentrations of each test and control compound. Pretreated cells were infected 24 hours later with P. berghei sporozoites. 48 hpi, cells were fixed and processed for imaging. Cells were labelled with HsNR1D2 rabbit polyclonal antibody (dilution 1:500) and visualized using Alexa Fluor® 647 AffiniPure Mouse Anti-Rabbit IgG (H+L) (dilution 1:500) for host NR1D2. HCS LipidTOX (dilution 1:500) was used to visualize the lipid droplets. EEFs were stained using UIS4 (Plasmodium berghei UIS4) goat polyclonal antibody (dilution 1:1000 from a 2 mg/ml stock) and visualized using Alexa Fluor 488-conjugated AffiniPure Goat Anti-Rabbit IgG, (dilution 1:1000). DAPI (blue) was used to visualize the nuclei.Merged images for PbUIS4, HCS LipidTox, DAPI and HsNR1D2 are shown. Scale bars represent 10 μM, 63x oil objective at zoom 4. See also Figure S4 and S5. (C) Number of merozoites per schizont in HC-04 cells treated with DMSO, MMV1088447, MMV1346624 and ARN5187, respectively, for 48h. The number of merozoites/schizont was counted using ImageJ software. The data represents two biological replicates. Statistical significance was calculated using GraphPad Prism V 8.3.0 (One way ANOVA, Dunnett’s multiple comparisons test). (D) Mean fluorescence intensity (MFI) of the lipid droplets in HC-04 cells treated with DMSO, MMV1088447, MMV1346624 and ARN5187, respectively, for 48h. The MFI for each infected field was counted using ImageJ software. The data represents two biological replicates. Statistical significance was calculated using GraphPad Prism V 8.3.0 (One way ANOVA, Dunnett’s multiple comparisons test). (E) Mean fluorescence intensity (MFI) of the NR1D2 in HC-04 cells treated with DMSO, MMV1088447, MMV1346624 and ARN5187, respectively, for 48h. The MFI for each infected field was counted using ImageJ software. The data represents two biological replicates. Statistical significance was calculated using GraphPad Prism V 8.3.0 (One way ANOVA, Dunnett’s multiple comparisons test). (F) Relative expression levels of NR1D2 in uninfected HC-04 cells treated with the indicated concentrations of MMV1088447, MMV1346624 and ARN5187, respectively, for 48h. Post treatment cells were lysed and the expression levels of HsNR1D2 was analyzed using HsNR1D2 rabbit polyclonal antibody. B actin was used as loading control.

References

    1. Mota MM, Hafalla JC, and Rodriguez A (2002). Migration through host cells activates Plasmodium sporozoites for infection. Nat Med 8, 1318–1322. 10.1038/nm785. - DOI - PubMed
    1. Lindner SE, Miller JL, and Kappe SH (2012). Malaria parasite pre-erythrocytic infection: preparation meets opportunity. Cell Microbiol 14, 316–324. 10.1111/j.1462-5822.2011.01734.x. - DOI - PMC - PubMed
    1. Meis JF, Verhave JP, Jap PH, Sinden RE, and Meuwissen JH (1983). Ultrastructural observations on the infection of rat liver by Plasmodium berghei sporozoites in vivo. J Protozool 30, 361–366. 10.1111/j.1550-7408.1983.tb02931.x. - DOI - PubMed
    1. Vaughan AM, Mikolajczak SA, Wilson EM, Grompe M, Kaushansky A, Camargo N, Bial J, Ploss A, and Kappe SH (2012). Complete Plasmodium falciparum liver-stage development in liver-chimeric mice. J Clin Invest 122, 3618–3628. 10.1172/JCI62684. - DOI - PMC - PubMed
    1. LaMonte GM, Orjuela-Sanchez P, Calla J, Wang LT, Li S, Swann J, Cowell AN, Zou BY, Abdel-Haleem Mohamed AM, Villa Galarce ZH, et al. (2019). Dual RNA-seq identifies human mucosal immunity protein Mucin-13 as a hallmark of Plasmodium exoerythrocytic infection. Nat Commun 10, 488. 10.1038/s41467-019-08349-0. - DOI - PMC - PubMed

Publication types

Substances