

MitoQuicLy: A high-throughput method for quantifying cell-free DNA from human plasma, serum, and saliva
- PMID: 37172669
- PMCID: PMC10524316
- DOI: 10.1016/j.mito.2023.05.001
MitoQuicLy: A high-throughput method for quantifying cell-free DNA from human plasma, serum, and saliva
Abstract
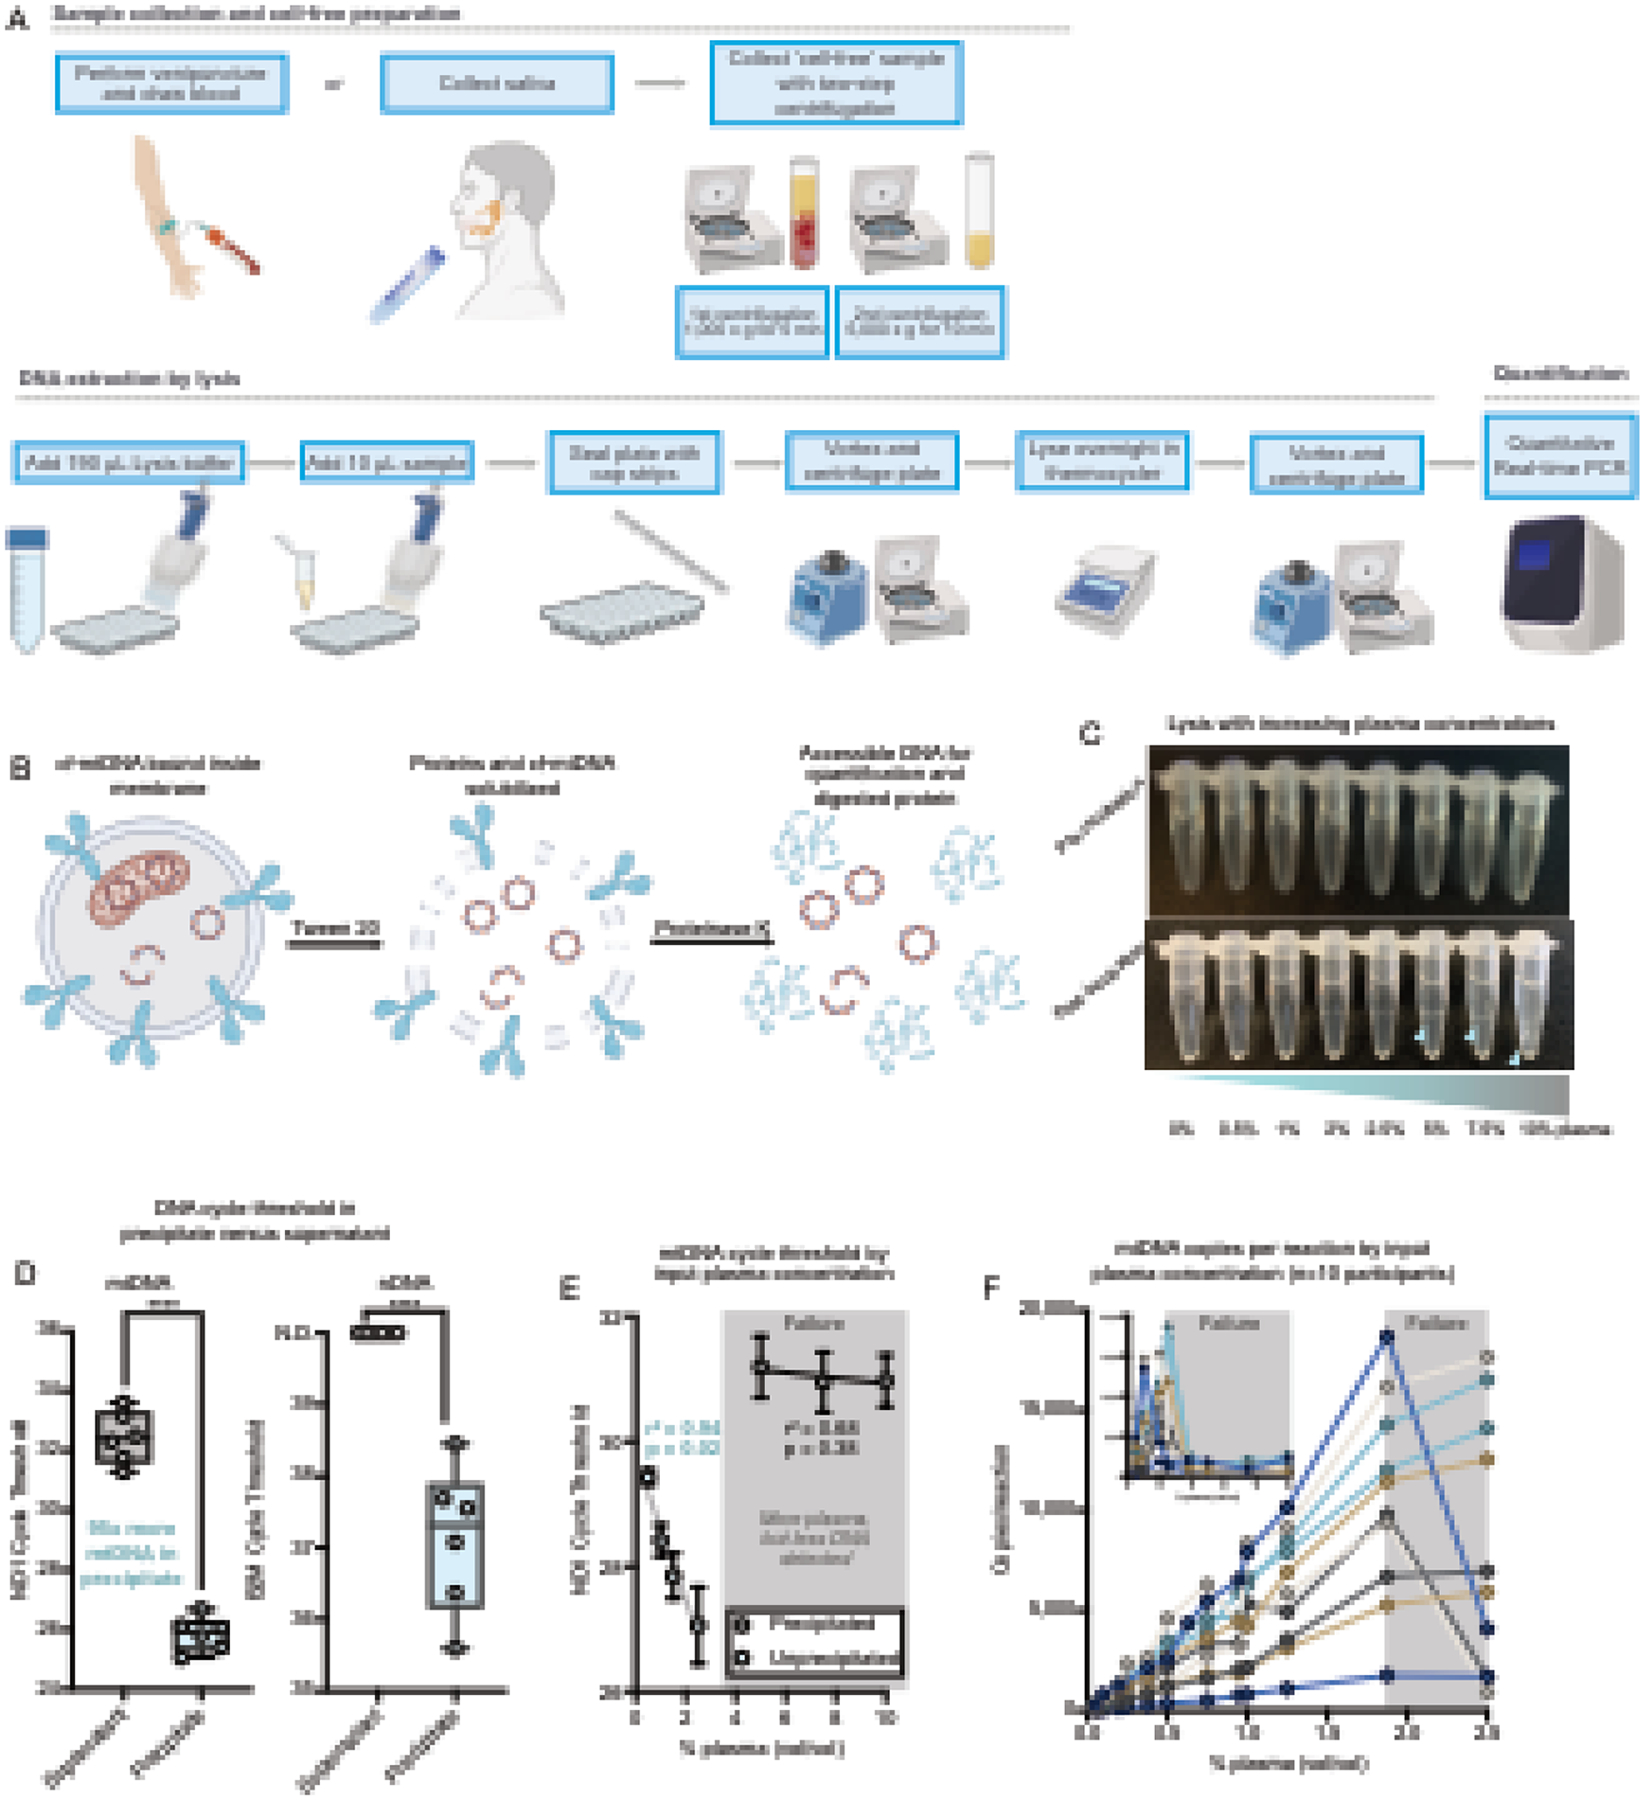
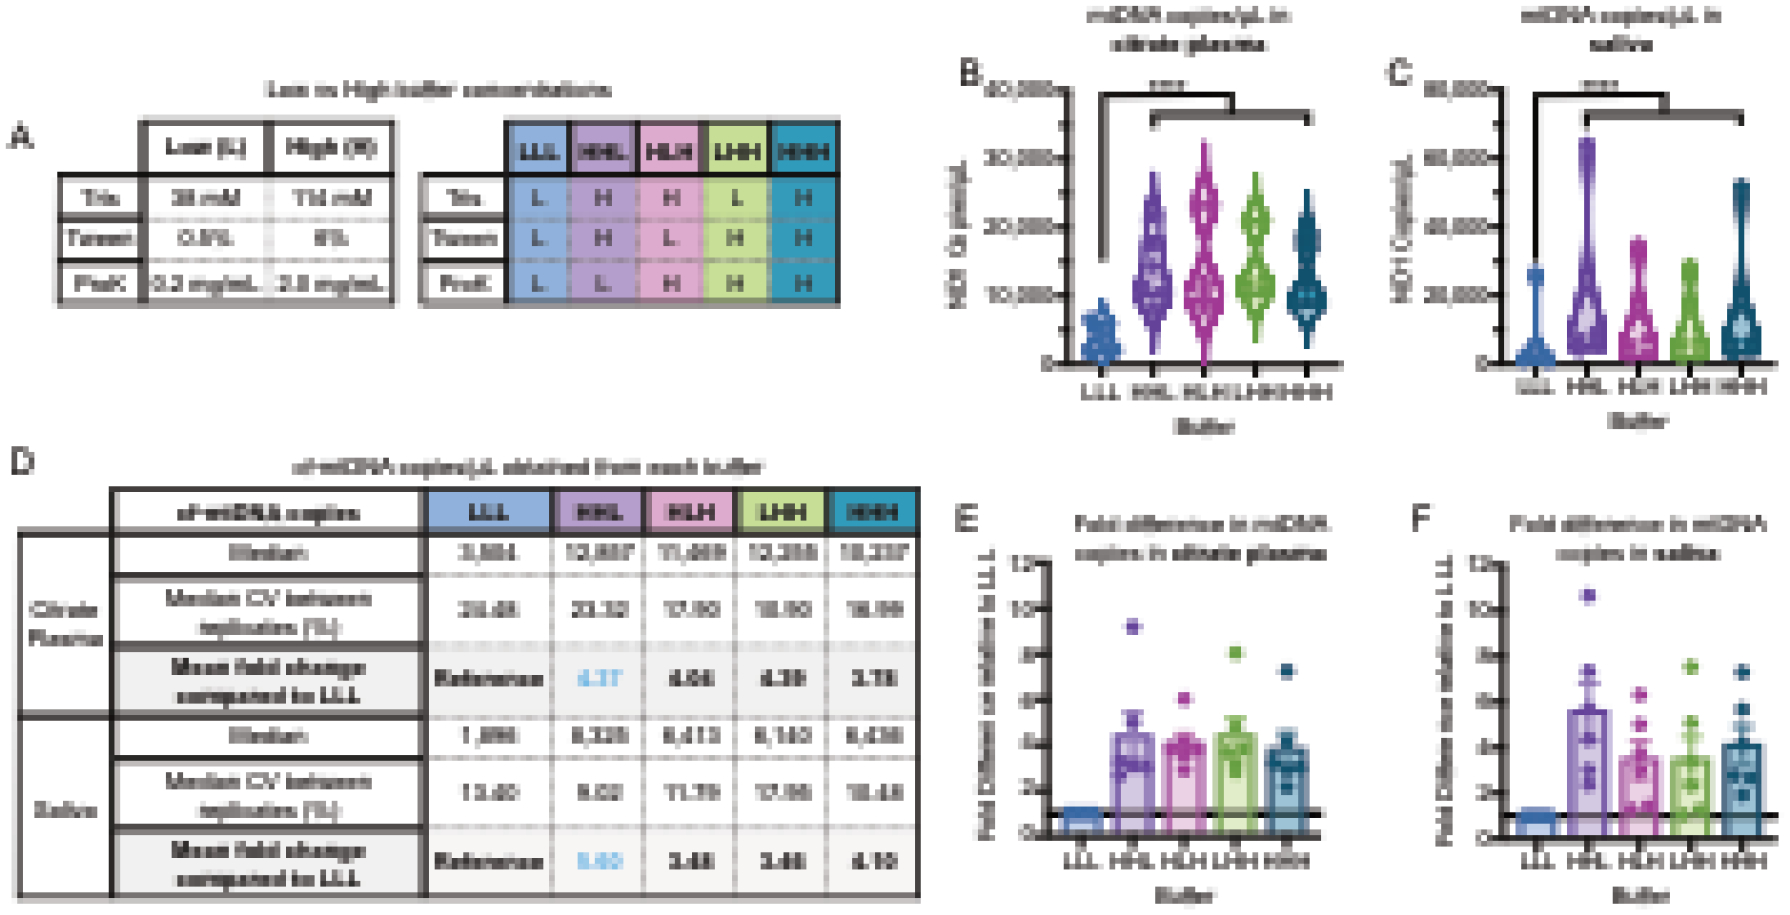
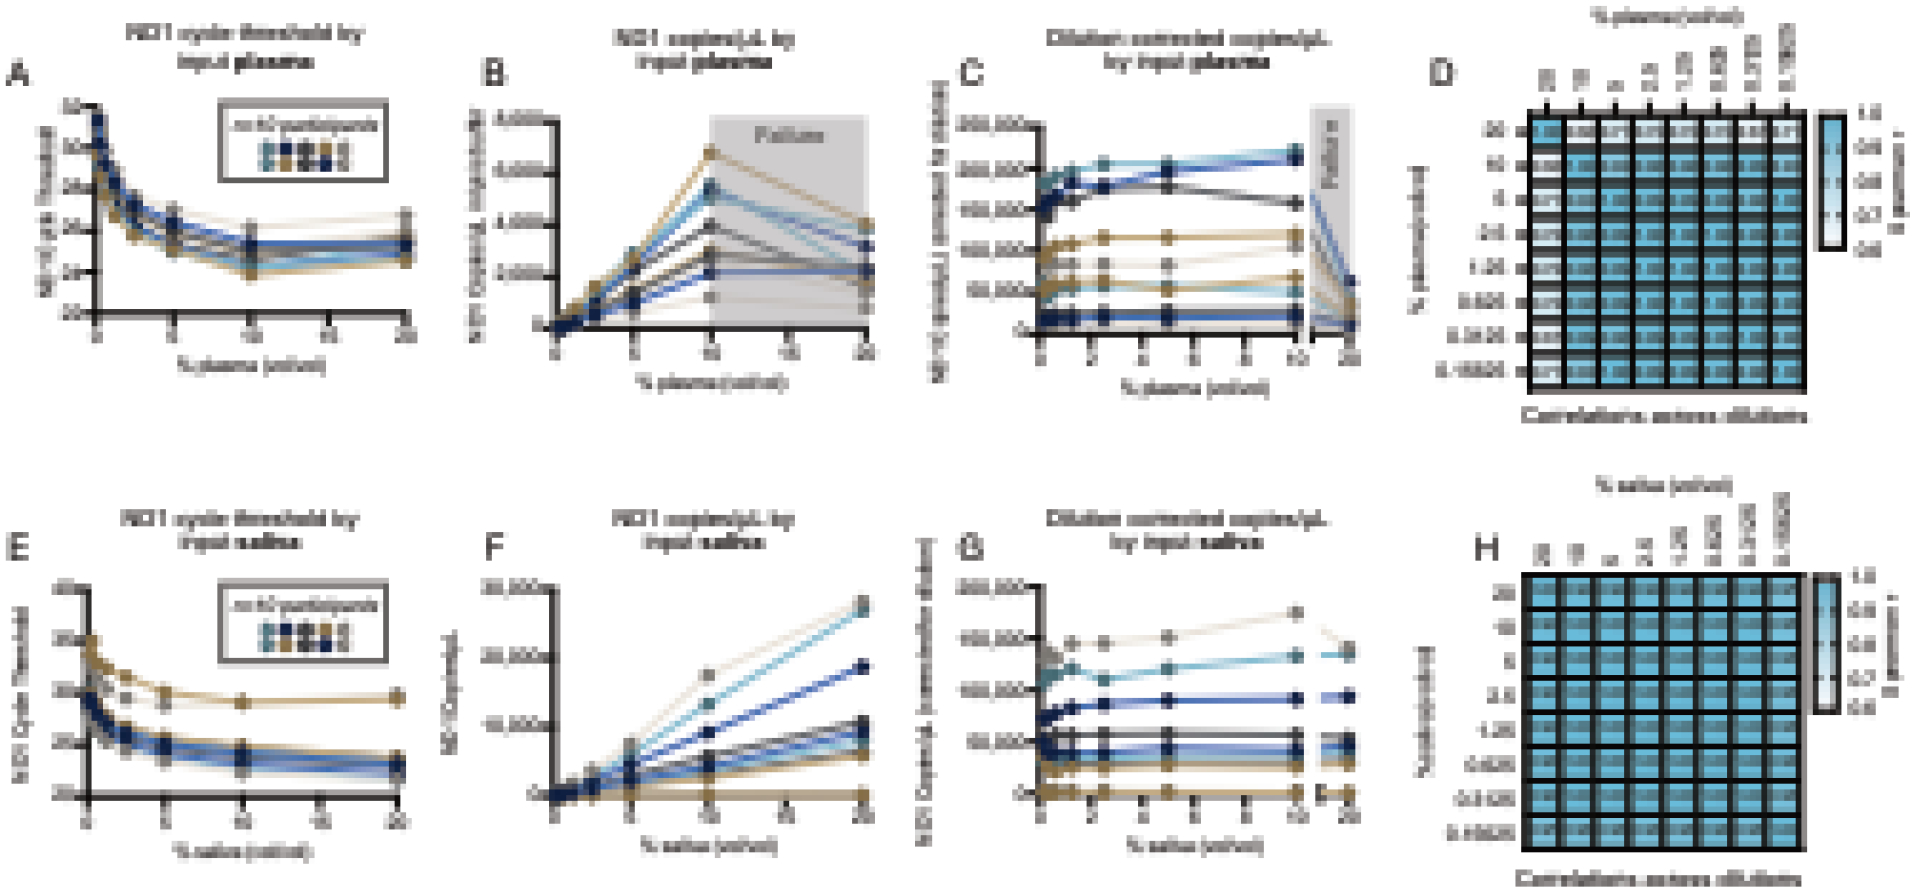
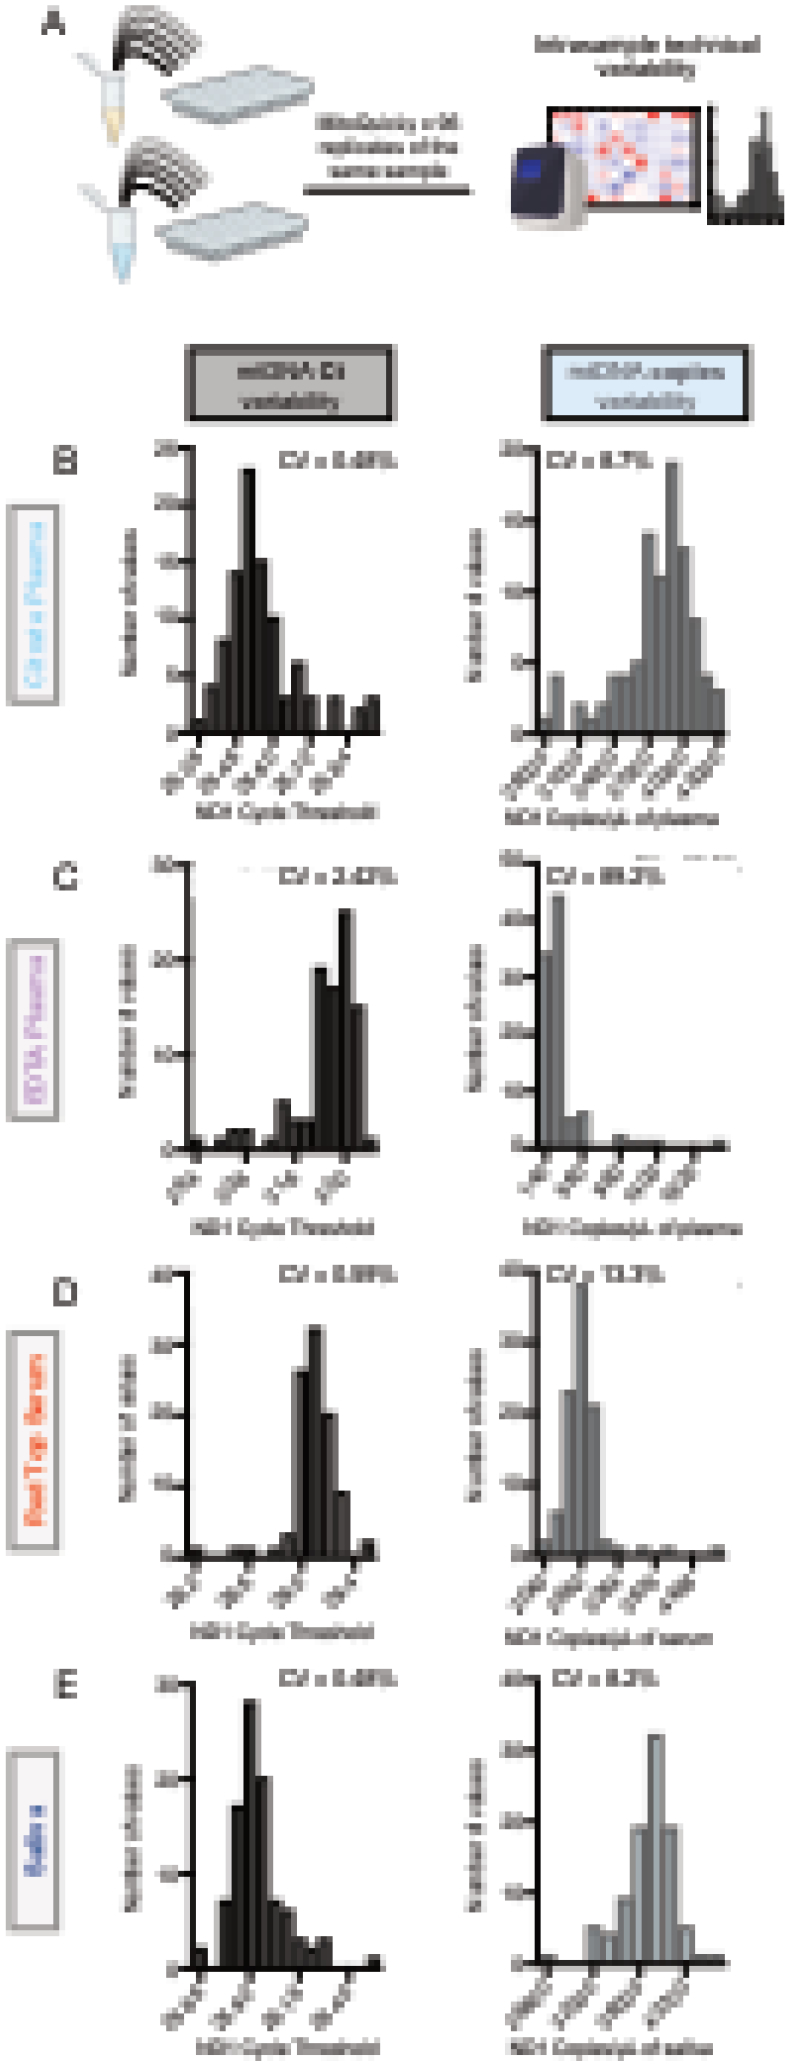
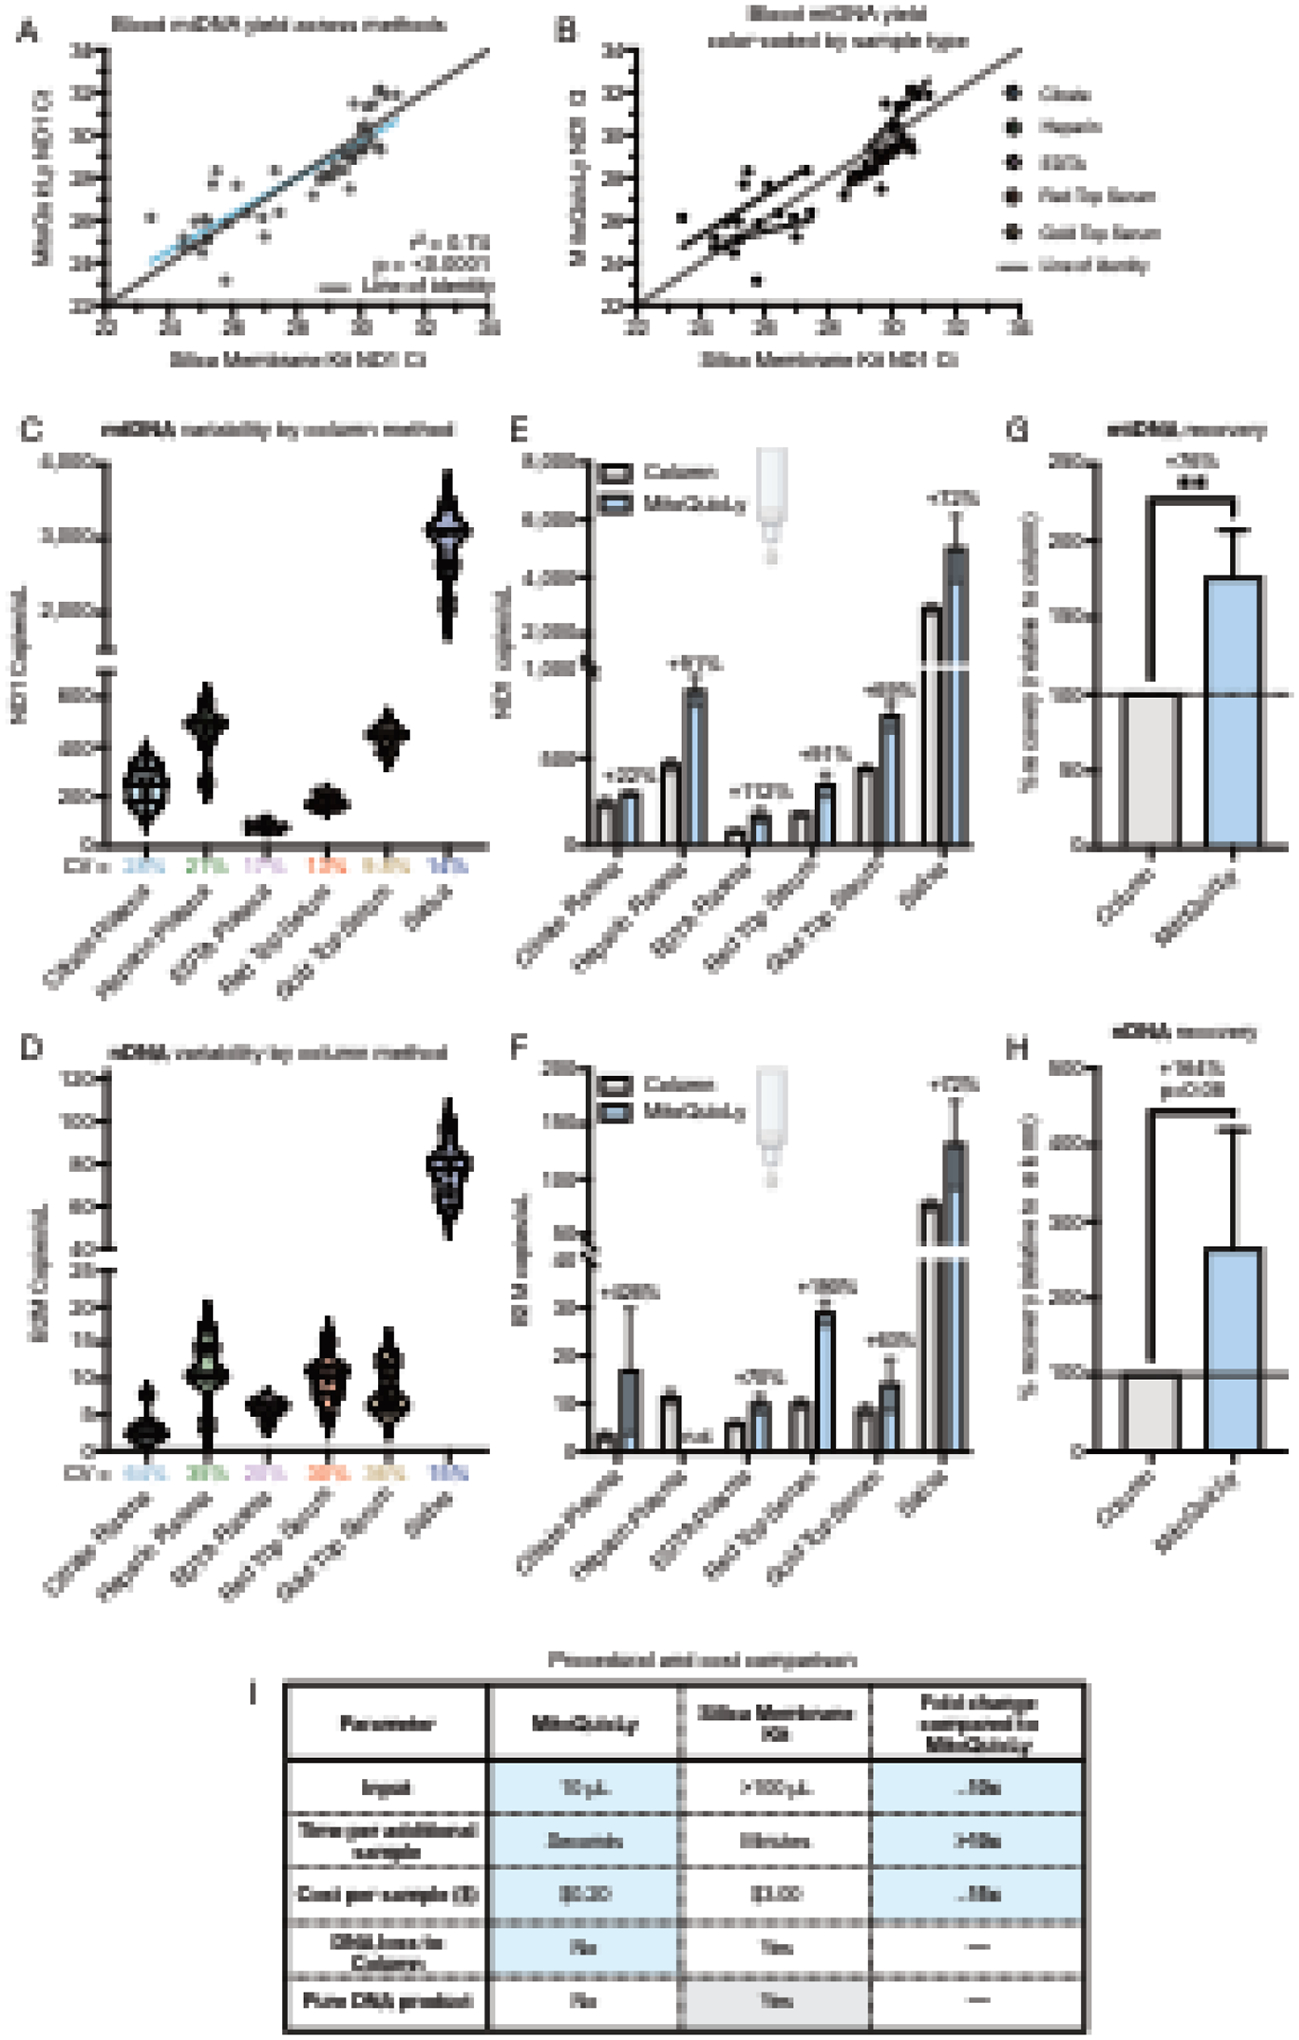
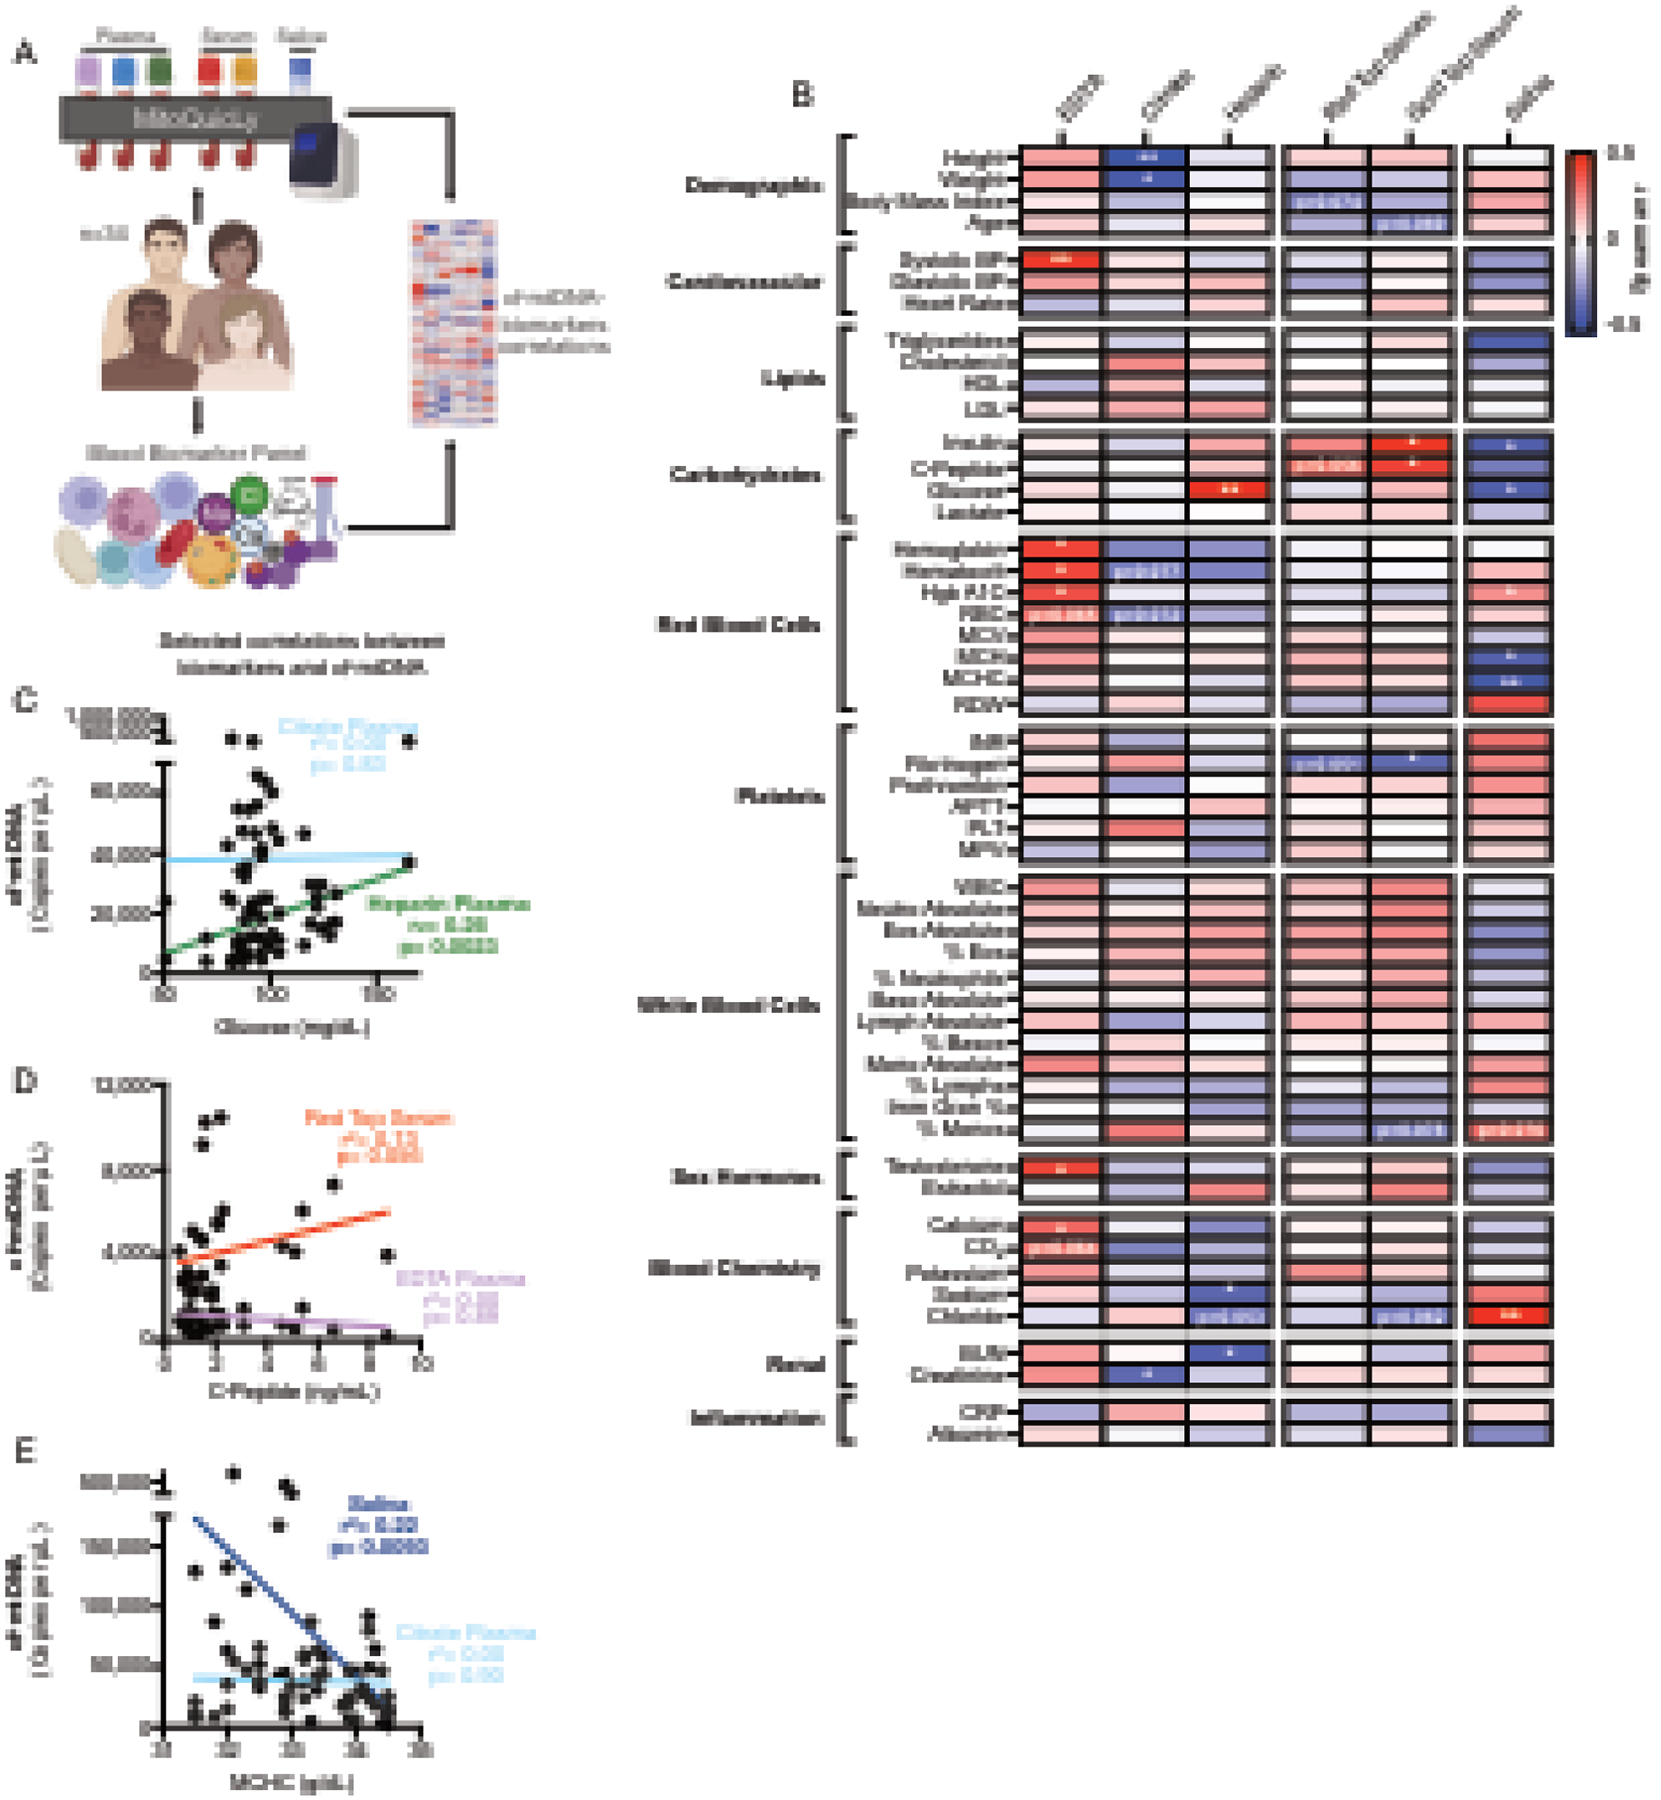
Circulating cell-free mitochondrial DNA (cf-mtDNA) is an emerging biomarker of psychobiological stress and disease which predicts mortality and is associated with various disease states. To evaluate the contribution of cf-mtDNA to health and disease states, standardized high-throughput procedures are needed to quantify cf-mtDNA in relevant biofluids. Here, we describe MitoQuicLy: Mitochondrial DNA Quantification in cell-free samples by Lysis. We demonstrate high agreement between MitoQuicLy and the commonly used column-based method, although MitoQuicLy is faster, cheaper, and requires a smaller input sample volume. Using 10 µL of input volume with MitoQuicLy, we quantify cf-mtDNA levels from three commonly used plasma tube types, two serum tube types, and saliva. We detect, as expected, significant inter-individual differences in cf-mtDNA across different biofluids. However, cf-mtDNA levels between concurrently collected plasma, serum, and saliva from the same individual differ on average by up to two orders of magnitude and are poorly correlated with one another, pointing to different cf-mtDNA biology or regulation between commonly used biofluids in clinical and research settings. Moreover, in a small sample of healthy women and men (n = 34), we show that blood and saliva cf-mtDNAs correlate with clinical biomarkers differently depending on the sample used. The biological divergences revealed between biofluids, together with the lysis-based, cost-effective, and scalable MitoQuicLy protocol for biofluid cf-mtDNA quantification, provide a foundation to examine the biological origin and significance of cf-mtDNA to human health.
Keywords: Cell-free DNA; Circulating nucleic acids; DNA isolation; Mitochondria; Mitochondrial DNA; Protocol.
Copyright © 2023 Elsevier B.V. and Mitochondria Research Society. All rights reserved.
Conflict of interest statement
Declaration of Competing Interest The authors declare that they have no known competing financial interests or personal relationships that could have appeared to influence the work reported in this paper.
Figures

Update of
-
MitoQuicLy: a high-throughput method for quantifying cell-free DNA from human plasma, serum, and saliva.bioRxiv [Preprint]. 2023 Jan 4:2023.01.04.522744. doi: 10.1101/2023.01.04.522744. bioRxiv. 2023. Update in: Mitochondrion. 2023 Jul;71:26-39. doi: 10.1016/j.mito.2023.05.001. PMID: 36711938 Free PMC article. Updated. Preprint.
Similar articles
-
MitoQuicLy: a high-throughput method for quantifying cell-free DNA from human plasma, serum, and saliva.bioRxiv [Preprint]. 2023 Jan 4:2023.01.04.522744. doi: 10.1101/2023.01.04.522744. bioRxiv. 2023. Update in: Mitochondrion. 2023 Jul;71:26-39. doi: 10.1016/j.mito.2023.05.001. PMID: 36711938 Free PMC article. Updated. Preprint.
-
Dynamic behavior of cell-free mitochondrial DNA in human saliva.Psychoneuroendocrinology. 2022 Sep;143:105852. doi: 10.1016/j.psyneuen.2022.105852. Epub 2022 Jun 30. Psychoneuroendocrinology. 2022. PMID: 35834882 Free PMC article.
-
A case for measuring both cellular and cell-free mitochondrial DNA as a disease biomarker in human blood.FASEB J. 2020 Sep;34(9):12278-12288. doi: 10.1096/fj.202000959RR. Epub 2020 Jul 29. FASEB J. 2020. PMID: 32729179
-
Circulating Cell-Free Nucleic Acids: Main Characteristics and Clinical Application.Int J Mol Sci. 2020 Sep 17;21(18):6827. doi: 10.3390/ijms21186827. Int J Mol Sci. 2020. PMID: 32957662 Free PMC article. Review.
-
Is mitochondrial DNA content a potential biomarker of mitochondrial dysfunction?Mitochondrion. 2013 Sep;13(5):481-92. doi: 10.1016/j.mito.2012.10.011. Epub 2012 Oct 22. Mitochondrion. 2013. PMID: 23085537 Review.
Cited by
-
Decoding the nature and complexity of extracellular mtDNA: Types and implications for health and disease.Mitochondrion. 2024 Mar;75:101848. doi: 10.1016/j.mito.2024.101848. Epub 2024 Jan 20. Mitochondrion. 2024. PMID: 38246335 Free PMC article.
-
Frailty Assessment for Risk prediction in Gynecologic Oncology patients undergoing surgery and chemotherapy (FARGO) study protocol: Rationale and design of a multi-centre prospective cohort study.PLoS One. 2025 Jul 28;20(7):e0325651. doi: 10.1371/journal.pone.0325651. eCollection 2025. PLoS One. 2025. PMID: 40720507 Free PMC article.
-
The researcher's guide to selecting biomarkers in mental health studies.Bioessays. 2024 Oct;46(10):e2300246. doi: 10.1002/bies.202300246. Epub 2024 Sep 11. Bioessays. 2024. PMID: 39258367 Review.
-
Circulating cell-free mtDNA as a new biomarker for cancer detection and management.Cancer Biol Med. 2023 Oct 12;21(2):105-10. doi: 10.20892/j.issn.2095-3941.2023.0280. Cancer Biol Med. 2023. PMID: 37823689 Free PMC article. No abstract available.
-
Saliva and blood cell-free mtDNA reactivity to acute psychosocial stress.Psychoneuroendocrinology. 2025 Sep;179:107506. doi: 10.1016/j.psyneuen.2025.107506. Epub 2025 Jun 6. Psychoneuroendocrinology. 2025. PMID: 40578003
References
-
- Al Amir Dache Z, Otandault A, Tanos R, Pastor B, Meddeb R, Sanchez C, Arena G, Lasorsa L, Bennett A, Grange T, El Messaoudi S, Mazard T, Prevostel C, Thierry AR, 2020. Blood contains circulating cell-free respiratory competent mitochondria. FASEB J. - PubMed
-
- Aucamp J, Bronkhorst AJ, Badenhorst CPS, Pretorius PJ, 2018. The diverse origins of circulating cell-free DNA in the human body: a critical re-evaluation of the literature. Biol Rev Camb Philos Soc 93, 1649–1683. - PubMed
-
- Boudreau LH, Duchez AC, Cloutier N, Soulet D, Martin N, Bollinger J, Pare A, Rousseau M, Naika GS, Levesque T, Laflamme C, Marcoux G, Lambeau G, Farndale RW, Pouliot M, Hamzeh-Cognasse H, Cognasse F, Garraud O, Nigrovic PA, Guderley H, Lacroix S, Thibault L, Semple JW, Gelb MH, Boilard E, 2014. Platelets release mitochondria serving as substrate for bactericidal group IIA-secreted phospholipase A2 to promote inflammation. Blood 124, 2173–2183. - PMC - PubMed
-
- Brestoff JR, Wilen CB, Moley JR, Li Y, Zou W, Malvin NP, Rowen MN, Saunders BT, Ma H, Mack MR, Hykes BL, Balce DR, Orvedahl A, Williams JW, Rohatgi N, Wang X, McAllaster MR, Handley SA, Kim BS, Doench JG, Zinselmeyer BH, Diamond MS, Virgin HW, Gelman AE, Teitelbaum SL, 2021. Intercellular Mitochondria Transfer to Macrophages Regulates White Adipose Tissue Homeostasis and Is Impaired in Obesity. Cell Metabolism 33, 270–282.e278. - PMC - PubMed
Publication types
MeSH terms
Substances
Grants and funding
LinkOut - more resources
Full Text Sources
