. 2023 May 12;10(1):275.
doi: 10.1038/s41597-023-02170-7.

Global transmission suitability maps for dengue virus transmitted by Aedes aegypti from 1981 to 2019

Affiliations

Global transmission suitability maps for dengue virus transmitted by Aedes aegypti from 1981 to 2019

Taishi Nakase et al. Sci Data. .

Abstract

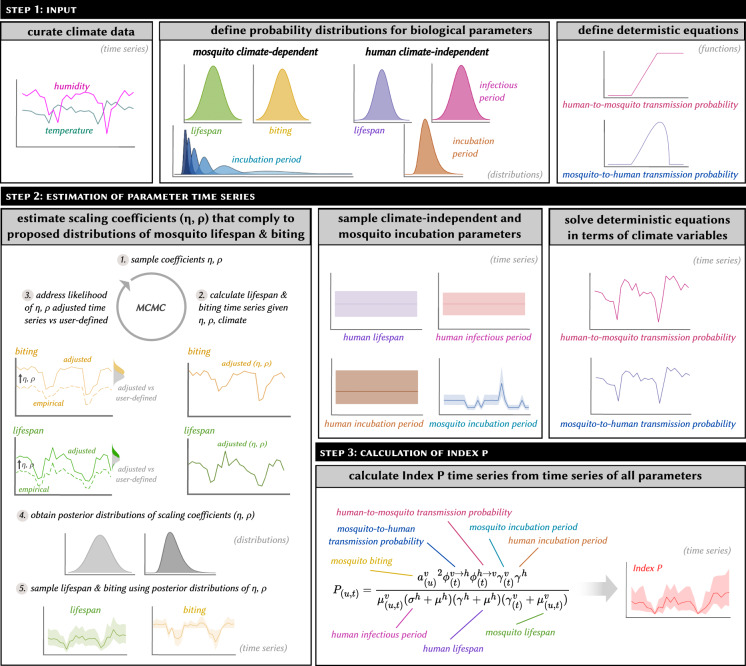
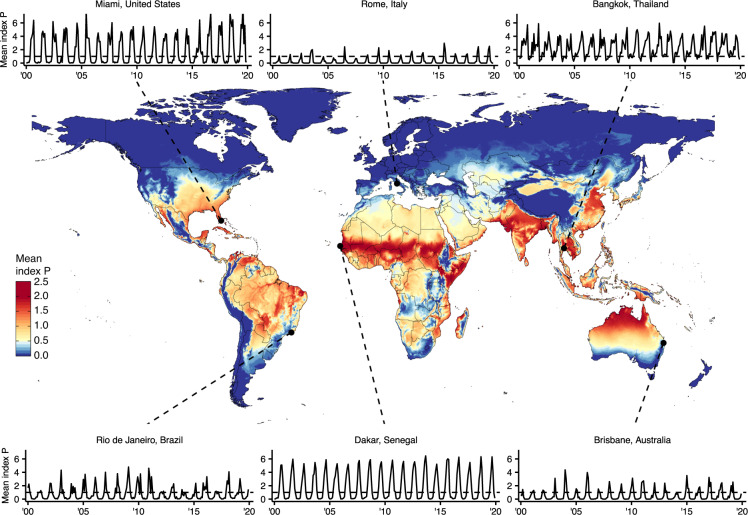
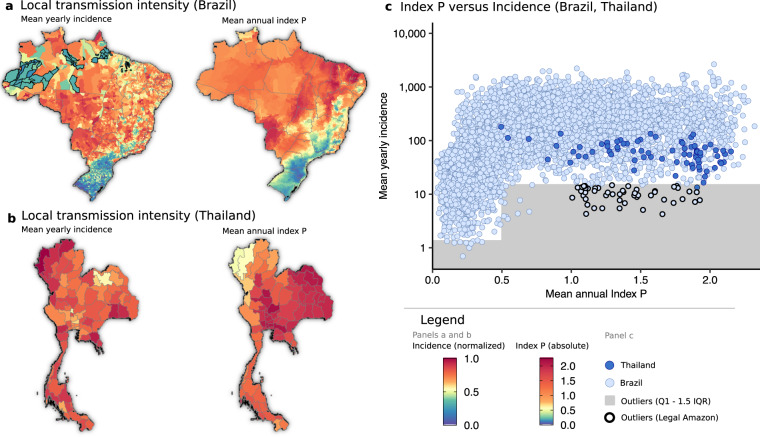
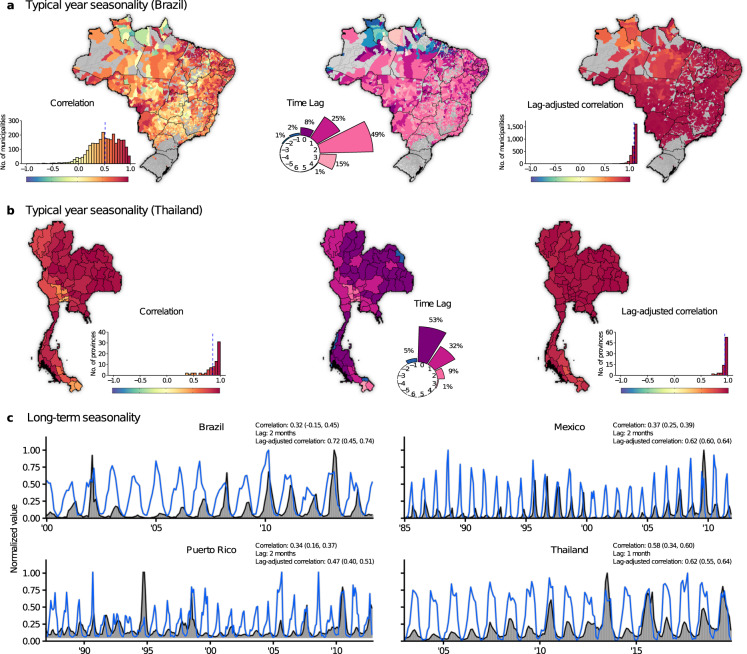
Mosquito-borne viruses increasingly threaten human populations due to accelerating changes in climate, human and mosquito migration, and land use practices. Over the last three decades, the global distribution of dengue has rapidly expanded, causing detrimental health and economic problems in many areas of the world. To develop effective disease control measures and plan for future epidemics, there is an urgent need to map the current and future transmission potential of dengue across both endemic and emerging areas. Expanding and applying Index P, a previously developed mosquito-borne viral suitability measure, we map the global climate-driven transmission potential of dengue virus transmitted by Aedes aegypti mosquitoes from 1981 to 2019. This database of dengue transmission suitability maps and an R package for Index P estimations are offered to the public health community as resources towards the identification of past, current and future transmission hotspots. These resources and the studies they facilitate can contribute to the planning of disease control and prevention strategies, especially in areas where surveillance is unreliable or non-existent.


Conflict of interest statement

The authors declare no competing interests.

Figures

Fig. 1
Fig. 1
Summary of the steps required to estimate Index P at a single spatial pixel.
Fig. 2
Fig. 2
Summary of global spatiotemporal maps of estimated Index P for DENV transmitted by Aedes aegypti mosquitoes. Global map of mean Index P during a typical year at a spatial resolution of 0.25° × 0.25° (~28 km2). Includes time series of average monthly Index P from 2000 to 2019 for six cities: Bangkok, Thailand; Brisbane, Australia; Dakar, Senegal; Miami, United States; Rio de Janeiro, Brazil; and Rome, Italy. Cities were selected to capture the diversity of Index P dynamics observed globally across regions where DENV is endemic, emerging or absent.
Fig. 3
Fig. 3
Comparison of reported DENV incidence and mean annual Index P for a typical year. (a,b) Mean yearly incidence in each municipality (left panel) and mean annual Index P for a typical year (right panel) across municipalities in Brazil and provinces in Thailand, respectively. Mean yearly incidence is normalized by the maximum value. (c) The relationship between mean annual Index P and mean yearly incidence (cases per 100,000 population). The area below the lower fence (Q1–1.5 × IQR for (0, 0.5) and (0.5, ∞)) which encompasses outliers is shaded grey with municipalities that form part of Brazil’s Legal Amazon highlighted black (these municipalities are also highlighted in panel a).
Fig. 4
Fig. 4
Correlation between the time series of Index P and incidence. (a,b) Left panel: Lag-unadjusted Spearman’s correlation coefficient between Index P and log-transformed incidence during a typical year for each municipality in Brazil and each province in Thailand. The histograms show the distribution of coefficients (mean represented by blue dashed line). Municipalities or provinces with fewer than 12 cases per year on average are excluded and coloured grey in the maps (N = 2725 for Brazil and N = 0 for Thailand) given that they have insufficient case data to have detectable seasonal signals. Middle panel: Map of the predicted lag of each municipality/province. The circular barplot shows the distribution of lags from −5 months to + 6 months. The proportion of municipalities/provinces observed for each lag is noted (proportions less than 1% are not shown). Right panel: Lag-adjusted Spearman’s correlation coefficient between Index P and log-transformed incidence during a typical year. (c) Monthly time series for Index P and log-transformed incidence (normalized by the maximum value) in Brazil (2000–2014), Mexico (1985–2011), Puerto Rico (1987–2012) and Thailand (2003–2019). Lag-unadjusted Spearman’s correlation (median, 95% CI), predicted lag and lag-adjusted Spearman’s correlation (median, 95% CI) are provided. CI = credible interval.

References

    1. Franklinos LHV, Jones KE, Redding DW, Abubakar I. The effect of global change on mosquito-borne disease. The Lancet infectious diseases. 2019;19:e302–e312. doi: 10.1016/S1473-3099(19)30161-6. - DOI - PubMed
    1. Faria NR, et al. Zika virus in the americas: Early epidemiological and genetic findings. Science. 2016;352:345–349. doi: 10.1126/science.aaf5036. - DOI - PMC - PubMed
    1. Cauchemez S, et al. Local and regional spread of chikungunya fever in the americas. Euro surveillance. 2014;19:1. - PMC - PubMed
    1. Yactayo S, Staples JE, Millot V, Cibrelus L, Ramon-Pardo P. Epidemiology of chikungunya in the americas. The Journal of infectious diseases. 2016;214:S441–S445. doi: 10.1093/infdis/jiw390. - DOI - PMC - PubMed
    1. Petrone ME, et al. Asynchronicity of endemic and emerging mosquito-borne disease outbreaks in the dominican republic. Nature communications. 2021;12:151–151. doi: 10.1038/s41467-020-20391-x. - DOI - PMC - PubMed