. 2023 May 12;14(1):2751.
doi: 10.1038/s41467-023-38345-4.

Evolution of antibody immunity following Omicron BA.1 breakthrough infection

Affiliations

Evolution of antibody immunity following Omicron BA.1 breakthrough infection

Chengzi I Kaku et al. Nat Commun. .

Abstract

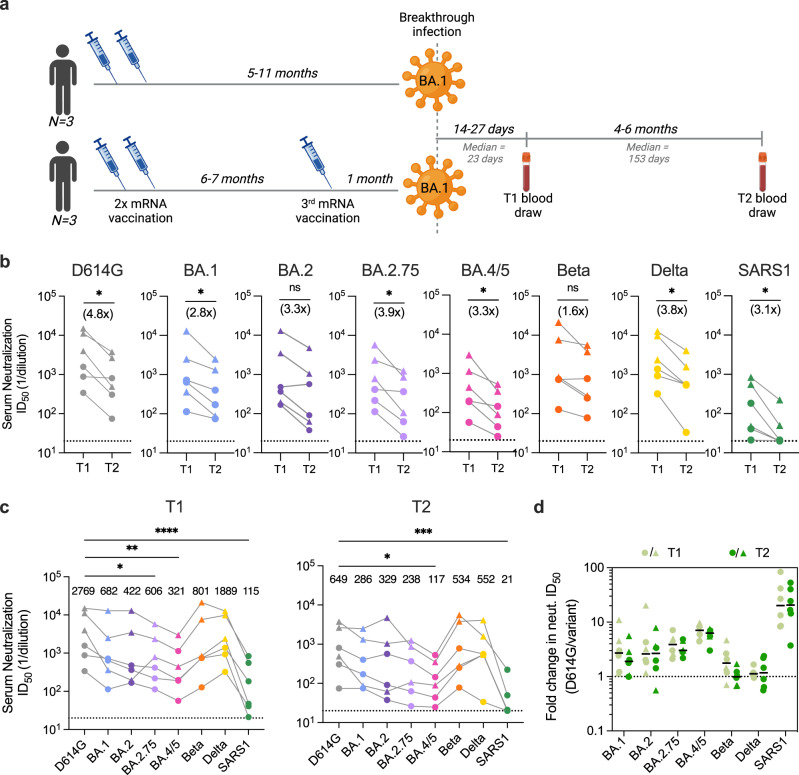
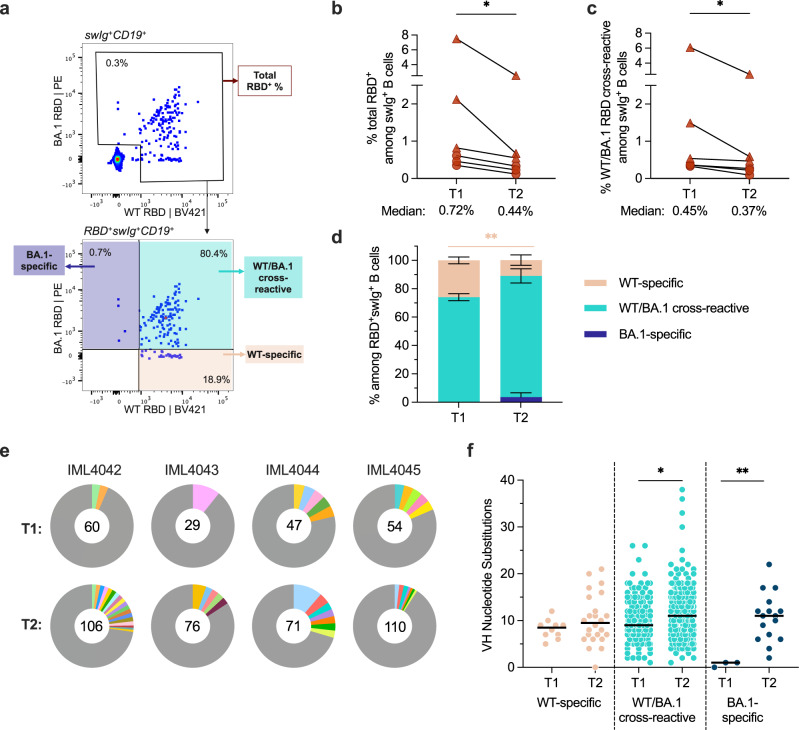
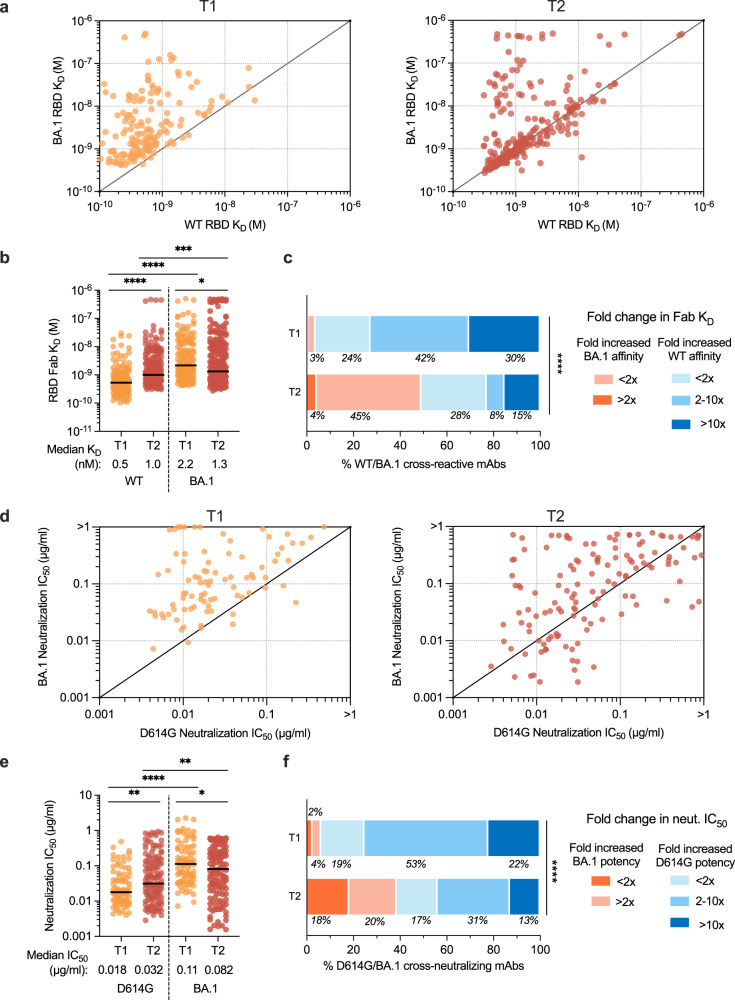
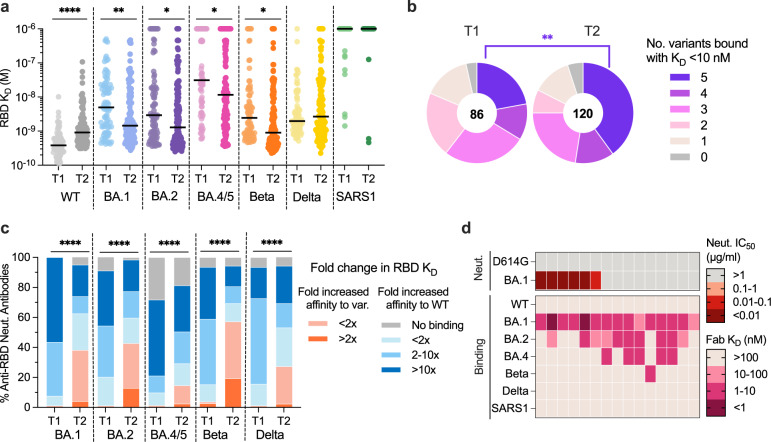
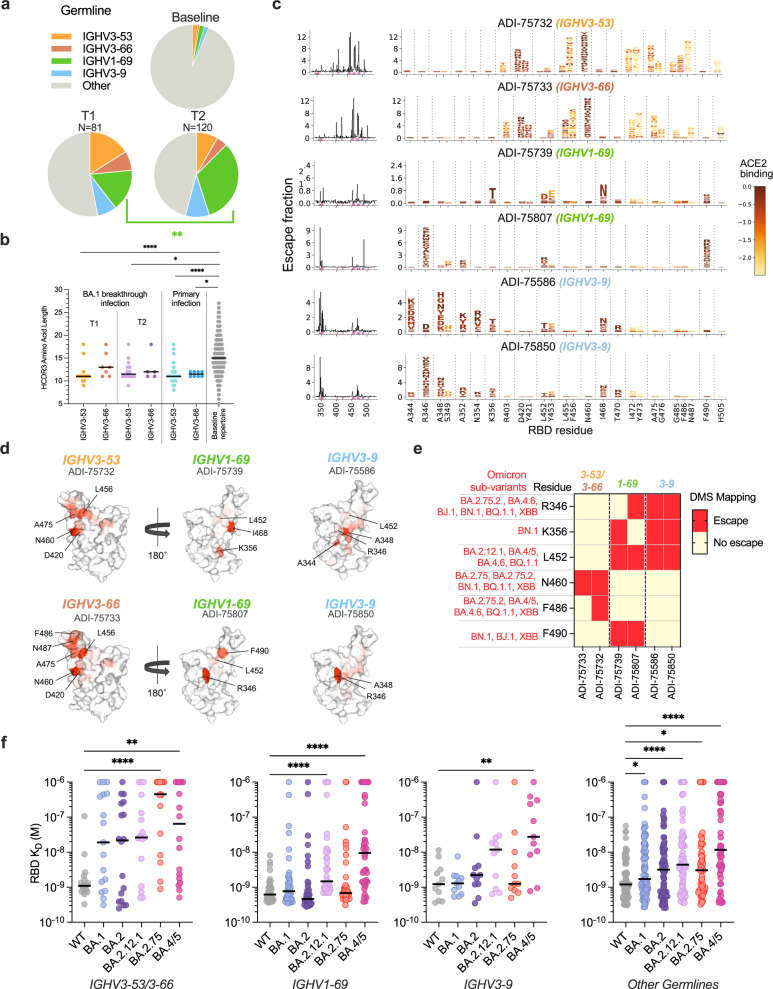
Understanding the longitudinal dynamics of antibody immunity following heterologous SAR-CoV-2 breakthrough infection will inform the development of next-generation vaccines. Here, we track SARS-CoV-2 receptor binding domain (RBD)-specific antibody responses up to six months following Omicron BA.1 breakthrough infection in six mRNA-vaccinated individuals. Cross-reactive serum neutralizing antibody and memory B cell (MBC) responses decline by two- to four-fold through the study period. Breakthrough infection elicits minimal de novo Omicron BA.1-specific B cell responses but drives affinity maturation of pre-existing cross-reactive MBCs toward BA.1, which translates into enhanced breadth of activity across other variants. Public clones dominate the neutralizing antibody response at both early and late time points following breakthough infection, and their escape mutation profiles predict newly emergent Omicron sublineages, suggesting that convergent antibody responses continue to shape SARS-CoV-2 evolution. While the study is limited by our relatively small cohort size, these results suggest that heterologous SARS-CoV-2 variant exposure drives the evolution of B cell memory, supporting the continued development of next-generation variant-based vaccines.


Conflict of interest statement

C.I.K. and L.M.W. are former employees and hold shares in Adimab. LLC. P.K., H.L.D., E.R.C., and J.C.G. are current employees and hold shares in Adimab LLC. L.M.W. is a former employee and holds shares in Invivyd Inc. T.N.S. and J.D.B. consult with Apriori Bio. J.D.B. has consulted for Moderna and Merck on viral evolution and epidemiology. D.R.B. is a consultant for IAVI, Invivyd, Adimab, Mabloc, VosBio, Nonigenex, and Radiant. C.I.K. and L.M.W. are inventors on a provisional patent application (No. 63/408,980) describing the SARS-CoV-2 antibodies reported in this work. T.N.S. and J.D.B. may receive a share of intellectual property revenue as inventors on Fred Hutchinson Cancer Center–optioned technology and patents related to deep mutational scanning of viral proteins. The remaining authors declare no competing interests.

Figures

Fig. 1
Fig. 1. Serum-neutralizing antibody responses at 1 month and 5–6 months following BA.1 breakthrough infection.
a Timeline of vaccination, BA.1 breakthrough infection, and sample collections. b Paired analysis of serum-neutralizing activity against SARS-CoV-2 D614G and BA.1, BA.2, BA.2.75, BA.4/5, Beta, and Delta variants, and SARS-CoV (SARS1) at 1-month (T1) and 5–6-month (T2) time points, as determined using an MLV-based pseudovirus neutralization assay. Connected data points represent paired samples for each donor (n = 6 individuals), and the median fold change in serum titer between the two time points is shown in parentheses. The dotted lines represent the lower limit of detection of the assay. c Serum neutralizing antibody titers against SARS-CoV-2 variants and SARS-CoV in samples collected at (left) 1-month and (right) 5–6-month post-breakthrough infection for each donor (n = 6 individuals). Median titers are shown above the data points. The dotted lines represent the lower limit of detection of the assay. d Fold change in serum-neutralizing titers for the indicated SARS-CoV-2 variants and SARS-CoV relative to SARS-CoV-2 D614G at early (T1) and late (T2) time points. Black bars represent median fold changes. The dotted line indicates no change in ID50. Breakthrough infection donors infected after two-dose mRNA vaccination (n = 3) are shown as circles and those infected after a third mRNA dose (n = 3) are shown as triangles. Results are representative of two independent experiments. Statistical comparisons were determined by b two-tailed Wilcoxon matched-pairs signed rank test, c Friedman’s one-way ANOVA with Dunn’s multiple comparisons, or d two-way mixed model ANOVA. ID50, 50% inhibitory dilution; *P < 0.05; **P < 0.01; ***P < 0.001; ****P < 0.0001; ns not significant. Source data and full statistical test results are provided as a Source Data file.
Fig. 2
Fig. 2. Breakthrough infection induces durable SARS-CoV-2 RBD-specific memory B cell responses up to 6 months post-infection.
a Representative fluorescence-activated cell sorting gating strategy used to enumerate frequencies of (top) total (WT + BA.1) RBD-reactive B cells among class-switched (IgG+ or IgA+) CD19+ B cells and (bottom) WT-specific, BA.1-specific, and WT/BA.1 cross-reactive B cells among total RBD-reactive, class-switched (IgG+ or IgA+) CD19+ B cells. b, c Frequencies of b total RBD-reactive (P = 0.031) or c WT/BA.1 RBD cross-reactive (P = 0.032) B cells among class-switched CD19+ B cells at 1-month (T1) and 5–6-month (T2) time points. Connected data points represent paired samples for each donor. Donors infected after two-dose mRNA vaccination (n = 3) are shown as circles and those infected after a third mRNA dose (n = 3) are shown as triangles. d Mean proportions of RBD-reactive, class-switched B cells that display WT-specific, BA.1-specific, or WT/BA.1 cross-reactive binding at each time point (n = 6 donors, P = 0.015). Proportions were derived from 36–417 RBD-specific B cells analyzed per donor. Error bars indicate the standard error of mean. Statistical significance is shown for WT-specific antibodies; differences in the proportions of cross-reactive and BA.1-specific antibodies were non-significant. e Clonal lineage analysis of RBD-directed antibodies isolated from four donors at the early (T1) and late (T2) time points. Clonally expanded lineages (defined as antibodies with the same heavy and light chain germlines, same CDR3 lengths, and ≥80% CDRH3 sequence identity) are represented as colored slices. Each colored slice represents a clonal lineage, with the size of the slice proportional to the lineage size. Unique clones are combined into a single gray segment. The number of antibodies is shown in the center of each pie. Three of the donors (IML4042, IML4043, and IML4044) experienced BA.1 breakthrough infection following two-dose mRNA vaccination and the remaining donor (IML4045) was infected after a booster immunization. f Levels of somatic hypermutation, as determined by the number of nucleotide substitutions in the variable heavy (VH) region, at the early (T1) and late (T2) time points among WT-specific (n = 146 and 283 at T1 and T2, respectively), WT/BA.1 cross-reactive (n = 10 and 24 at T1 and T2, respectively; P = 0.014), and BA.1-specific antibodies (n = 3 and 16 at T1 and T2, respectively; P = 0.002). Medians are shown by black bars. Statistical significance was determined by (b, c) two-tailed Wilcoxon matched-pairs signed rank test or (d, f) two-tailed Mann–Whitney U-test. swIg+, class-switched immunoglobulin. *P < 0.05; **P < 0.01. Source data and full statistical test results are provided as a Source Data file.
Fig. 3
Fig. 3. RBD-directed antibodies evolve toward enhanced binding and neutralizing activity.
a, b Fab binding affinities of WT/BA.1 cross-reactive antibodies for recombinant WT and BA.1 RBD antigens, as measured by BLI, are plotted as bivariates for antibodies derived from 1-month (left, n = 164) and 5–6-month (right, n = 280) time points in (a) and summarized as a column dot plot in (b). Median affinities are indicated by black bars and shown below data points. c Proportions of WT/BA.1 cross-reactive antibodies at each time point that show an increased affinity for the BA.1 RBD relative to WT (red shades) or increased affinity for WT RBD (blue shades). Values represent the percentage of antibodies belonging to each of the indicated categories. d, e Potency of antibodies with cross-neutralizing activity against SARS-CoV-2 D614G and BA.1 (neutralization threshold defined as IC50 < 2 µg/ml), as determined by an MLV-based pseudovirus neutralization assay. IC50 values are plotted in (d) as bivariates for antibodies isolated from 1-month (left, n = 86) and 5–6-month (right, n = 132) time points and summarized as column dot plots in (e). Median IC50 values are indicated by black bars and shown below data points. f Proportions of WT/BA.1 cross-neutralizing antibodies at each time point that show increased neutralizing potency against BA.1 (red shades) or D614G (blue shades). Values represent the percentage of antibodies belonging to each of the indicated categories. Statistical comparisons were determined by (b, e) multiple two-tailed Mann–Whitney U–tests without adjustment for multiplicity across time points and two-tailed Wilcoxon matched-pairs rank tests within each time point or (c, f) two-tailed Mann–Whitney U-test. IC50 50% inhibitory concentration, KD equilibrium dissociation constant; *P < 0.05; **P < 0.01; ***P < 0.001; ****P < 0.0001. Source data and full statistical test results are provided as a Source Data file.
Fig. 4
Fig. 4. Improved breadth of activity of D614G/BA.1 cross-neutralizing antibodies over time.
a Fab binding affinities of D614G/BA.1 cross-neutralizing antibodies isolated at 1-month (T1, n = 86) and 5–6-month (T2, n = 132) time points for recombinant SARS-CoV-2 variant RBDs and the SARS-CoV RBD, as determined by BLI. Black bars represent medians. b Pie charts showing the proportions of antibodies derived from (left) early and (right) late time points that bound the indicated number of SARS-CoV-2 variant RBDs with Fab KDs < 10 nM (statistical P = 0.026). The total number of antibodies is shown in the center of each pie. c Proportions of D614G/BA.1 cross-neutralizing antibodies from early (n = 86) and late (n = 132) time points with the indicated fold changes in Fab binding affinities for recombinant SARS-CoV-2 variant RBDs relative to the WT RBD. d Heatmap showing neutralization IC50s and SARS-CoV-2 variant RBD binding affinities of BA.1-specific antibodies. Statistical comparisons were determined by a, c Kruskal–Wallis test with Holms corrected multiple pairwise comparisons or b two-sided Fisher’s exact test. IC50 50% inhibitory concentration, KD equilibrium dissociation constant; *P < 0.05; **P < 0.01; ****P < 0.0001. Source data and full statistical test results are provided as a Source Data file.
Fig. 5
Fig. 5. BA.1 neutralizing antibodies display convergent sequence and binding properties.
a Pie charts showing frequencies of the indicated convergent germline genes among D614G/BA.1 cross-neutralizing antibodies isolated at early (T1) and late (T2) timelines (statistical P = 0.0021). Germline gene frequencies observed in baseline human antibody repertoires (upper right) are shown for comparison. b HCDR3 amino acid length distribution of IGHV3–53 and IGHV3–66 cross-neutralizing antibodies isolated 1-month (T1, n = 28) and 5–6 months (T2, n = 19) following BA.1 breakthrough infection. HCDR3 lengths of IGHV3–53/3–66-utilizing antibodies isolated following primary D614G infection (n = 51) and the baseline human antibody repertoire (n = 30,546) were included for comparison,. c Line plots at left show the total site-wise escape at each RBD site, as determined using deep mutational scanning analysis of yeast-displayed SARS-CoV-2 BA.1 RBD mutant libraries. Sites of strong escape indicated by pink bars are shown at the mutation level in logo plots. Mutations are colored by their effects on ACE2 binding (scale bar at right). d Structural projections of binding escape mutations determined for the indicated convergent antibodies. The RBD surface is colored by a gradient ranging from no escape (white) to strong escape (red) at each site. See Supplementary Fig. 8 for additional details. e Heatmap summarizing convergent antibody-escape mutations present in the indicated SARS-CoV-2 Omicron sublineages. f Fab binding affinities of convergent antibodies utilizing the indicated germline genes (n = 18 for IGHV3–53/66, n = 40 for IGHV1–69, n = 11 for IGHV3–9, and n = 58 for other germlines) for SARS-CoV-2 WT and Omicron sub-variant RBD antigens, as measured by BLI. Black bars indicate median affinities. Statistical comparisons were determined by a two-sided Fisher’s exact test or b, f Kruskal–Wallis test with subsequent Dunn’s multiple comparisons with WT. HCDR3 heavy chain complementarity-determining region 3, KD equilibrium dissociation constant; *P < 0.05; **P < 0.01; ****P < 0.0001. Source data and full statistical test results are provided as a Source Data file.

Update of

References

    1. WHO. WHO Coronavirus (COVID-19) dashboard with vaccination data. https://covid19.who.int/ (2023).
    1. Tseng HF, et al. Effectiveness of mRNA-1273 against SARS-CoV-2 Omicron and Delta variants. Nat. Med. 2022;28:1063–1071. doi: 10.1038/s41591-022-01753-y. - DOI - PMC - PubMed
    1. Tartof SY, et al. Durability of BNT162b2 vaccine against hospital and emergency department admissions due to the omicron and delta variants in a large health system in the USA: a test-negative case-control study. Lancet Respir. Med. 2022;10:689–699. doi: 10.1016/S2213-2600(22)00101-1. - DOI - PMC - PubMed
    1. Wang Q, et al. Antibody evasion by SARS-CoV-2 Omicron subvariants BA.2.12.1, BA.4 and BA.5. Nature. 2022;608:603–608. doi: 10.1038/s41586-022-05053-w. - DOI - PMC - PubMed
    1. Tuekprakhon A, et al. Antibody escape of SARS-CoV-2 Omicron BA.4 and BA.5 from vaccine and BA.1 serum. Cell. 2022;185:2422–2433.e13. doi: 10.1016/j.cell.2022.06.005. - DOI - PMC - PubMed

Publication types

Substances

Supplementary concepts