. 2023 May 12;13(1):7759.
doi: 10.1038/s41598-023-33954-x.

Consensus clustering methodology to improve molecular stratification of non-small cell lung cancer

Affiliations

Consensus clustering methodology to improve molecular stratification of non-small cell lung cancer

L Manganaro et al. Sci Rep. .

Abstract

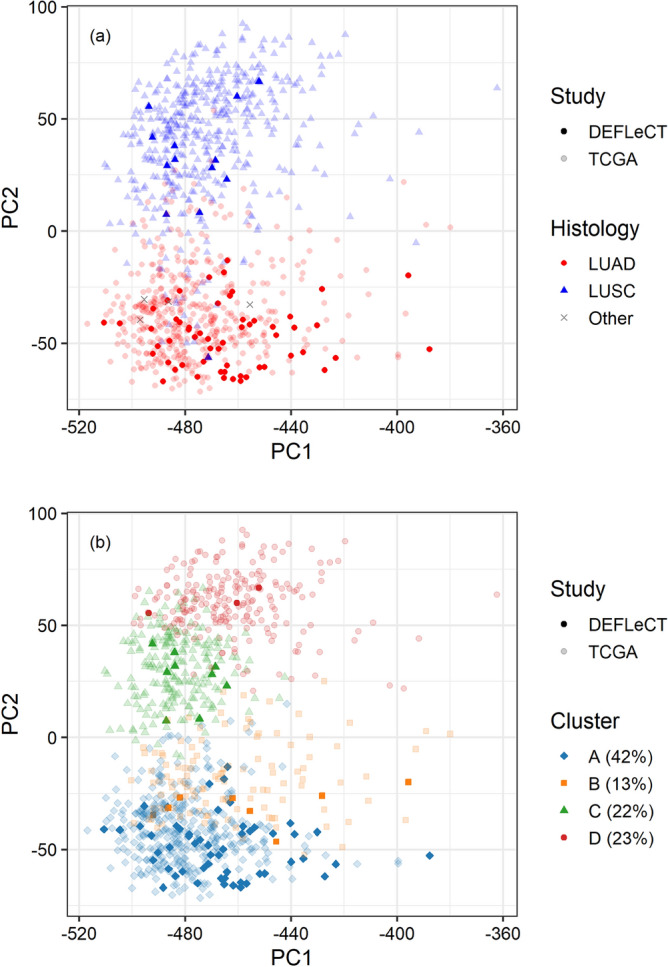
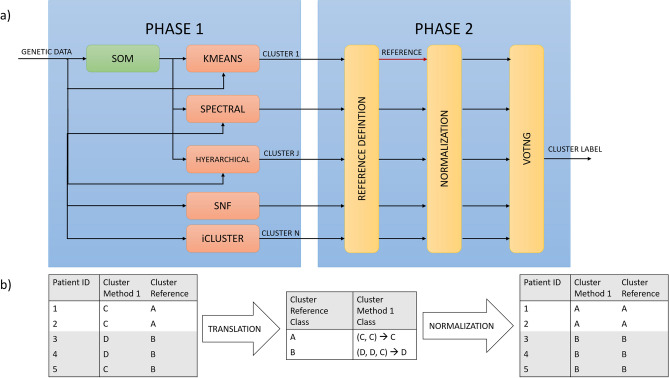
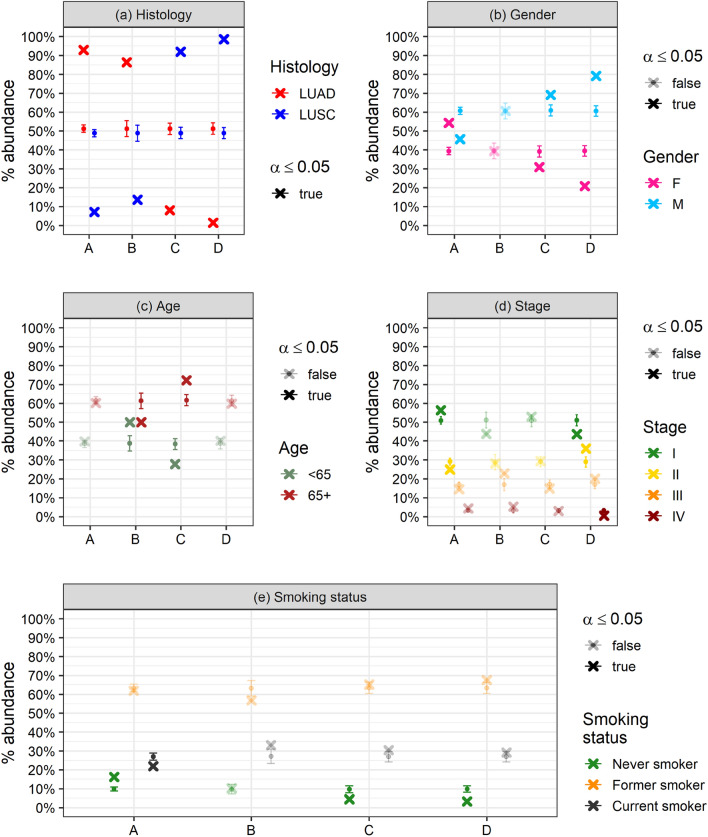
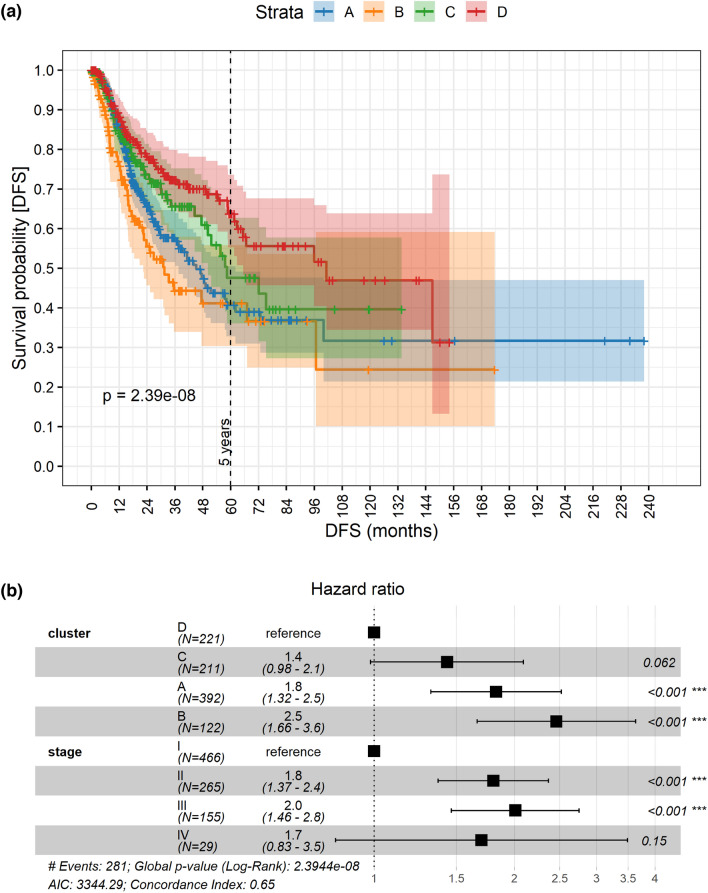
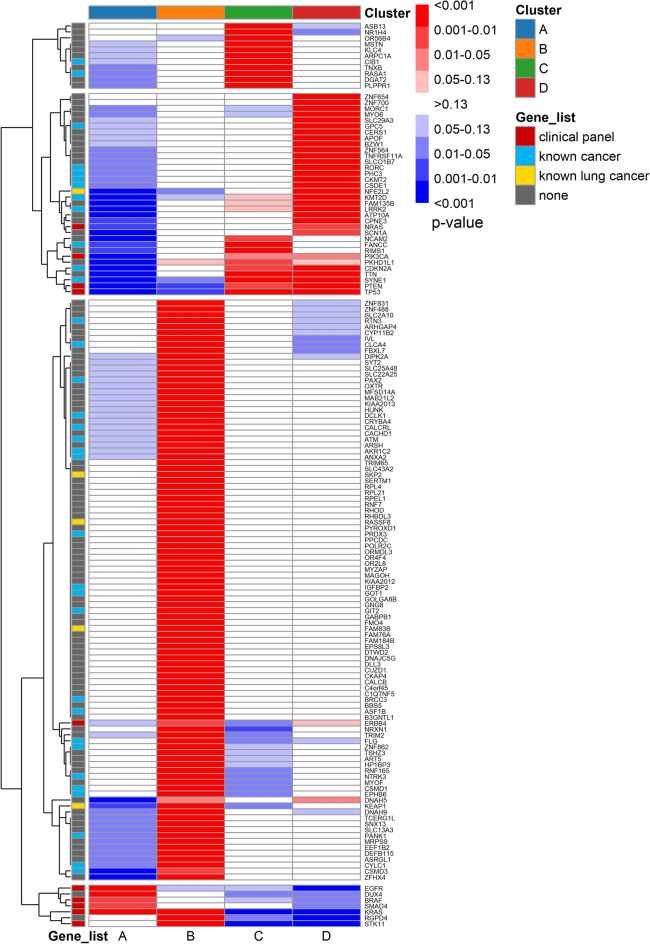
Recent advances in machine learning research, combined with the reduced sequencing costs enabled by modern next-generation sequencing, paved the way to the implementation of precision medicine through routine multi-omics molecular profiling of tumours. Thus, there is an emerging need of reliable models exploiting such data to retrieve clinically useful information. Here, we introduce an original consensus clustering approach, overcoming the intrinsic instability of common clustering methods based on molecular data. This approach is applied to the case of non-small cell lung cancer (NSCLC), integrating data of an ongoing clinical study (PROMOLE) with those made available by The Cancer Genome Atlas, to define a molecular-based stratification of the patients beyond, but still preserving, histological subtyping. The resulting subgroups are biologically characterized by well-defined mutational and gene-expression profiles and are significantly related to disease-free survival (DFS). Interestingly, it was observed that (1) cluster B, characterized by a short DFS, is enriched in KEAP1 and SKP2 mutations, that makes it an ideal candidate for further studies with inhibitors, and (2) over- and under-representation of inflammation and immune systems pathways in squamous-cell carcinomas subgroups could be potentially exploited to stratify patients treated with immunotherapy.


Conflict of interest statement

The authors declare no competing interests.

Figures

Figure 1
Figure 1
First two principal components of the gene expression profiles of TCGA (transparent) and DEFLeCT (alias PROMOLE) (opaque) samples obtained via PCA of the log2-scaled TPM. (a) Colours and shape distinguish LUAD (red dots) and LUSC (blue triangles), not jet available histology of DEFLeCT samples are marked with a grey cross (x). (b) Colours and shape indicate the 4 molecular subgroups identified via consensus clustering; relative abundance of each subgroup is reported in the legend.
Figure 2
Figure 2
(a) Workflow of consensus clustering algorithm. In phase 1, many independent clustering algorithms (learners) are trained separately. In phase2, a reference for labels is chosen, clustering labels are aligned to the reference nomenclature, final labels are derived via majority voting. (b) Detail of the consensus clustering phase 2 normalization procedure. Each clustering method association is firstly translated with respect to the reference clustering method (employing the most common labels among the clusters defined by the reference), and then reported in the normalized reference nomenclature.
Figure 3
Figure 3
Comparison between observed (cross) and expected (dots and error bar) relative abundances of the main histological subtypes and clinical variables in the 4 molecular subgroups. Transparency refers to significance according to normal Z-test (transparent: not significative, opaque: significative p < 0.05). (a) Histological subtypes; (b) gender; (c) age grouped as under-/over- 65; (d) clinical staging (grouped in 4 levels); (e) smoking status.
Figure 4
Figure 4
(a) Kaplan–Meier survival curves and confidence intervals representing the DFS of the 4 molecular subgroups with the associated log-rank p-value. (b) Forest plot representing the hazard ratios and significance of the subgroups and clinical stage (the only significant clinical confounder) computed via Cox regression model.
Figure 5
Figure 5
Dot plot of the most representative functional categories (rows) that are significantly enriched in at least one of the 4 molecular subgroups (columns) with respect to the others according to GSEA analysis. Colour scale indicates the value of the FDR value for positive and negative NES, dot size is proportional to the number of genes associated to each macro-category.
Figure 6
Figure 6
Heatmap of the 150 most representative genes (rows) quantifying over- and under-represented mutations of 4 molecular subgroups (columns). Colour scale indicates normal Z-scores grouped by p-value classes. Genes are rearranged by hierarchical clustering to facilitate pattern recognition. Genes are flagged via colour annotations if belonging to meaningful selected lists, prioritised as follows: clinical panel (red), lung-cancer related genes (yellow), cancer-related genes (cyan), other (grey).

References

    1. Ferlay, J. et al. Global cancer observatory: cancer today. Available at: https://gco.iarc.fr/today [Accessed 29/04/21].
    1. American Cancer Society. Cancer facts and figures. 2022:28.
    1. Zheng M. Classification and pathology of lung cancer. Surg. Oncol. Clin. N. Am. 2016;25(3):447–468. doi: 10.1016/j.soc.2016.02.003. - DOI - PubMed
    1. Carbone DP, et al. First-line nivolumab in stage IV or recurrent non-small-cell lung cancer. N. Engl. J. Med. 2017;376(25):2415–2426. doi: 10.1056/NEJMoa1613493. - DOI - PMC - PubMed
    1. Hanahan D, Weinberg RA. Hallmarks of cancer: The next generation. Cell. 2011;144(5):646–674. doi: 10.1016/j.cell.2011.02.013. - DOI - PubMed

Publication types

Substances