. 2023 May 13;14(5):324.
doi: 10.1038/s41419-023-05810-3.

Obesity impairs cardiolipin-dependent mitophagy and therapeutic intercellular mitochondrial transfer ability of mesenchymal stem cells

Affiliations

Obesity impairs cardiolipin-dependent mitophagy and therapeutic intercellular mitochondrial transfer ability of mesenchymal stem cells

Shakti Sagar et al. Cell Death Dis. .

Abstract

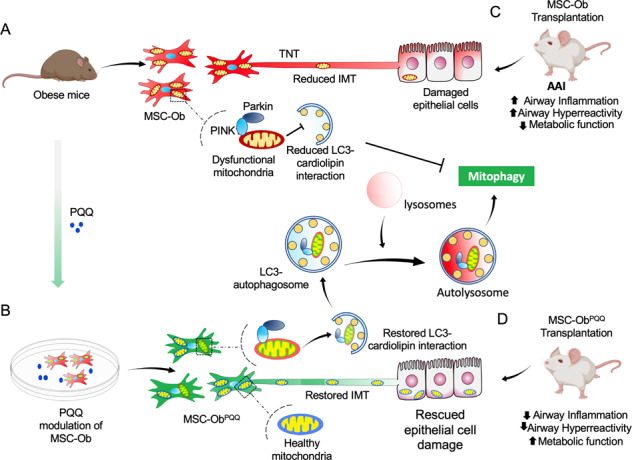
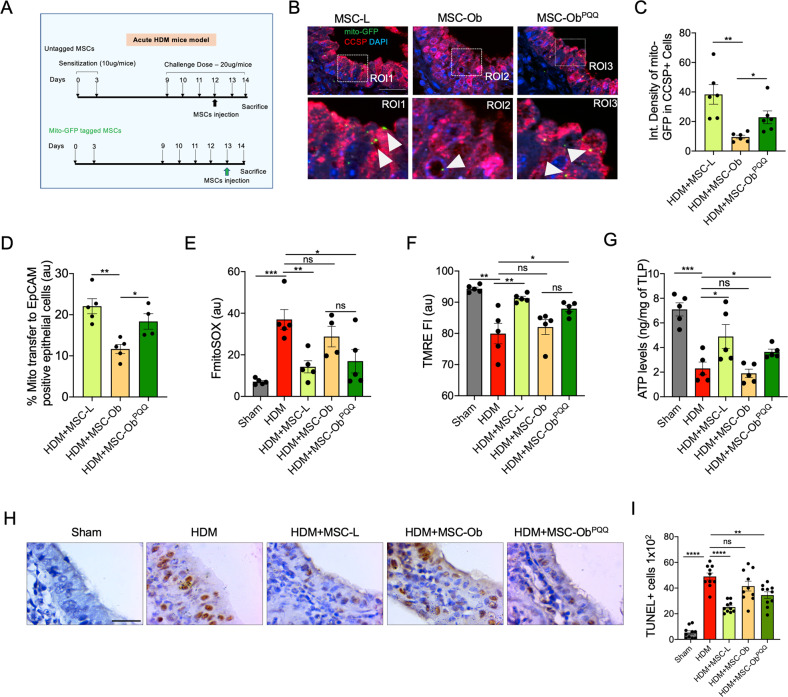
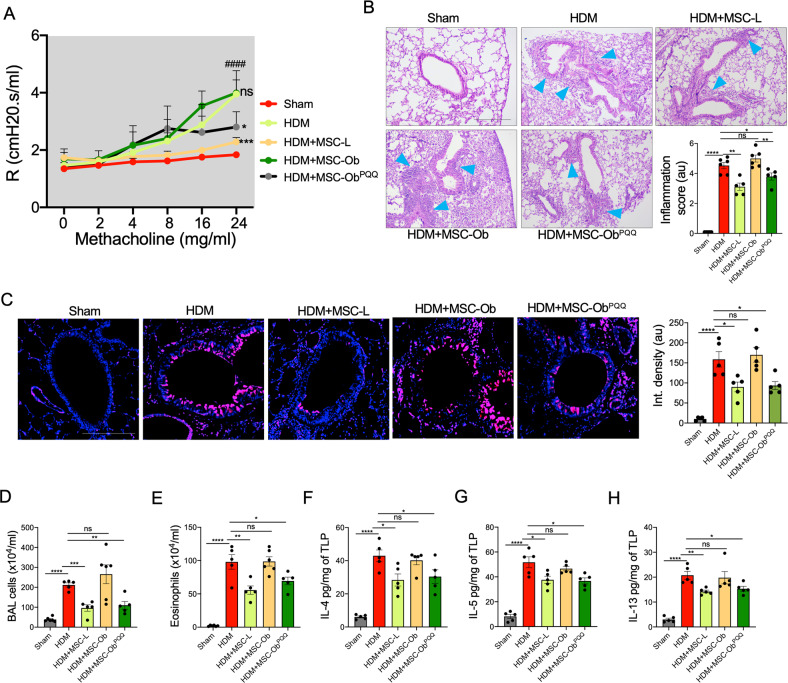
Mesenchymal stem cell (MSC) transplantation alleviates metabolic defects in diseased recipient cells by intercellular mitochondrial transport (IMT). However, the effect of host metabolic conditions on IMT and thereby on the therapeutic efficacy of MSCs has largely remained unexplored. Here we found impaired mitophagy, and reduced IMT in MSCs derived from high-fat diet (HFD)-induced obese mouse (MSC-Ob). MSC-Ob failed to sequester their damaged mitochondria into LC3-dependent autophagosomes due to decrease in mitochondrial cardiolipin content, which we propose as a putative mitophagy receptor for LC3 in MSCs. Functionally, MSC-Ob exhibited diminished potential to rescue mitochondrial dysfunction and cell death in stress-induced airway epithelial cells. Pharmacological modulation of MSCs enhanced cardiolipin-dependent mitophagy and restored their IMT ability to airway epithelial cells. Therapeutically, these modulated MSCs attenuated features of allergic airway inflammation (AAI) in two independent mouse models by restoring healthy IMT. However, unmodulated MSC-Ob failed to do so. Notably, in human (h)MSCs, induced metabolic stress associated impaired cardiolipin-dependent mitophagy was restored upon pharmacological modulation. In summary, we have provided the first comprehensive molecular understanding of impaired mitophagy in obese-derived MSCs and highlight the importance of pharmacological modulation of these cells for therapeutic intervention. A MSCs obtained from (HFD)-induced obese mice (MSC-Ob) show underlying mitochondrial dysfunction with a concomitant decrease in cardiolipin content. These changes prevent LC3-cardiolipin interaction, thereby reducing dysfunctional mitochondria sequestration into LC3-autophagosomes and thus impaired mitophagy. The impaired mitophagy is associated with reduced intercellular mitochondrial transport (IMT) via tunneling nanotubes (TNTs) between MSC-Ob and epithelial cells in co-culture or in vivo. B Pyrroloquinoline quinone (PQQ) modulation in MSC-Ob restores mitochondrial health, cardiolipin content, and thereby sequestration of depolarized mitochondria into the autophagosomes to alleviate impaired mitophagy. Concomitantly, MSC-Ob shows restoration of mitochondrial health upon PQQ treatment (MSC-ObPQQ). During co-culture with epithelial cells or transplantation in vivo into the mice lungs, MSC-ObPQQ restores IMT and prevents epithelial cell death. C Upon transplantation in two independent allergic airway inflammatory mouse models, MSC-Ob failed to rescue the airway inflammation, hyperactivity, metabolic changes in epithelial cells. D PQQ modulated MSCs restored these metabolic defects and restored lung physiology and airway remodeling parameters.


Conflict of interest statement

The authors declare no competing interests.

Figures

None
A MSCs obtained from (HFD)-induced obese mice (MSC-Ob) show underlying mitochondrial dysfunction with a concomitant decrease in cardiolipin content. These changes prevent LC3-cardiolipin interaction, thereby reducing dysfunctional mitochondria sequestration into LC3-autophagosomes and thus impaired mitophagy. The impaired mitophagy is associated with reduced intercellular mitochondrial transport (IMT) via tunneling nanotubes (TNTs) between MSC-Ob and epithelial cells in co-culture or in vivo. B Pyrroloquinoline quinone (PQQ) modulation in MSC-Ob restores mitochondrial health, cardiolipin content, and thereby sequestration of depolarized mitochondria into the autophagosomes to alleviate impaired mitophagy. Concomitantly, MSC-Ob shows restoration of mitochondrial health upon PQQ treatment (MSC-ObPQQ). During co-culture with epithelial cells or transplantation in vivo into the mice lungs, MSC-ObPQQ restores IMT and prevents epithelial cell death. C Upon transplantation in two independent allergic airway inflammatory mouse models, MSC-Ob failed to rescue the airway inflammation, hyperactivity, metabolic changes in epithelial cells. D PQQ modulated MSCs restored these metabolic defects and restored lung physiology and airway remodeling parameters.
Fig. 1
Fig. 1. Obese-derived MSCs exhibit reduced intercellular mitochondrial transport due to mitochondrial dysfunction.
A Schema of the development of diet-induced obesity model. The MSCs were harvested from mice fed a high-fat diet for 18 weeks (MSC-Ob) and control mice, which received a regular diet (MSC-L). The mice were subjected to measurements of body weight (b.w.), fasting glucose (FG), triglycerides (TG), and total cholesterol (TC) before sacrifice at week 24. B Flow cytometry analysis showing mitochondrial donation by GFP transduced MSCs (mito-GFP) to the vehicle (Veh), or rotenone (Rot) treated MLE-12 cells after 24 h of co-culture. C Representative images of mito-GFP-transduced MSC-L show mitochondria donation to Rot treated MLE12, which were stained with cell-tracker deep red (CTDR). Yellow arrowheads show the mito-GFP signal in MLE12 cells, and TNTs (white arrowhead) between the two cells visualized after fixing the cells and staining with phalloidin 594 (P594; blue). D The integrated density of mito-GFP signal quantified in CTDR positive MLE12 treated with Veh or Rot. E Representation of flow cytometry histograms showing mtROS levels in cell tracker green (CTG) stained MLE12 cells after co-culture with unstained MSCs (left panel). Histogram of the flow cytometry data with n = 5-6 from three independent experiments (right panel). F Immunoblot of Miro1 expression in total cell lysate and the corresponding densitometric analysis (below panel). G The mitochondrial mass measured by flow cytometry in MSC-L and MSC-Ob after staining with mitotracker green (MTG) (left panel). Histogram of the flow cytometry data with n = 4 from three independent experiments (right panel). H Representative images of MSC-L and MSC-Ob after staining with mitotracker red (MTR) and Hoechst (blue). I Mitochondrial cell number was calculated by staining the cells with MTR and imaging analysis and presented as number of mitochondria per cell. J RT-qPCR analysis showing mtDNA content in MSC-L and MSC-Ob. K Immunoblot of PGC-1α and β-actin in cell lysate from MSC-L and MSC-Ob along with densitometric analysis (below panel). L Mitochondria size was calculated in images obtained after staining the cells with MTR. M, N Electron Microscopy images show imperfect cristae, more pronounced in MSC-Ob (blue arrowheads) and quantitative analysis per 100 cells. O Immunoblot and densitometric analysis of Drp1, mfn1 and β-actin. P, Q graphical representation of flow cytometry data showing mtROS in cells stained with mitoSOX and percentage depolarized mitochondria in cells stained with tetramethyl rhodamine ethyl ester (TMRE). Corresponding graphs of mitoSOX and TMRE represented as fluorescent values and percentage depolarization respectively. R Measurement of oxygen consumption rate (OCR) in MSC-L and MSC-Ob under basal and various mitochondrial complex inhibitor treatments. Data is shown as Mean±SEM with n ≥ 3. ****P < 0.001; ***P < 0.005; **P < 0.01; *P < 0.05; ns (non-significant). Scale bars: C: 20 µm; H: 10 µm; M: 0.1 µm.
Fig. 2
Fig. 2. MSC-Ob exhibits impaired mitophagy and reduced activation of LC3-dependent autophagosomes.
A Immunoblot of PINK1 in the mitochondrial extracts prepared under DMSO (0) and FCCP (5 µM and 10 µM) treatment for 1 hr with densitometric analysis (right panel). B Similarly, immunoblot showing the expression of Parkin. C Representative images of cells stained for endogenous PINK1 (red) and Tom20 (green) treated with Veh or FCCP. Line scans show colocalization (below panel) between PINK1 and Tom20. Images from C were analyzed to determine Mander’s coefficient (right panel), which indicates the extent of colocalization between mitochondria (green) and PINK1 (red). D Similarly, images of Parkin’s immunofluorescence and line scan analysis (below panel) and Mander’s coefficient. E Immunoblot of LC3 in MSCs treated with DMSO (0) or FCCP (5 µM and 10 µM) for 1 hr. The lower panel shows the densitometry analysis. F Representative images of LC3 (red) and Tom20 (green) treated with DMSO (Veh) or 10 µM antimycin (AMA) for 1 hr. G Mander’s coefficient representing the colocalization between LC3 and Tom20. H Quantitation of LC3 puncta per cell, which represents the autophagosome formation in images from G. ****P < 0.001; ***P < 0.005; **P < 0.01; *P < 0.05; ns (non-significant). Scale bars: C: 10 µm; D, F: 20 µm.
Fig. 3
Fig. 3. Mitochondrial sequestration into autophagosomes is inhibited by reduced cardiolipin content rather changes in lysosomal function.
A LAMP1 expression in MSCs treated with DMSO or FCCP for 2 h before the total protein lysates were prepared for immunoblotting. The right panel shows the densitometry analysis of the blots. B Representative images of LAMP1 in MSCs stained with anti-LAMP1 antibody (red) and DAPI (blue). The right panel shows the image analysis data plotted as integrated density. C MSCs were live stained with lysotracker deep-red (LTDR) and imaged in the presence of Hoechst stain (blue). The images (C) were quantified and represented as integrated density. D Representative images of MSC-L (D1) and MSC-Ob (D2) transduced with mitochondrial-targeted GFP (mito-GFP) and treated with DMSO or FCCP for 2 h. After fixation, the cells were stained with LAMP1 (red) and DAPI. Right panels show the line scans of the images indicating the extent of colocalization. E Mander’s coefficient showing the degree of colocalisation between LAMP1 and mitochondria. F Similarly, the images of MSC-L (F1) and MSC-Ob (F2) along with the line scans. G Image analysis (D) to determine the Mander’s coefficient between lysosomes and mitochondria. MSCs after transduction with mito-GFP (green) were treated with DMSO or FCCP and further stained with LTDR (red). Line scans indicate the extent of overlap between LAMP1 and mitochondria in the region selected (F). H, I Expression of FUNDC1, VDAC, p62 and β-actin as revealed by immunoblotting of MSCs treated with DMSO (0) or FCCP (5 µM and 10 µM). J The corresponding densitometry analysis. K LC-MS data showing the histograms of cardiolipin species detected in MSC-L and MSC-Ob cells. The cardiolipin species (with n = 3 different samples) which were significantly different are shown here while all the species detected are shown in Fig. S8. Mean ± SEM. ****P < 0.001; ***P < 0.005; **P < 0.01; *P < 0.05; ns (non-significant). Scale bars: B: 50 µm; C: 100 µm; D, F: 10 µm.
Fig. 4
Fig. 4. MSC-Ob cultured in PQQ restores structure and function of mitochondria and their sequestration to autophagosomes.
A MSCs were treated with DMSO (Veh), Mito-TEMPO (Mito-T), Resveratrol (RESV), N-acetyl cysteine (NAC), 3-methyladenine (3MA), Urolithin A (UA), nicotinamide mononucleotide (NMN), and Pyrroloquinoline quinone (PQQ) for 48 h before fixing the cells. The cells were stained for endogenous LC3 (red) and Tom20 (green) and analyzed to determine the Mander’s coefficient represented as heat-map. B Bar graph representation of flow cytometry analysis of mtROS in MSCs treated with PQQ (chronic 30 μM treatment of 6 doses for 10 days). The cells were stained with mitoSOX red. C Similarly, cells were stained with TMRE to determine the degree of mitochondrial depolarization. D, E OCR reflects ATP production and basal respiration. F Representative images of MSCs stained with mitotracker red (MTR) showing mitochondrial morphology. G Image quantitation (F) showing changes in mitochondrial size between different groups. H Representative flow cytometry histograms of mitotracker green (MTG) stained MSCs. I MSCs were treated with AMA (10 µM) for 1 hr and then stained for endogenous LC3 (red) and Tom20 (green). J Mander’s coefficient was calculated in images from J to find the colocalization between Tom20 and LC3. K LC-MS data showing bar graphs of selected cardiolipin species which are significantly different between MSC-L, MSC-Ob and MSC-ObPQQ groups. L Representative images of cells stained with lysotracker deep red (LTDR) and Tom20. M Mander’s coefficient indicating the extent of co-localisation between mitochondria and lysosomes. N MSCs were treated with AMA (10 µM) for 2 hr and stained with mitotracker green to find the mitochondrial turn-over, represented as integrated density. Mean ± SEM. ****P < 0.001; ***P < 0.005; **P < 0.01; *P < 0.05; ns (non-significant). Scale bars: 10 µm.
Fig. 5
Fig. 5. Intercellular mitochondrial transport and therapeutic potential of MSC-Ob are restored upon culturing in PQQ.
A MSCs were transduced with mito-GFP and co-cultured with MLE12 which were treated with Veh or Rot and stained with CTDR. The % GFP signal was counted in by gating MLE12 cells after 24 h. B, C Similarly, mitoSOX and TMRE staining was done in MLE12 cells after co-culture with MSCs and represented as TMRE fluorescent intensity (FI). D CTDR stained MLE12 cells were co-cultured with mito-GFP transduced MSCs and further stained with MTR. The MTR images were taken from MLE12 cells to determine mitochondrial size distribution after 48 h of co-culture. E Similar to D, with integrated density representing the mitochondrial mass in MLE12 cells by specifically counting the MTR signal in these cells. F MLE-12 cells were stained with CTDR and co-cultured with untagged MSCs for 24 h. The cells were stained with propidium iodide (PI), and flow cytometry analysis was done. MLE12 cells were gated using CTDR, and the PI signal was calculated, which is represented as % MLE12 cell death. G Immunoblots and densitometry analysis (lower panel) of Miro1 and β-actin in cell lysates prepared from various groups of MSCs. H TNT formation between co-cultured MSCs and MLE12 cells was determined by counting the number of physically attached TNTs. The data is represented as no. of TNTs per 102 cells. Mean ± SEM. ****P < 0.001; ***P < 0.005; **P < 0.01; *P < 0.05; ns (non-significant).
Fig. 6
Fig. 6. PQQ treatment restores intercellular mitochondrial transport by MSC-Ob to airway epithelial cells and enhances their therapeutic potential.
A Schema showing the development of HDM-induced airway allergic inflammation model. B Representative images show Mito-GFP (green) donation by MSCs to bronchial epithelial cells stained for CCSP (RED). Mito-GFP tagged MSCs were transplanted into the mice lungs via intra-tracheal infusion, and tissue sections were prepared after 24 h of infusion. C Images from B were subjected to image analysis to determine the signal of mito-GFP in CCSP positive epithelial cells and represented as integrated density. D Similarly, mitochondrial donation by MSCs was calculated using flow cytometry analysis. Single cells were prepared from lung tissue and stained for EpCAM to mark epithelial cells, which were gated to calculate the GFP signal. E, F Similarly, cells were stained with mitoSOX red and TMRE, respectively, to determine the mtROS and mitochondrial membrane potential in EpCAM stained epithelial cells. G Lung tissue was obtained from different groups of mice to prepare total lung protein (TLP). The ATP levels were measured in the TLP immediately after preparation. H Representative TUNEL images from lung tissue sections prepared from animals after 48 h of MSC transplantation. I No. of TUNEL positive cells were calculated by counting 100 bronchial epithelial cell nuclei per section, representing cell death. Mean ± SEM. ****P < 0.001; ***P < 0.005; **P < 0.01; *P < 0.05; ns (non-significant). Scale bars: 50 µm.
Fig. 7
Fig. 7. PQQ treated MSC-Ob restore airway mechanics and physiology in HDM-induced allergic asthma model.
A AHR measured under various concentrations of methacholine in mouse transplanted with untagged MSCs for 48 h before the measurements were taken. B Representative H&E images of HDM-induced AAI in mice transplanted with MSCs for 48 h. Blue arrowheads show the inflammatory cells around bronchi and blood vessels. The lower right panel shows inflammatory scoring representing the extent of inflammatory cell infiltration. C Representative images of tissue sections stained with PAS and pseudocolored. Pink color shows the mucus secretion, and blue shows the nuclei stained with hematoxylin. The images were subjected to image analysis to measure the PAS mucus secretion and represented as integrated density (right panel). D Total cell count was done in the Bronchoalveolar lavage (BAL) fluid. Similarly, eosinophil cell count was done in the BAL fluid. EH Th2 cytokine (IL-4, IL-5, and IL-13) levels were measured in the total lung protein prepared from the lung tissue. The data is represented as a picogram of cytokines per milligram of the TLP. Mean ± SEM. ****P < 0.001; ***P < 0.005; **P < 0.01; *P < 0.05; ns (non-significant). Scale bars: B: 200 µm; C: 100 µm.

References

    1. Levy O, Kuai R, Siren EMJ, Bhere D, Milton Y, Nissar N, et al. Shattering barriers toward clinically meaningful MSC therapies. Sci Adv. 2020;6:eaba6884. - PMC - PubMed
    1. Lau AN, Goodwin M, Kim CF, Weiss DJ. Stem cells and regenerative medicine in lung biology and diseases. Mol Ther. 2012;20:1116–30. - PMC - PubMed
    1. Shetty AK, Shetty PA, Zanirati G, Jin K. Further validation of the efficacy of mesenchymal stem cell infusions for reducing mortality in COVID-19 patients with ARDS. NPJ Regen Med. 2021;6:53. - PMC - PubMed
    1. Nemeth K, Keane-Myers A, Brown JM, Metcalfe DD, Gorham JD, Bundoc VG, et al. Bone marrow stromal cells use TGF-beta to suppress allergic responses in a mouse model of ragweed-induced asthma. Proc Natl Acad Sci USA. 2010;107:5652–7. - PMC - PubMed
    1. Rani S, Ryan AE, Griffin MD, Ritter T. Mesenchymal stem cell-derived extracellular vesicles: toward cell-free therapeutic applications. Mol Ther. 2015;23:812–23. - PMC - PubMed

Publication types