. 2023 Aug;72(8):2799-2812.
doi: 10.1007/s00262-023-03460-0. Epub 2023 May 12.

Brachyury-targeted immunotherapy combined with gemcitabine against head and neck cancer

Affiliations

Brachyury-targeted immunotherapy combined with gemcitabine against head and neck cancer

Hidekiyo Yamaki et al. Cancer Immunol Immunother. 2023 Aug.

Abstract

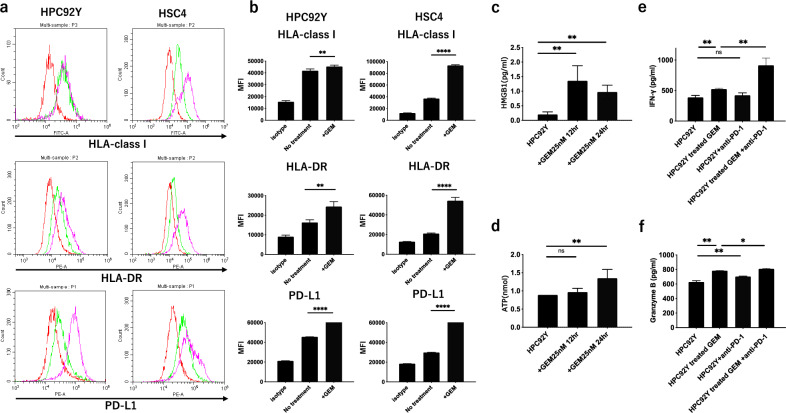
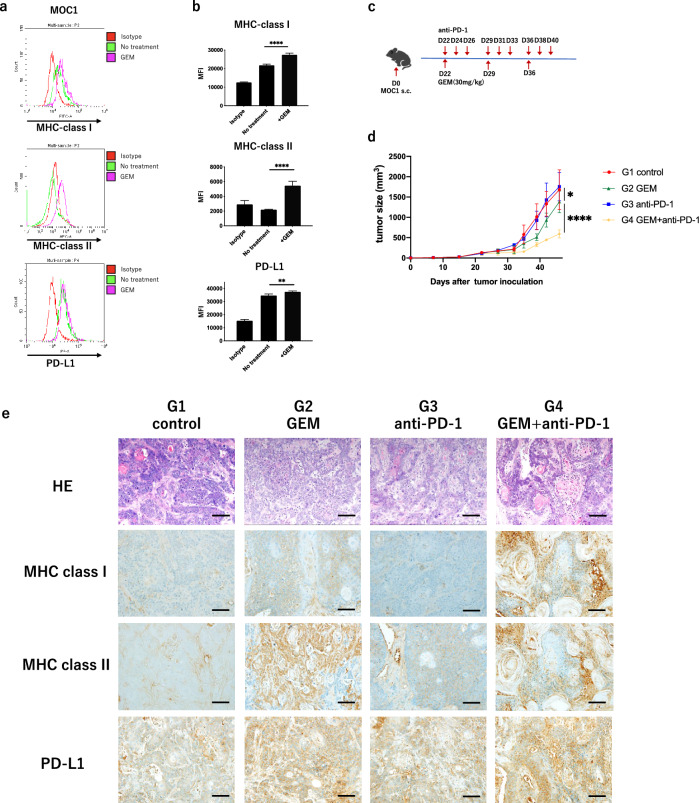
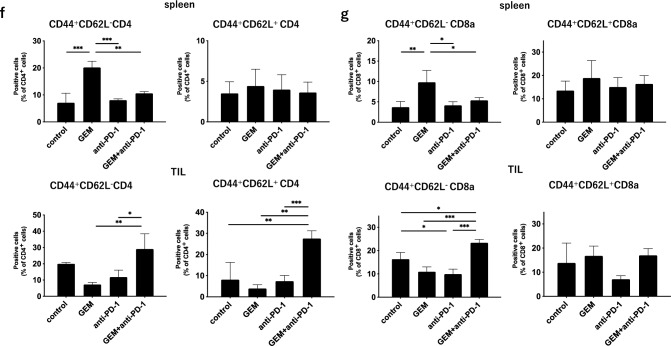
Brachyury is a transcription factor belonging to the T-box gene family and is involved in the posterior formation of the mesoderm and differentiation of chordates. As the overexpression of Brachyury is a poor prognostic factor in a variety of cancers, the establishment of Brachyury-targeted therapy would be beneficial for the treatment of aggressive tumors. Because transcription factors are difficult to treat with a therapeutic antibody, peptide vaccines are a feasible approach for targeting Brachyury. In this study, we identified Brachyury-derived epitopes that elicit antigen-specific and tumor-reactive CD4+ T cells that directly kill tumors. T cells recognizing Brachyury epitopes were present in patients with head and neck squamous cell carcinoma. Next, we focused on gemcitabine (GEM) as an immunoadjuvant to augment the efficacy of antitumor responses by T cells. Interestingly, GEM upregulated HLA class I and HLA-DR expression in tumor, followed by the upregulation of anti-tumor T cell responses. As tumoral PD-L1 expression was also augmented by GEM, PD-1/PD-L1 blockade and GEM synergistically enhanced the tumor-reactivity of Brachyury-reactive T cells. The synergy between the PD-1/PD-L1 blockade and GEM was also confirmed in a mouse model of head and neck squamous cell carcinoma. These results suggest that the combined treatment of Brachyury peptide with GEM and immune checkpoint blockade could be a promising immunotherapy against head and neck cancer.

Keywords: Brachyury; Gemcitabine; Head and neck squamous cell carcinoma; Immunotherapy; Peptide vaccine; Tumor-associated antigen.


Conflict of interest statement

The authors declare no potential conflicts of interest.

Figures

Fig. 1
Fig. 1
Expression of Brachyury in HNSCC specimens and HNSCC cell lines. a Representative immunohistochemical (IHC) images of Brachyury. The expression levels of tumor cells were classified as no, weak, moderate, or strong staining based on IHC staining intensity. Scale bar = 100 μm. b Distribution of IHC scores for Brachyury. Staining intensity scores for Brachyury in tumor cells were graded as follows: 0, no staining; 1, weak; 2, moderate; and 3, strong. Quantity scores for Brachyury consisted of the percentage of positively stained tumor cells and were graded as 0, < 5%; 1, 5–25%; 2, 26–50%; and 3, > 50%. The IHC score was calculated as the sum of the staining intensity. IHC scores ≥ 4 were defined as high expression and scores < 4 as low expression. c Western blot analysis of Brachyury expression in tumor cell lines. β-actin was used to confirm the amount of loaded protein. d The survival of patients with Stage III and IV HNSCC was analyzed based on Brachyury expression using The Human Protein Atlas database (https://www.proteinatlas.org/ENSG00000164458-TBXT/pathology/head+and+neck+cancer). The 5-year survival was low in HNSCC patients with high Brachyury expression (cut-off value, 0.01; p score, 0.023)
Fig. 2
Fig. 2
Establishment of Brachyury-reactive CD4+ T cell lines. a Brachyury-reactive CD4+ T cell lines were assessed for IFN-γ production in response to several concentrations of Brachyury peptide. Irradiated autologous PBMCs served as APCs. b HLA restriction of the Brachyury-reactive CD4+ T cell lines. Peptide-induced responses of the Brachyury-reactive CD4+ T cell lines were evaluated by co-culturing with peptide-pulsed irradiated autologous PBMCs in the context of anti-HLA-DR mAb or anti-HLA class I mAb. Anti-HLA class I mAb was used as a negative control. c Assessment of restrictive HLA-DR allele in the Brachyury-reactive CD4+ T cell lines. T cells were co-cultured with peptide and L-cells expressing individual HLA-DR as APCs. IFN-γ production in the supernatants was assessed by ELISA after co-culture for 48 h. The data shown are representative of the triplicate experiments. Bars and error bars represent the mean and SD, respectively. (*p < .05, **p < .01, ****p < 0.001, Student’s t test)
Fig. 3
Fig. 3
Brachyury-reactive CD4+ T cell lines recognize and kill Brachyury expressing HNSCC cells. a, b Brachyury-reactive CD4+ T cell lines were co-cultured with HLA-DR matched or unmatched HNSCC cell lines expressing Brachyury for 48 h. Brachyury189–203-reactive CD4+ T cell lines were restricted to HLA-DR53, and Brachyury258–272-reactive CD4+ T cell lines were restricted to HLA-DR4. The cell lines used were HPC 92Y (HLA-DR4, 9, and 53), HSC4 (HLA-DR1,4, and 53), and HSC3 (HLA-DR15). a IFN-γ and b Granzyme B production in the supernatants was evaluated by ELISA. c Killing activity of Brachyury-reactive CD4+ T cell line was evaluated by co-culturing with CFSE-labeled HNSCC cell lines for 6 h with various E:T (Effector:Target cells) ratio and measuring percentages of CFSE+ 7-AAD+ dead cells with flow cytometry. d Indirect tumor recognition by Brachyury-reactive CD4+ T cells. The ability of Brachyury-reactive CD4+ T cells to recognize naturally processed Brachyury was assessed using dendritic cells (DCs) as antigen-presenting cells (APCs), and HLA-DR-unmatched HNSCC tumor cell lysates served as sources of Brachyury. Supernatant from co-culture was assessed for IFN-γ production. DCs pulsed with Brachyury peptide were used as positive controls. The data shown are representative of the triplicate experiments. Bars and error bars represent the mean and SD, respectively. (*p < .05, **p < .01, ***p < .001, Student’s t test)
Fig. 4
Fig. 4
The existence of Brachyury-reactive precursor T cells in patients with HNSCC. PBMCs from patients with HNSCC were co-cultured with Brachyury peptides for two cycles every week. The T cell response to Brachyury peptide was assessed by measuring IFN-γ production in the supernatants using ELISA. Anti-HLA-DR mAb was used to assess HLA restriction in T-cells. The PADRE peptide was used as a positive control. The data are representative of triplicate experiments. Bars and error bars represent mean and SD, respectively. (*p < .05, **p < .01, ***p < .001, Student’s t test)
Fig. 5
Fig. 5
Gemcitabine serves as an immune adjuvant by upregulating MHC expression. a Cell surface expression of HLA-class I, HLA-DR, and PD-L1 on HPC-92Y and HSC4 cells cultured with or without 25 nM gemcitabine was determined by flow cytometry. Representative data of flow cytometry is shown. Red: isotype control, Green: untreated tumor cell lines, Pink: treated with gemcitabine. b Average values of mean fluorescence intensity (MFI). c, d HNSCC cell line was treated with or without gemcitabine for 12 h (or 24 h) before assessment. The production of HMGB1 and ATP was assessed by ELISA. e, f Brachyury-reactive CD4+ T cell lines were co-cultured with HNSCC cell lines for 48 h. HNSCC cell lines were treated with 25 nM Gemcitabine for 12 h before the assay. e, f IFN-γ and granzyme B production in the supernatants were evaluated by ELISA. The data shown are representative of the triplicate experiments. Bars and error bars represent the mean and SD, respectively. (*p < .05, **p < .01, ***p < .001, Student’s t test)
Fig. 6
Fig. 6
Immune checkpoint inhibitors augment the antitumor effect of gemcitabine in a mouse HNSCC model. a, b Cell surface expression levels of MHC class I, MHC-class II, and PD-L1 on a mouse HNSCC cell line were determined by flow cytometry. Cell lines were incubated with or without 25 nM gemcitabine. a Representative data of flow cytometry. Red: isotype control, Green: untreated tumor cell lines, Pink: treated with gemcitabine. b Average values of mean fluorescence intensity (MFI). ce Experimental schema. C57BL/6 mice were subcutaneously injected with 1 × 106 MOC1 cells. The mice were intraperitoneally treated with 30 mg/kg GEM weekly or/and anti-PD-1 Ab thrice per week from day 18 when the tumor size was approximately 7–8 mm. d Tumor growth curves. Control (Red), gemcitabine monotherapy (Green), anti-PD-1 Ab monotherapy (Blue), and combination therapy with GEM and anti-PD-1 Ab (Yellow) (n = 3/group). Bars and error bars represent the mean and SD, respectively (*p < .05, **p < .01, ***p < .001, two-way ANOVA). e Representative hematoxylin and eosin (HE) staining and immunohistochemical (IHC) images of MHC Class I, Class II, and PD-L1 of tumor on day 49. Scale bar = 100 μm. f, g The mice were sacrificed on day 49, and the percentages of T cells in spleens and TILs were evaluated using flow cytometry. The data shown are representative of the triplicate experiments. e The percentages of CD44+CD62LCD4+ T cells and CD44+CD62L+CD4+ T cells in spleens and TILs, f The percentages of CD44+CD62LCD8a+ T cells and CD44+CD62L+CD8a+ T cells spleens and TILs. Bars and error bars represent the mean and SD, respectively. (*p < .05, **p < .01, ***p < .001, Student’s t test)
Fig. 6
Fig. 6
Immune checkpoint inhibitors augment the antitumor effect of gemcitabine in a mouse HNSCC model. a, b Cell surface expression levels of MHC class I, MHC-class II, and PD-L1 on a mouse HNSCC cell line were determined by flow cytometry. Cell lines were incubated with or without 25 nM gemcitabine. a Representative data of flow cytometry. Red: isotype control, Green: untreated tumor cell lines, Pink: treated with gemcitabine. b Average values of mean fluorescence intensity (MFI). ce Experimental schema. C57BL/6 mice were subcutaneously injected with 1 × 106 MOC1 cells. The mice were intraperitoneally treated with 30 mg/kg GEM weekly or/and anti-PD-1 Ab thrice per week from day 18 when the tumor size was approximately 7–8 mm. d Tumor growth curves. Control (Red), gemcitabine monotherapy (Green), anti-PD-1 Ab monotherapy (Blue), and combination therapy with GEM and anti-PD-1 Ab (Yellow) (n = 3/group). Bars and error bars represent the mean and SD, respectively (*p < .05, **p < .01, ***p < .001, two-way ANOVA). e Representative hematoxylin and eosin (HE) staining and immunohistochemical (IHC) images of MHC Class I, Class II, and PD-L1 of tumor on day 49. Scale bar = 100 μm. f, g The mice were sacrificed on day 49, and the percentages of T cells in spleens and TILs were evaluated using flow cytometry. The data shown are representative of the triplicate experiments. e The percentages of CD44+CD62LCD4+ T cells and CD44+CD62L+CD4+ T cells in spleens and TILs, f The percentages of CD44+CD62LCD8a+ T cells and CD44+CD62L+CD8a+ T cells spleens and TILs. Bars and error bars represent the mean and SD, respectively. (*p < .05, **p < .01, ***p < .001, Student’s t test)

References

    1. Hayes RB, Ahn J, Fan X, et al. Association of oral microbiome with risk for incident head and neck squamous cell cancer. JAMA Oncol. 2018;4:358–365. doi: 10.1001/jamaoncol.2017.4777. - DOI - PMC - PubMed
    1. Bray F, Ferlay J, Soerjomataram I, Siegel RL, Torre LA, Jemal A. Global cancer statistics 2018: GLOBOCAN estimates of incidence and mortality worldwide for 36 cancers in 185 countries. CA Cancer J Clin. 2018;68:394–424. doi: 10.3322/caac.21492. - DOI - PubMed
    1. Zhuang RY, Xu HG. Head and neck cancer. N Engl J Med. 2020;382:e57. doi: 10.1056/NEJMc2001370. - DOI - PubMed
    1. Conley BA. Treatment of advanced head and neck cancer: What lessons have we learned? J Clin Oncol. 2006;24:1023–1025. doi: 10.1200/JCO.2005.05.0682. - DOI - PubMed
    1. Botticelli A, Cirillo A, Strigari L, et al. Anti-PD-1 and anti-PD-L1 in head and neck cancer: A network meta-analysis. Front Immunol. 2021;12:705096. doi: 10.3389/fimmu.2021.705096. - DOI - PMC - PubMed