

Respiratory microbiota and radiomics features in the stable COPD patients
- PMID: 37173744
- PMCID: PMC10176953
- DOI: 10.1186/s12931-023-02434-1
Respiratory microbiota and radiomics features in the stable COPD patients
Abstract
Backgrounds: The respiratory microbiota and radiomics correlate with the disease severity and prognosis of chronic obstructive pulmonary disease (COPD). We aim to characterize the respiratory microbiota and radiomics features of COPD patients and explore the relationship between them.
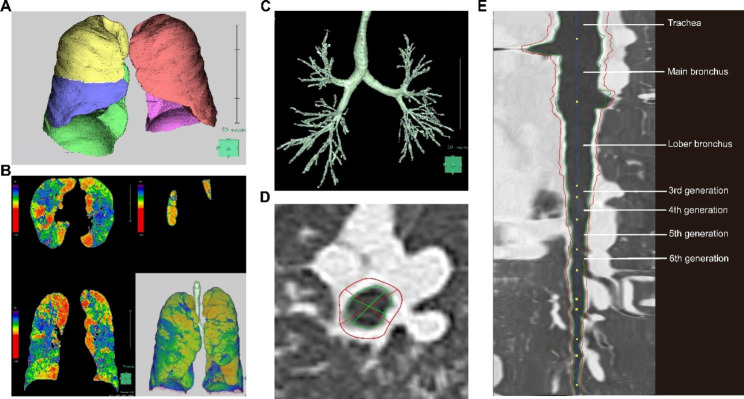
Methods: Sputa from stable COPD patients were collected for bacterial 16 S rRNA gene sequencing and fungal Internal Transcribed Spacer (ITS) sequencing. Chest computed tomography (CT) and 3D-CT analysis were conducted for radiomics information, including the percentages of low attenuation area below - 950 Hounsfield Units (LAA%), wall thickness (WT), and intraluminal area (Ai). WT and Ai were adjusted by body surface area (BSA) to WT/[Formula: see text] and Ai/BSA, respectively. Some key pulmonary function indicators were collected, which included forced expiratory volume in one second (FEV1), forced vital capacity (FVC), diffusion lung carbon monoxide (DLco). Differences and correlations of microbiomics with radiomics and clinical indicators between different patient subgroups were assessed.
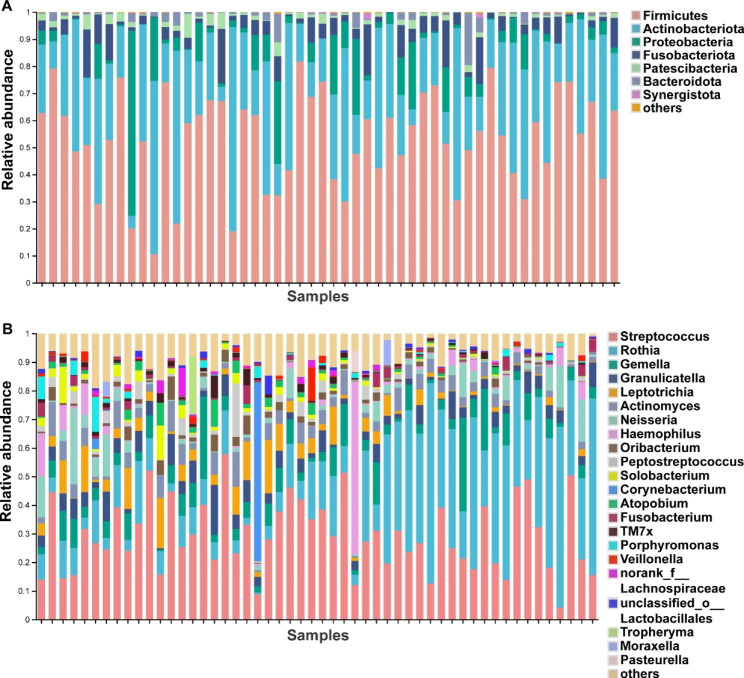
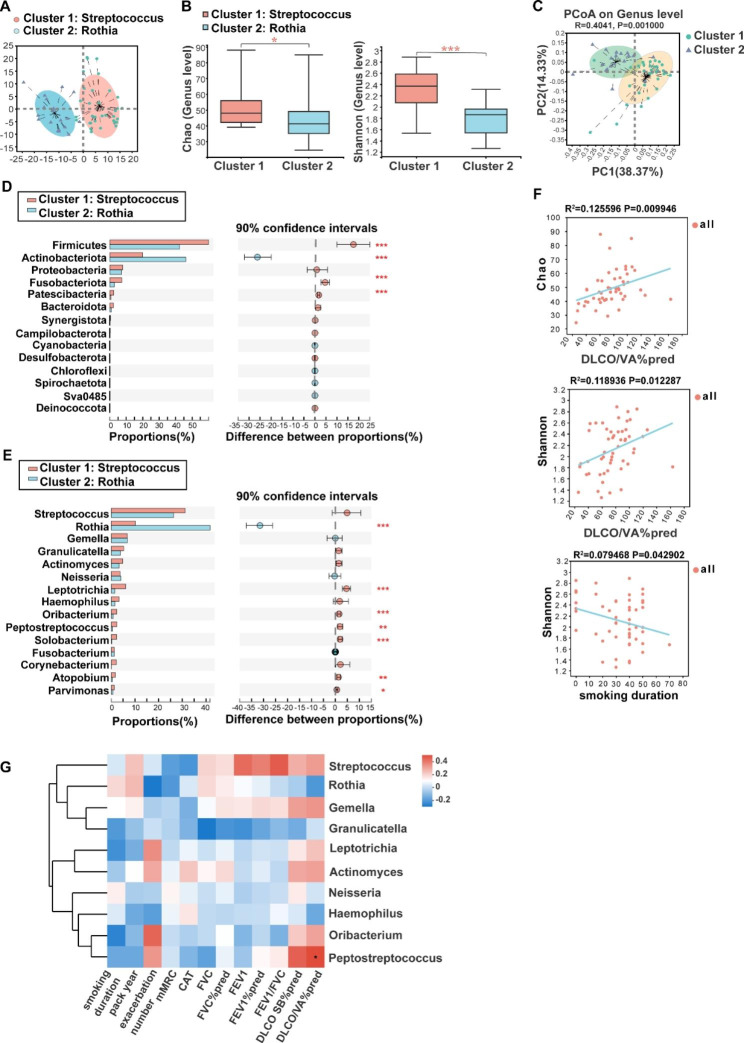
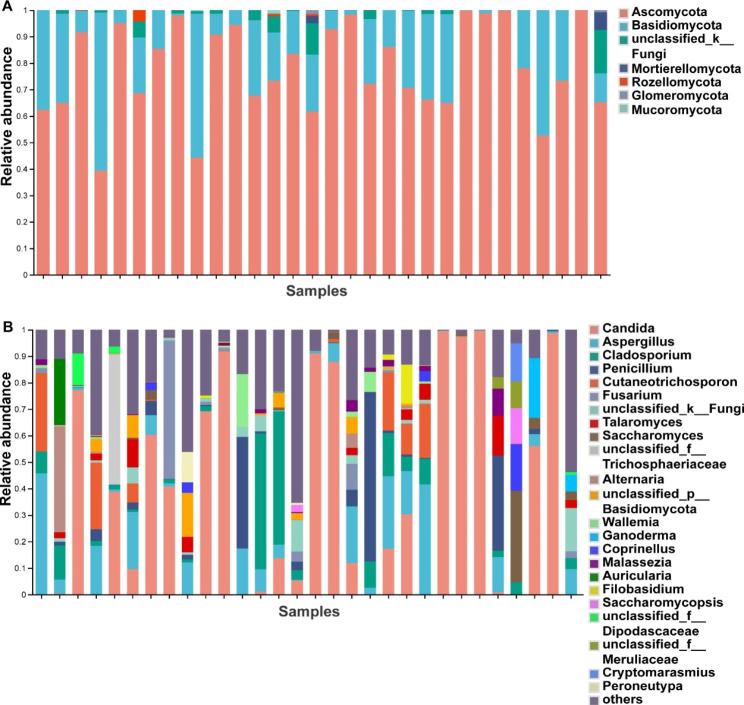
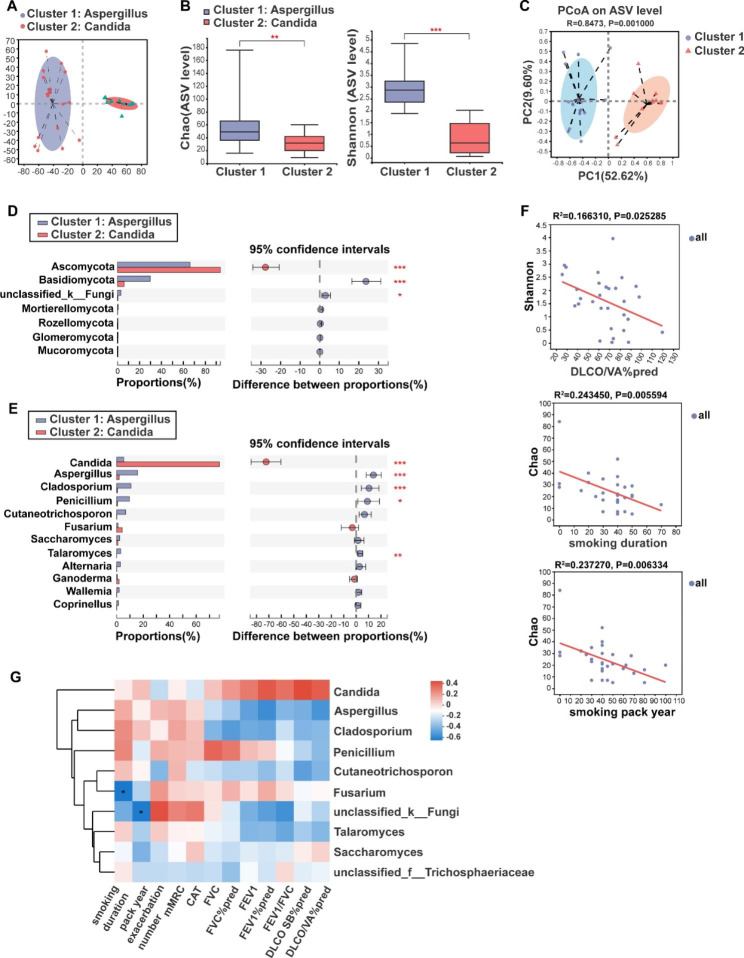
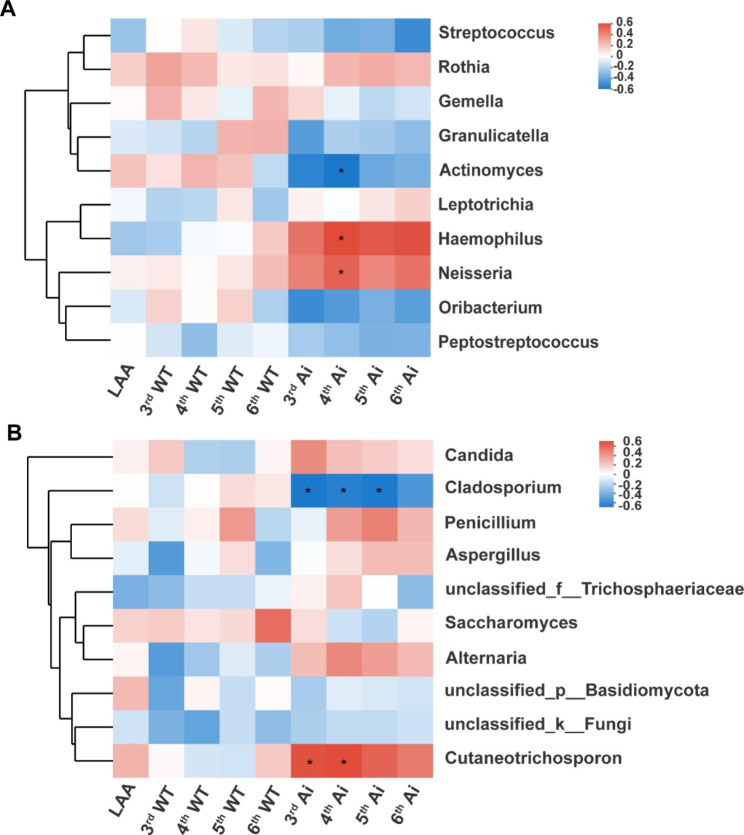
Results: Two bacterial clusters dominated by Streptococcus and Rothia were identified. Chao and Shannon indices were higher in the Streptococcus cluster than that in the Rothia cluster. Principal Co-ordinates Analysis (PCoA) indicated significant differences between their community structures. Higher relative abundance of Actinobacteria was detected in the Rothia cluster. Some genera were more common in the Streptococcus cluster, mainly including Leptotrichia, Oribacterium, Peptostreptococcus. Peptostreptococcus was positively correlated with DLco per unit of alveolar volume as a percentage of predicted value (DLco/VA%pred). The patients with past-year exacerbations were more in the Streptococcus cluster. Fungal analysis revealed two clusters dominated by Aspergillus and Candida. Chao and Shannon indices of the Aspergillus cluster were higher than that in the Candida cluster. PCoA showed distinct community compositions between the two clusters. Greater abundance of Cladosporium and Penicillium was found in the Aspergillus cluster. The patients of the Candida cluster had upper FEV1 and FEV1/FVC levels. In radiomics, the patients of the Rothia cluster had higher LAA% and WT/[Formula: see text] than those of the Streptococcus cluster. Haemophilus, Neisseria and Cutaneotrichosporon positively correlated with Ai/BSA, but Cladosporium negatively correlated with Ai/BSA.
Conclusions: Among respiratory microbiota in stable COPD patients, Streptococcus dominance was associated with an increased risk of exacerbation, and Rothia dominance was relevant to worse emphysema and airway lesions. Peptostreptococcus, Haemophilus, Neisseria and Cutaneotrichosporon probably affected COPD progression and potentially could be disease prediction biomarkers.
Keywords: COPD; Chest CT; Radiomics; Respiratory microbiota.
© 2023. The Author(s).
Conflict of interest statement
The authors declare that they have no competing interests.
Figures
References
-
- Li M, Cheng K, Ku K, et al. Factors influencing the length of Hospital Stay among Patients with Chronic Obstructive Pulmonary Disease (COPD) in Macao Population: a retrospective study of Inpatient Health record [J] Int J Chron Obstruct Pulmon Dis. 2021;16:1677–1685. doi: 10.2147/COPD.S307164. - DOI - PMC - PubMed
-
- World Health O. World health statistics 2021: monitoring health for the SDGs, sustainable development goals [M] Geneva: World Health Organization; 2021.
-
- Chotirmall S H, Gellatly S L, Budden K F, et al. Microbiomes in respiratory health and disease: An Asia-Pacific perspective [J]. Respirology (Carlton, Vic), 2017, 22(2): 240–250. - PubMed
MeSH terms
Grants and funding
- 82200024/National Natural Science Foundation of China
- 81660012/National Natural Science Foundation of China
- 81970020/National Natural Science Foundation of China
- 202102AA100057/Respiratory Diseases Clinical Medical Research Center of Yunnan Province
- 2019IC032-1/Nanshan Zhong Academician Workstation
- 2019SY006/Shanghai Municipal Health Commission
- 20dz2261100/Shanghai Key Laboratory of Emergency Prevention, Diagnosis and Treatment of Respiratory Infectious Diseases
- shslczdzk02202/Shanghai Municipal Key Clinical Specialty
- 20dz2210500/Cultivation Project of Shanghai Major Infectious Disease Research Base
LinkOut - more resources
Full Text Sources
Medical
Miscellaneous
