. 2023 Apr 23;15(9):2427.
doi: 10.3390/cancers15092427.

High-Dosage NMN Promotes Ferroptosis to Suppress Lung Adenocarcinoma Growth through the NAM-Mediated SIRT1-AMPK-ACC Pathway

Affiliations

High-Dosage NMN Promotes Ferroptosis to Suppress Lung Adenocarcinoma Growth through the NAM-Mediated SIRT1-AMPK-ACC Pathway

Mingjiong Zhang et al. Cancers (Basel). .

Abstract

Background: Nicotinamide mononucleotide (NMN) is the physiological circulating NAD precursor thought to elevate the cellular level of NAD+ and to ameliorate various age-related diseases. An inseparable link exists between aging and tumorigenesis, especially involving aberrant energetic metabolism and cell fate regulation in cancer cells. However, few studies have directly investigated the effects of NMN on another major ageing-related disease: tumors.

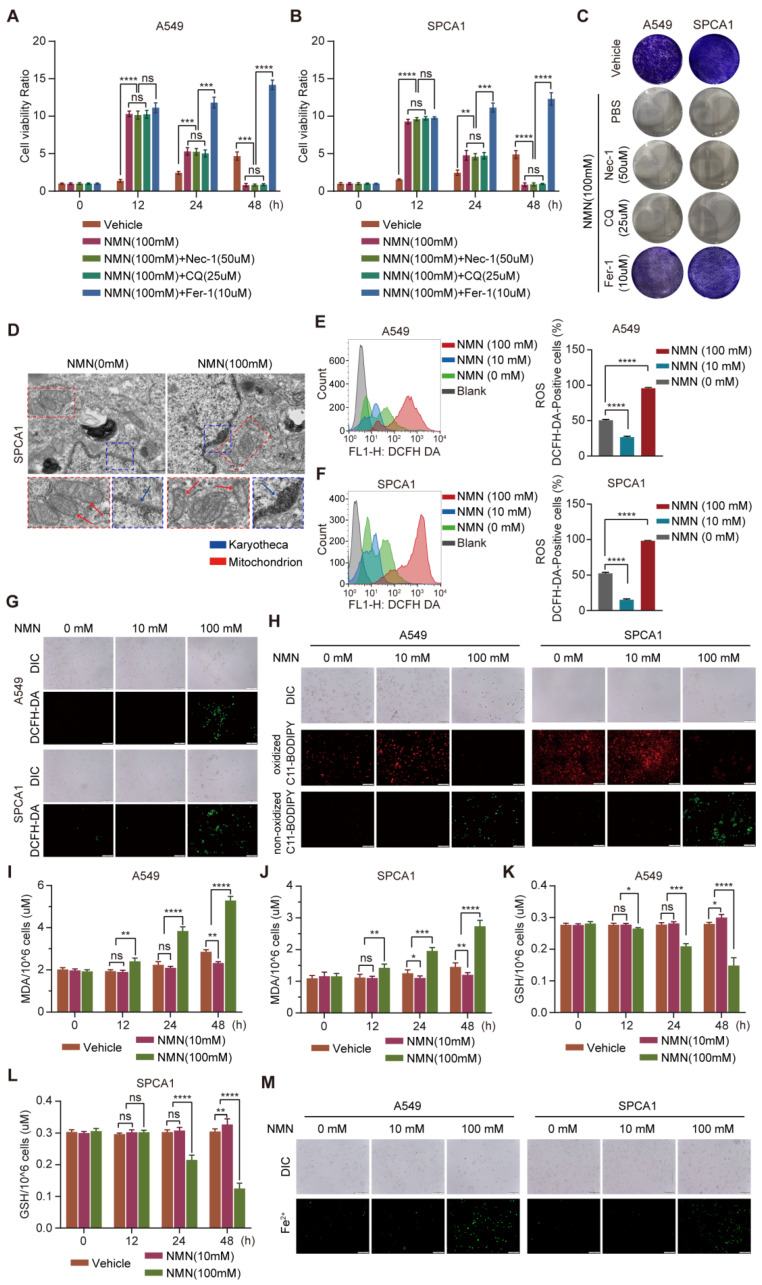
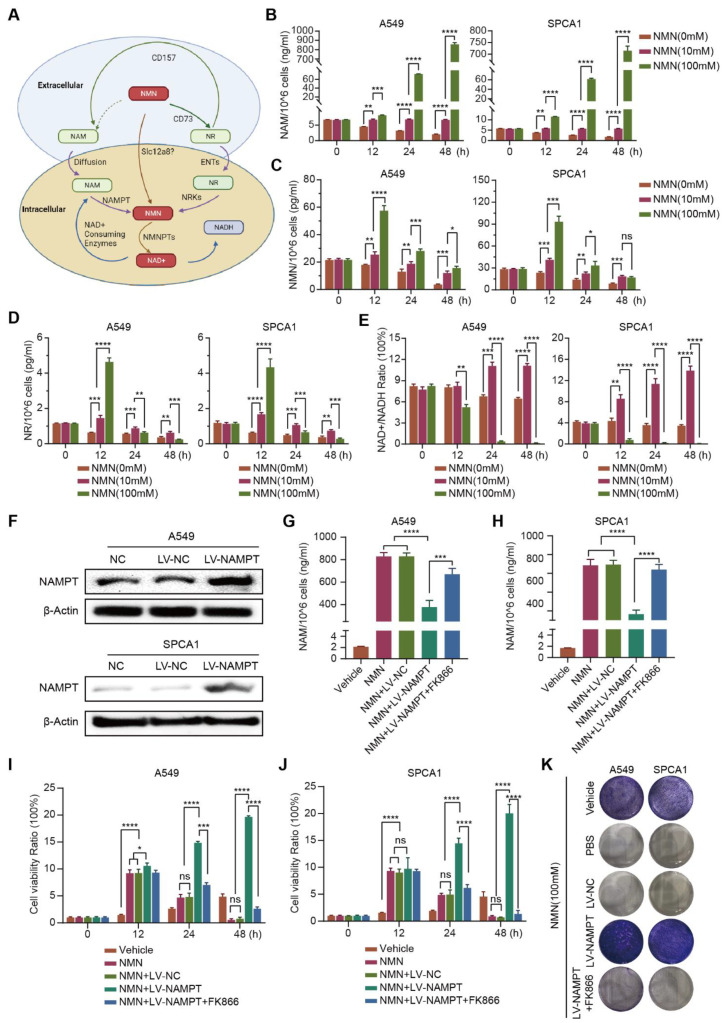
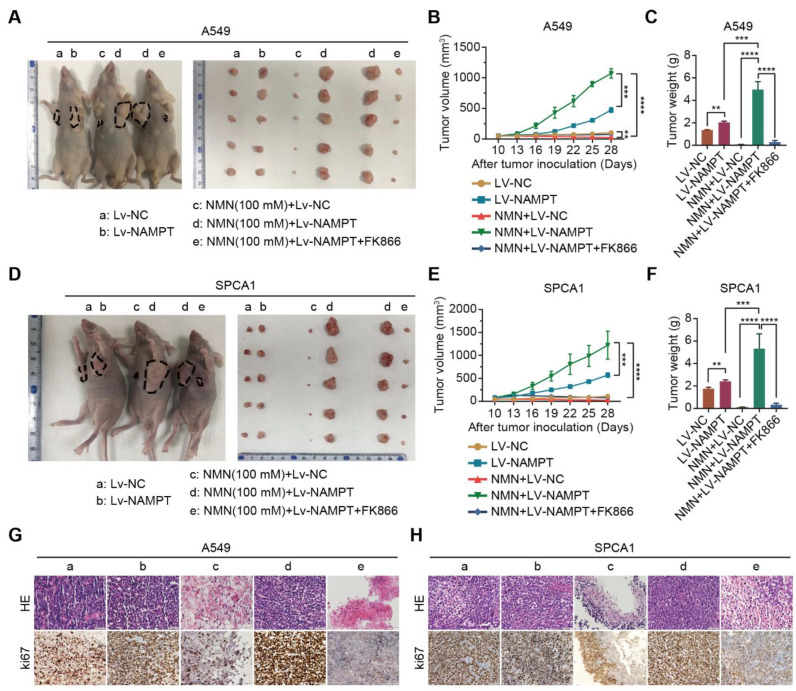
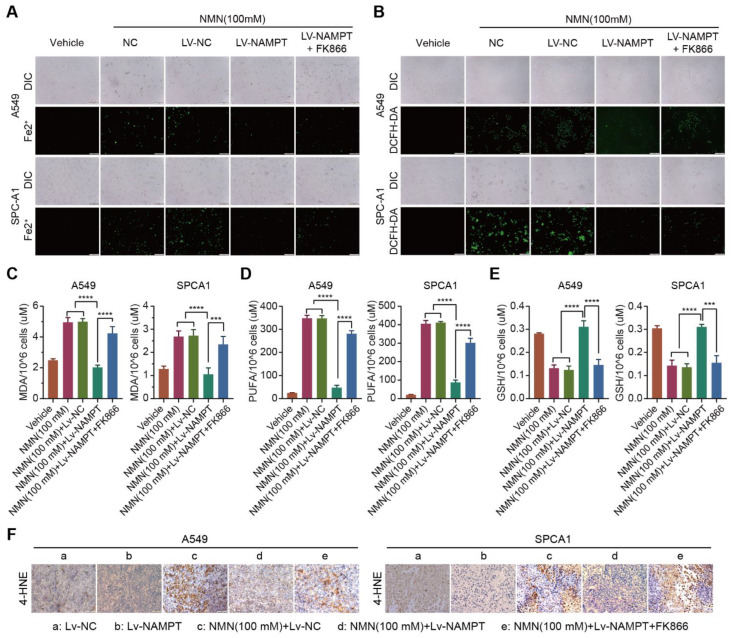
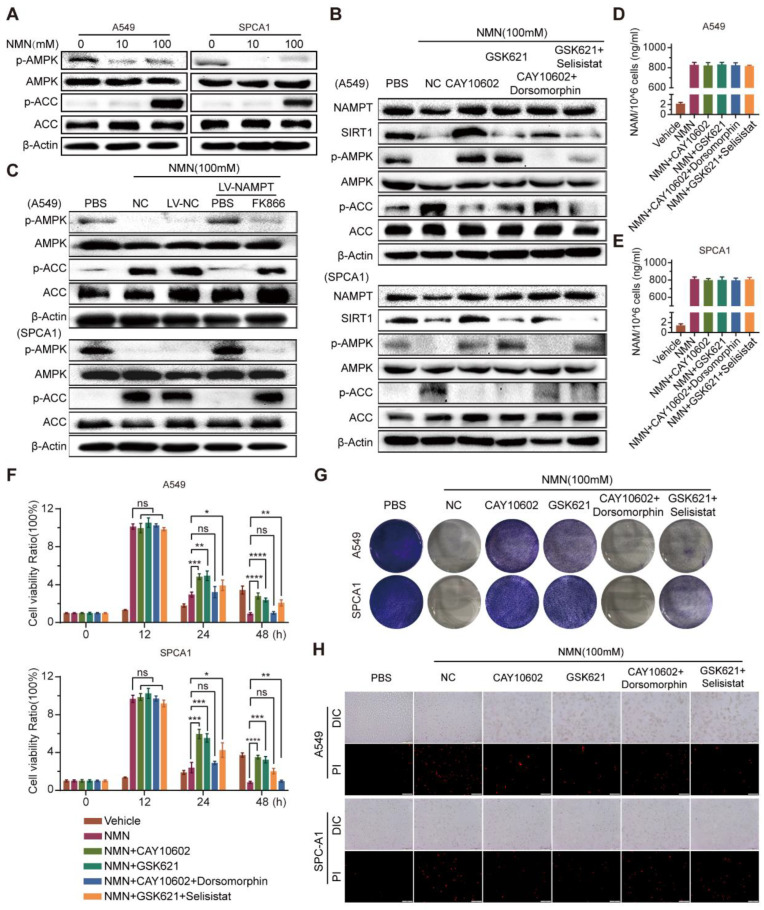
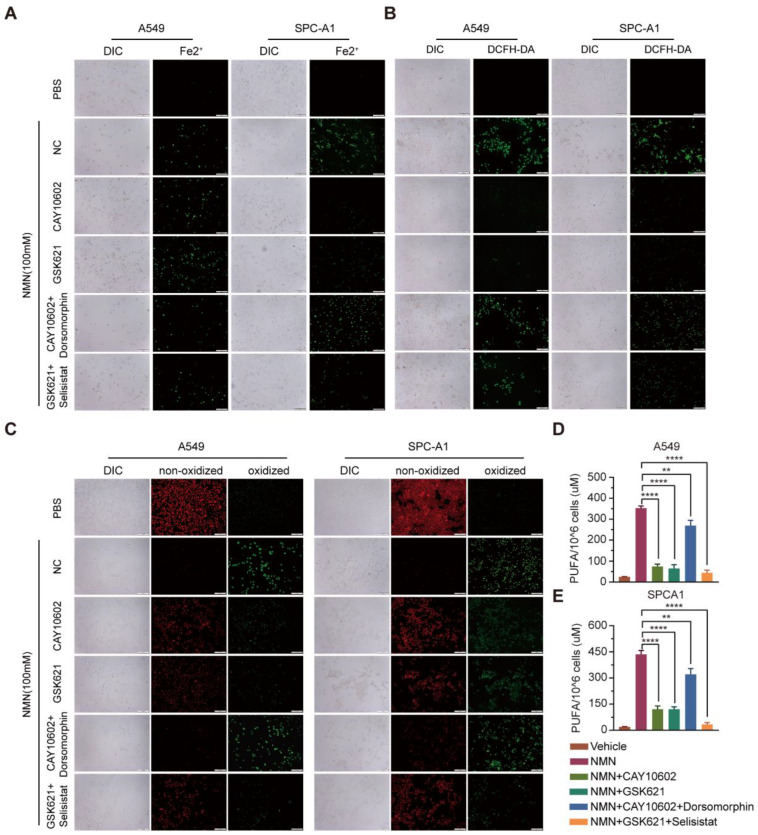
Methods: We conducted a series of cell and mouse models to evaluate the anti-tumor effect of high-dose NMN. Transmission electron microscopy and a Mito-FerroGreen-labeled immunofluorescence assay (Fe2+) were utilized to demonstrate ferroptosis. The metabolites of NAM were detected via ELISA. The expression of the proteins involved in the SIRT1-AMPK-ACC signaling were detected using a Western blot assay.

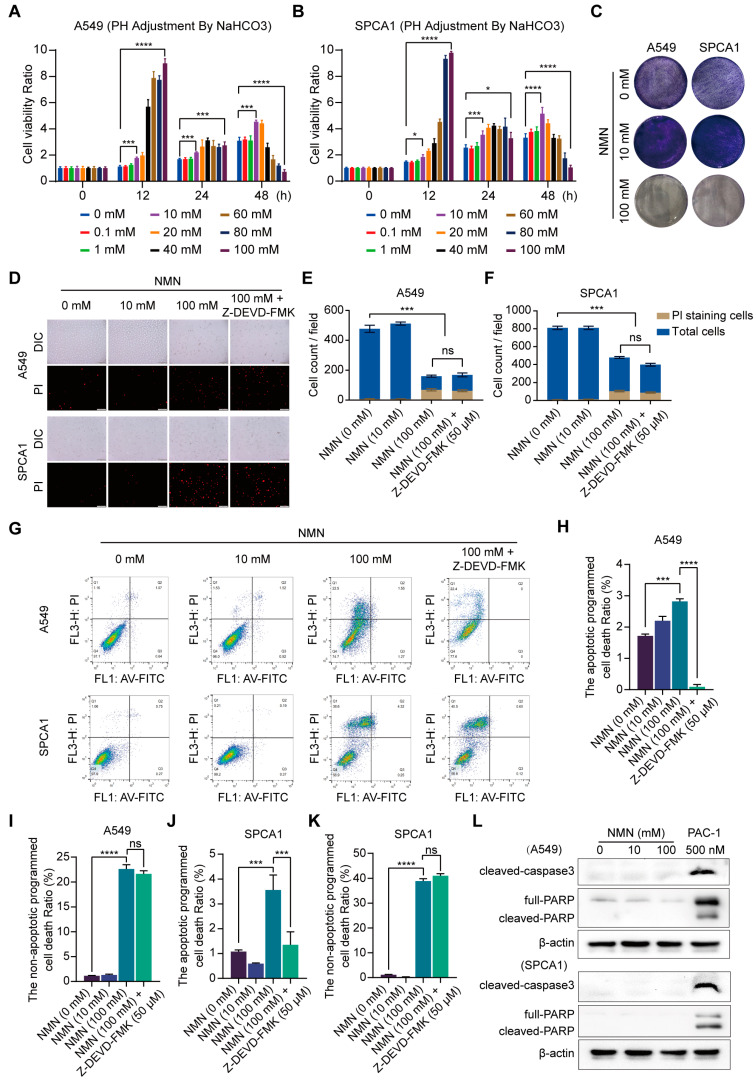
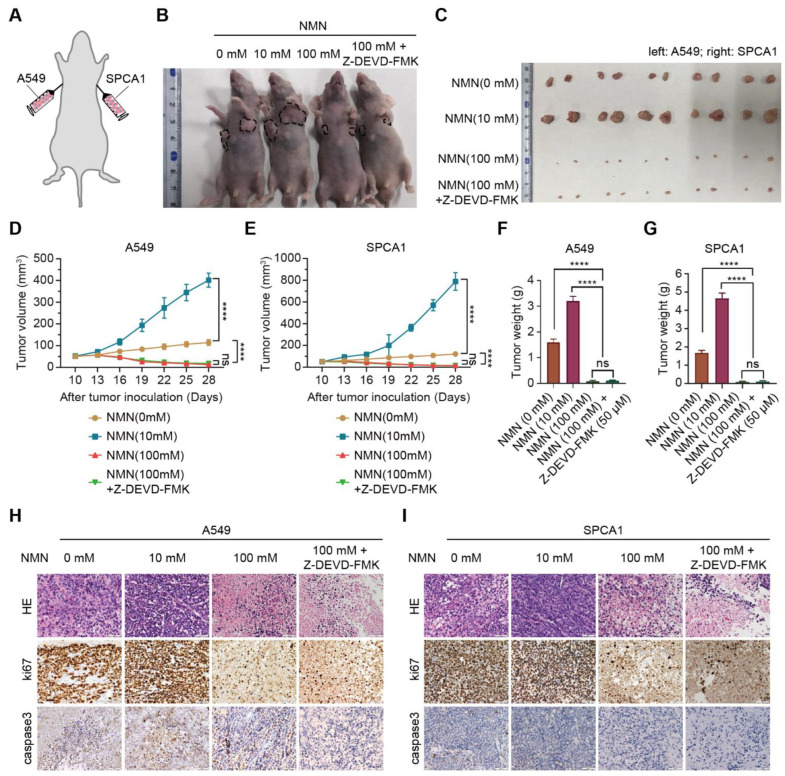
Results: The results showed that high-dose NMN inhibits lung adenocarcinoma growth in vitro and in vivo. Excess NAM is produced through the metabolism of high-dose NMN, whereas the overexpression of NAMPT significantly decreases intracellular NAM content, which, in turn, boosts cell proliferation. Mechanistically, high-dose NMN promotes ferroptosis through NAM-mediated SIRT1-AMPK-ACC signaling.

Conclusions: This study highlights the tumor influence of NMN at high doses in the manipulation of cancer cell metabolism, providing a new perspective on clinical therapy in patients with lung adenocarcinoma.

Keywords: NAM; NAMPT; NMN; ferroptosis; lung adenocarcinoma.


Conflict of interest statement

The authors declare no conflicts of interest.

Figures

Figure 1
Figure 1
High-dose NMN induced non-apoptotic regulated death in lung adenocarcinoma cells. (A,B) Cell proliferation of A549 (A) and SPCA1 (B) cells was measured using CCK8 assay after treatment with different doses of NMN for indicated times (n = 5). (C) Representative images of colony formation for A549 and SPCA1 cells after different doses of NMN treatment. (DF) Annexin V-FITC/PI double staining cytometry was analyzed for various NMN concentrations in presence or absence of caspase inhibitor (Z-DEVD-FMK). Representative fluorescence images of PI staining (D) and quantification of A549 (E) or SPCA1 (F) cell counts per field (n = 3); scale bar: 200 μm. (GK) FACS of A549 and SPCA1 cells after different doses of NMN treatment in presence or absence of Z-DEVD-FMK. Representative images of FACS analysis (G). Quantification of apoptotic (H) or non-apoptotic (I) regulated death A549 cells and apoptotic (J) or non-apoptotic (K) regulated death SPCA1 cells (n = 3). (L) Western blot analysis of cleaved caspase-3 and PARP in A549 and SPCA1 cells. * p value < 0.05; *** p < 0.001; **** p < 0.0001; ns, no significance.
Figure 2
Figure 2
High-dose NMN inhibited lung adenocarcinoma growth in vivo. (A) Schematic representation of A549 and SPCA1 cells’ xenograft model. (B,C) Representative image of tumor-bearing BALB/C nude mice (B) and macroscopic image (C) of excised tumors in indicated groups. (D,E) Tumor growth curves of A549 (D) and SPCA1 (E) cells in indicated groups (n = 6). (F,G) Tumor weights of A549 (F) and SPCA1 (G) cells in indicated groups (n = 6). (H,I) Representative HE and immunohistochemistry staining of ki67 and caspase3 in A549 (H) and SPCA1 (I) tumor nodules; scale bar: 50 μm. **** p < 0.0001; ns, no significance.
Figure 3
Figure 3
High-dose NMN induced ferroptosis of lung adenocarcinoma cells. (A,B) Cell proliferation of A549 (A) and SPCA1 (B) cells was measured using CCK8 assay after treatment with Nec-1, CQ, or Fer-1 combined with high-dose NMN for indicated durations (n = 5). (C) Representative images of colony formation for A549 and SPCA1 cells after treatment with Nec-1, CQ, or Fer-1 combined with high-dose NMN. (D) Representative images of mitochondrial and nuclear membrane morphology of SPCA1 cells via transmission electron microscopy analysis; scale bar: 200 nm. Blue arrows indicate karyotheca, and red arrows indicate mitochondria. (EG) ROS production in A549 and SPCA1 cells induced by high-dose NMN was detected via DCFH-DA and measured via flow cytometry analysis (E,F) and immunofluorescence analysis (G); scale bar: 200 μm. (H) The effect of NMN on lipid peroxidation was detected in A549 and SPCA1 cells measured using BODIPY 581/591 C11 stain (BODIPY-C11); scale bar: 200 μm. (I,J) MDA levels in A549 (I) and SPCA1 (J) cells were examined using ELISA assay at different time points (n = 5). (K,L) GSH levels in A549 (K) and SPCA1 (L) cells were examined via ELISA assay at different time points (n = 5). (M) Mitochondrial iron concentration was determined via Mito-FerroGreen labeling using cell immunofluorescence; scale bar: 200 μm. * p value < 0.05; ** p value < 0.01; *** p < 0.001; **** p < 0.0001; ns, no significance.
Figure 4
Figure 4
High-dosage NMN inhibits lung adenocarcinoma cell proliferation through its metabolite NAM. (A) Graphic illustration of intracellular NMN metabolism. (BE) Concentrations of NMN metabolites NAM (B), NMN (C), and NR (D), along with the NAD+/NADH ratio (E) in A549 and SPCA1 cells after treatment with indicated concentrations of NMN, as measured using ELISA kits (n = 5). (F) Western blot analysis of NAMPT protein expression in A549 and SPCA1 cells after transfection with an overexpression of NAMPT or control lentivirus. (G,H) A549 (G) and SPCA1 (H) intracellular NAM contents were tested using ELISA kits in indicated groups (n = 5). (I,J) Cell proliferation of A549 (I) and SPCA1 (J) cells was measured using CCK8 assay in indicated groups (n = 5). (K) Representative images of colony formation for A549 and SPCA1 cells in indicated groups. * p value < 0.05; ** p value < 0.01; *** p < 0.001; **** p < 0.0001; ns, no significance.
Figure 5
Figure 5
High-dosage NMN inhibits lung adenocarcinoma growth through its metabolite NAM in vivo. (A) Representative image of A549 xenograft model and macroscopic image of excised tumors in indicated groups. (B,C) Tumor growth curves (B) and tumor weight (C) in indicated groups (n = 6). (D) Representative image of SPCA1 xenograft model and macroscopic image of excised tumors in indicated groups. (E,F), Tumor growth curves (E) and tumor weight (F) in indicated groups (n = 6). (G,H) Representative HE and immunohistochemistry staining of ki67 in the A549 (G) and SPCA1 (H) tumor nodules in indicated groups (a: Lv-NC, b: Lv-NAMPT, c: NMN (100 mM)+ Lv-NC, d: NMN (100 mM)+ Lv-NAMPT, e: NMN (100 mM)+ Lv-NAMPT+FK866); scale bar: 50 μm. ** p value < 0.01; *** p < 0.001; **** p < 0.0001.
Figure 6
Figure 6
High-dosage NMN induces ferroptosis via its metabolite NAM. (A) The A549 and SPCA1 mitochondrial iron concentrations determined through Mito-FerroGreen labeling using cell immunofluorescence in indicated groups; scale bar: 200 μm. (B) ROS production in A549 and SPCA1 cells detected via DCFH-DA and immunofluorescence analysis in indicated groups; scale bar: 200 μm. (CE) MDA (C), PUFA (D), and GSH (E) levels in A549 and SPCA1 cells examined via ELISA assay in indicated groups (n = 5). (F) Representative immunohistochemistry staining of 4-HNE in A549 and SPCA1 tumor nodules; scale bar: 50 μm. *** p < 0.001; **** p < 0.0001.
Figure 7
Figure 7
High-dosage NMN promoted ferroptosis of lung adenocarcinoma cells through NAM-overload-mediated SIRT1–AMPK–ACC pathway. (A) A549 and SPCA1 cells were treated with low- or high-dose NMN for 48 h; results of Western blot analysis of p-AMPK and p-ACC protein expression. (B) A549 and SPCA1 cells were treated with the SIRT1 agonist (CAY10602) or inhibitor (Selisistat), AMPK agonist (GSK621) or inhibitor (dorsomorphin), or combinations of the above agents, followed by high-dose NMN treatment for various intervals as indicated. Results of Western blot analysis of NAMPT, SIRT1, p-AMPK, and p-ACC protein expressions. (C) A549 and SPCA1 cells overexpressing NAMPT. The control was assessed with or without FK866 treatment, followed by high-dose NMN treatment for the indicated intervals. Results of Western blot analysis of p-AMPK and p-ACC protein expressions. (D,E) A549 (D) and SPCA1 (E) intracellular NAM contents were tested using ELISA kits in indicated groups (n = 5). (F) Cell proliferation of A549 and SPCA1 cells was measured using CCK8 assay in indicated groups (n = 5). (G) Representative images of colony formation for A549 and SPCA1 cells in indicated groups. (H) Annexin V-FITC/PI double staining cytometry was analyzed in indicated groups. Representative fluorescence images of PI staining; scale bar: 200 μm. * p value < 0.05; ** p value < 0.01; *** p < 0.001; **** p < 0.0001; ns, no significance.
Figure 8
Figure 8
High-dosage NMN promoted ferroptosis of lung adenocarcinoma cells through NAM-overload-mediated SIRT1–AMPK–ACC pathway. (A) Mitochondrial iron concentration was determined via Mito-FerroGreen labeling using cell immunofluorescence in indicated groups; scale bar: 200 μm. (B) ROS production in A549 and SPCA1 cells detected via DCFH-DA, measured using immunofluorescence analysis in indicated groups; scale bar: 200 μm. (C) Lipid peroxidation was detected in A549 and SPCA1 cells measured using BODIPY 581/591 C11 stain (BODIPY-C11); scale bar: 200 μm. (D,E) PUFA levels in A549 (D) and SPCA1 (E) cells were examined using ELISA assay in indicated groups (n = 5). ** p value < 0.01; **** p < 0.0001.
Figure 9
Figure 9
Proposed model for effects of NMN on regulating lung adenocarcinoma cell ferroptosis. In the context of high-dose NMN treatment (left), excess metabolized NAM inhibited AMPK phosphorylation by targeting SIRT1, triggering the process of ferroptosis via ACC activation pathways. In the context of low-dose NMN treatment (right), NAD+ was catalyzed in large quantities through intracellular NMN synthesized by a suitable concentration of NAM, leading to cancer cell proliferation.

References

    1. Zhang W., Qu J., Liu G.H., Belmonte J.C.I. The ageing epigenome and its rejuvenation. Nat. Rev. Mol. Cell Biol. 2020;21:137–150. doi: 10.1038/s41580-019-0204-5. - DOI - PubMed
    1. Saez-Atienzar S., Masliah E. Cellular senescence and Alzheimer disease: The egg and the chicken scenario. Nat. Rev. Neurosci. 2020;21:433–444. doi: 10.1038/s41583-020-0325-z. - DOI - PubMed
    1. Soukas A.A., Hao H., Wu L. Metformin as Anti-Aging Therapy: Is It for Everyone? Trends Endocrinol. Metab. 2019;30:745–755. doi: 10.1016/j.tem.2019.07.015. - DOI - PMC - PubMed
    1. Baker D.J., Wijshake T., Tchkonia T., Lebrasseur N.K., Childs B.G., Van De Sluis B., Kirkland J.L., Van Deursen J.M. Clearance of p16Ink4a-positive senescent cells delays ageing-associated disorders. Nature. 2011;479:232–236. doi: 10.1038/nature10600. - DOI - PMC - PubMed
    1. Yoshino J., Baur J.A., Imai S.I. NAD(+) Intermediates: The Biology and Therapeutic Potential of NMN and NR. Cell Metab. 2018;27:513–528. doi: 10.1016/j.cmet.2017.11.002. - DOI - PMC - PubMed

LinkOut - more resources