

Computational Optimization of Irradiance and Fluence for Interstitial Photodynamic Therapy Treatment of Patients with Malignant Central Airway Obstruction
- PMID: 37174102
- PMCID: PMC10177073
- DOI: 10.3390/cancers15092636
Computational Optimization of Irradiance and Fluence for Interstitial Photodynamic Therapy Treatment of Patients with Malignant Central Airway Obstruction
Abstract
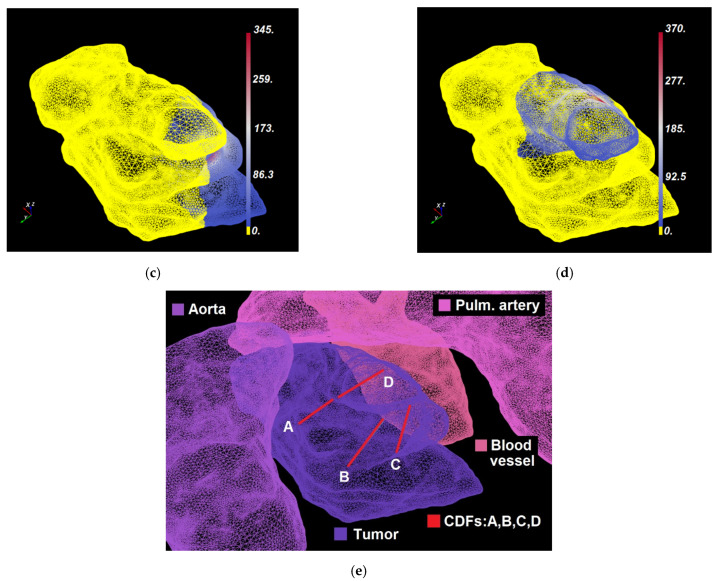
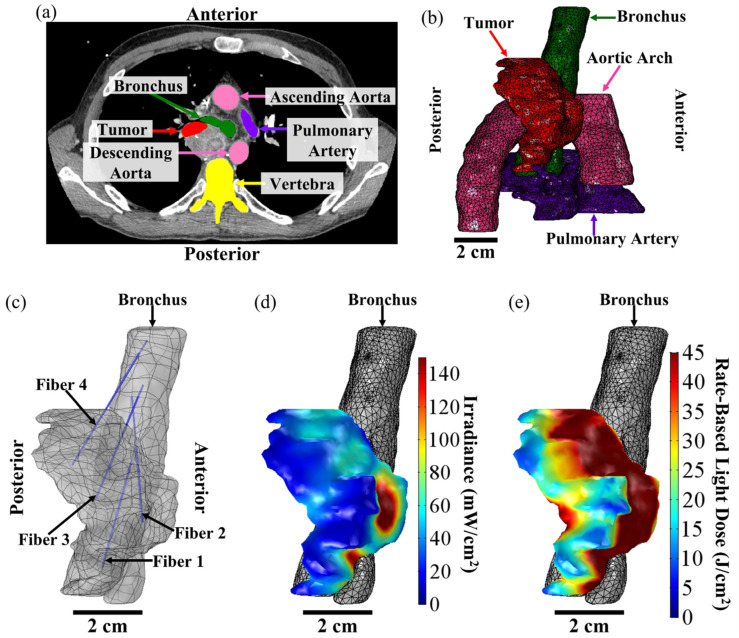
There are no effective treatments for patients with extrinsic malignant central airway obstruction (MCAO). In a recent clinical study, we demonstrated that interstitial photodynamic therapy (I-PDT) is a safe and potentially effective treatment for patients with extrinsic MCAO. In previous preclinical studies, we reported that a minimum light irradiance and fluence should be maintained within a significant volume of the target tumor to obtain an effective PDT response. In this paper, we present a computational approach to personalized treatment planning of light delivery in I-PDT that simultaneously optimizes the delivered irradiance and fluence using finite element method (FEM) solvers of either Comsol Multiphysics® or Dosie™ for light propagation. The FEM simulations were validated with light dosimetry measurements in a solid phantom with tissue-like optical properties. The agreement between the treatment plans generated by two FEMs was tested using typical imaging data from four patients with extrinsic MCAO treated with I-PDT. The concordance correlation coefficient (CCC) and its 95% confidence interval (95% CI) were used to test the agreement between the simulation results and measurements, and between the two FEMs treatment plans. Dosie with CCC = 0.994 (95% CI, 0.953-0.996) and Comsol with CCC = 0.999 (95% CI, 0.985-0.999) showed excellent agreement with light measurements in the phantom. The CCC analysis showed very good agreement between Comsol and Dosie treatment plans for irradiance (95% CI, CCC: 0.996-0.999) and fluence (95% CI, CCC: 0.916-0.987) in using patients' data. In previous preclinical work, we demonstrated that effective I-PDT is associated with a computed light dose of ≥45 J/cm2 when the irradiance is ≥8.6 mW/cm2 (i.e., the effective rate-based light dose). In this paper, we show how to use Comsol and Dosie packages to optimize rate-based light dose, and we present Dosie's newly developed domination sub-maps method to improve the planning of the delivery of the effective rate-based light dose. We conclude that image-based treatment planning using Comsol or Dosie FEM-solvers is a valid approach to guide the light dosimetry in I-PDT of patients with MCAO.
Keywords: I-PDT; MCAO; computational optimization; fluence; interstitial photodynamic therapy; irradiance; malignant central airway obstruction; rate-based light dose; treatment planning.
Conflict of interest statement
(within the past 36 months) The following authors are employees: E.P, K.B, and M.P (Simphotek, Inc.). G. Shafirstein and E. Oakley are co-inventors in patent applications (owned by Roswell Park Comprehensive Cancer Center) for a light dosimetry system for interstitial photodynamic therapy. G. Shafirstein acknowledges receiving research grant support, including free Photofrin® and fibers from Pinnacle Biologics Inc. G. Shafirstein acknowledges current service on a scientific advisory board with honoraria and stock options from Lumeda Inc. (Rocky Hill, CT, USA) G. Shafirstein acknowledges grant support from Lung Cancer Initiative at Johnson & Johnson, and grant support from POP Biotechnologies, LLC and Simphotek Inc. through NIH awards. N. Ivanick acknowledges receiving free Photofrin® and fibers from Pinnacle Biologics Inc. for clinical research at Roswell Park Comprehensive Cancer Center. N. Ivanick acknowledges acting as a paid healthcare consultant for Johnson & Johnson through the Lung Cancer Initiative.
Figures


Similar articles
-
Three-dimensional finite-element based deformable image registration for evaluation of pleural cavity irradiation during photodynamic therapy.Med Phys. 2017 Jul;44(7):3767-3775. doi: 10.1002/mp.12284. Epub 2017 May 24. Med Phys. 2017. PMID: 28426148 Free PMC article.
-
A Treatment Planning System for Pleural PDT.Proc SPIE Int Soc Opt Eng. 2010 Mar 2;7551:75510C. doi: 10.1117/12.843044. Proc SPIE Int Soc Opt Eng. 2010. PMID: 26005242 Free PMC article.
-
Effective fluence and dose at skin depth of daylight and lamp sources for PpIX-based photodynamic therapy.Photodiagnosis Photodyn Ther. 2023 Mar;41:103260. doi: 10.1016/j.pdpdt.2022.103260. Epub 2023 Jan 7. Photodiagnosis Photodyn Ther. 2023. PMID: 36627070
-
AAPM Task Group Report 274: Fluence rate dosimetry for photodynamic therapy (PDT).Med Phys. 2025 Mar;52(3):1354-1371. doi: 10.1002/mp.17613. Epub 2025 Jan 15. Med Phys. 2025. PMID: 39815459 Free PMC article. Review.
-
On the need for standardized reporting of photophysical parameters of in vitro photodynamic therapy studies.Photodiagnosis Photodyn Ther. 2023 Mar;41:103263. doi: 10.1016/j.pdpdt.2022.103263. Epub 2022 Dec 29. Photodiagnosis Photodyn Ther. 2023. PMID: 36587862 Review.
Cited by
-
Photosensitizer spatial heterogeneity and its impact on personalized interstitial photodynamic therapy treatment planning.J Biomed Opt. 2025 Jan;30(1):018001. doi: 10.1117/1.JBO.30.1.018001. Epub 2025 Jan 11. J Biomed Opt. 2025. PMID: 39802351 Free PMC article.
-
Interventional bronchoscopy in lung cancer treatment.Breathe (Sheff). 2024 Aug 27;20(2):230201. doi: 10.1183/20734735.0201-2023. eCollection 2024 Jun. Breathe (Sheff). 2024. PMID: 39193456 Free PMC article. Review.
-
Devices and Methods for Dosimetry of Personalized Photodynamic Therapy of Tumors: A Review on Recent Trends.Cancers (Basel). 2024 Jul 8;16(13):2484. doi: 10.3390/cancers16132484. Cancers (Basel). 2024. PMID: 39001546 Free PMC article. Review.
References
Grants and funding
LinkOut - more resources
Full Text Sources
