Review
. 2023 May 8;15(9):2661.
doi: 10.3390/cancers15092661.

Endorsement of TNBC Biomarkers in Precision Therapy by Nanotechnology

Affiliations
Review

Endorsement of TNBC Biomarkers in Precision Therapy by Nanotechnology

Aiswarya Chaudhuri et al. Cancers (Basel). .

Abstract

Breast cancer is a heterogeneous disease which accounts globally for approximately 1 million new cases annually, wherein more than 200,000 of these cases turn out to be cases of triple-negative breast cancer (TNBC). TNBC is an aggressive and rare breast cancer subtype that accounts for 10-15% of all breast cancer cases. Chemotherapy remains the only therapy regimen against TNBC. However, the emergence of innate or acquired chemoresistance has hindered the chemotherapy used to treat TNBC. The data obtained from molecular technologies have recognized TNBC with various gene profiling and mutation settings that have helped establish and develop targeted therapies. New therapeutic strategies based on the targeted delivery of therapeutics have relied on the application of biomarkers derived from the molecular profiling of TNBC patients. Several biomarkers have been found that are targets for the precision therapy in TNBC, such as EGFR, VGFR, TP53, interleukins, insulin-like growth factor binding proteins, c-MET, androgen receptor, BRCA1, glucocorticoid, PTEN, ALDH1, etc. This review discusses the various candidate biomarkers identified in the treatment of TNBC along with the evidence supporting their use. It was established that nanoparticles had been considered a multifunctional system for delivering therapeutics to target sites with increased precision. Here, we also discuss the role of biomarkers in nanotechnology translation in TNBC therapy and management.

Keywords: biomarkers; nanoparticles; personalized therapy; targeted therapy; triple-negative breast cancer.


Conflict of interest statement

The authors declare no conflict of interest.

Figures
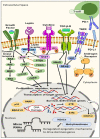
Figure 1
Figure 1
Different signaling pathways and epigenetic mechanisms that have been deregulated during TNBC progression and growth, contributing to stemness. Tyrosine kinase receptors promote tumorigenesis through Ras and the PI3K/AKT/mTOR signaling pathway. ERK phosphorylation, the activation of STAT, and the PI3K/AKT/mTOR pathway promote EMT, and regulate the proliferation, migration, and invasion of cancer cells. The activation of NF-κβ and the SMAD pathway promote the survival and self-renewal of genes. In the cytoplasm, the androgen receptor (AR) binds with the chaperone proteins and undergoes phosphorylation, which promotes the transcription of target genes in the nucleus. Within the nucleus, at the genetic level, the BRCA1/2, and p53 mutation, promote TNBC progression. PD-1/PD-L1 signaling suppresses CD8+ T activation, which in turn results in a tumor microenvironment and decreases tumor-infiltrating lymphocytes. The inactivation of PTEN, and FOXO, promote the PI3K/AKT/mTOR signaling pathway.
Figure 2
Figure 2
Potential therapeutic targets and their associated drugs for the treatment of TNBC. The black arrow shows upregulation or excitatory regulation, and the red-headed line bar shows the corresponding inhibitory effect.
Figure 3
Figure 3
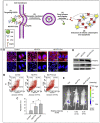
(I) The model of ND-Cet-PTX, used in enhancing drug efficacy and overcoming drug resistance in human triple-negative breast cancer. (II) ND-PTX-Cet enhanced the mitotic catastrophe, apoptosis, and tumor inhibition. (A) The MDA-MB-231 cells were treated with or without 1 mg/mL of ND-PTX and ND-PTX-Cet for 48 h. (B) Flow cytometry analysis: Cells staining with Annexin V+/PI are those undergoing early apoptosis (lower right), and Annexin V+/PI+-stained cells are undergoing late apoptosis (upper right). (C) The population of total apoptotic cells (including early and late apoptotic cells) was quantified using CellQuest software. The bar represents the mean ± S.E. ## p < 0.05, indicating a significant difference between the ND-PTX and control samples. * p < 0.05 indicates a significant difference between the ND-PTX and ND-PTX-Cet treated samples. (D) The protein levels of p-Histone H3 (Ser10) and active caspase-3 were determined by the western blot. Representative images of the western blot are shown from one of three independent experiments. (E) The nude mice were subcutaneously injected with 4 × 10⁶ MDA-MB-231-luc2 tdTomato breast cancer cells. After inoculation, the mice bearing tumors were treated with or without 20 mg/kg of Cet, ND-PTX, or ND-PTX-Cet three times. The luminescence intensities of MDA-MB-231-luc2 tdTomato tumors were observed under the IVIS system at 16 days. The luminescence intensity of tumors was quantified by the IVIS system using the analysis by the Xenogen Living Image software, Version 4.0. The results were obtained from three groups. “Reprinted/adapted with permission from Ref. [170]. 2019, Wei-Siang Liao”.
Figure 4
Figure 4
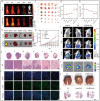
L/P@Ferritin inhibited tumor growth in vivo. (A,B) Fluorescence of L/P@Cy5.5-Ferritin in tumor-bearing mice at different times, and in tumor and organs which were harvested at 6 h. (C,D) L/P@Ferritin effectively inhibited xenograft tumor growth. I, II, III, IV, V, and VI represent the groups of PBS, ferritin, lapatinib, PAB, L/P, and L/P@Ferritin, respectively. (E) HE stain of xenograft tumor; I, II, III, IV, V, and VI represent the groups of PBS, ferritin, lapatinib, PAB, L/P, and L/P@Ferritin, respectively; scale bars: up panel, 2 mm; low panel, 100 μm. (F) Expression of LC3 detected by IF; scale bars represent 50 μm. (G,H) Overgeneration of MDA and depletion of GSH in xenograft tumor treated with L/P@Ferritin. (I,J) Bioluminescence images of MDAMB-231-Luc cells in mice and extracted lungs in control, L/P, and L/P@Ferritin groups, respectively. (K) Numbers of pulmonary metastatic nodules in control, L/P, and L/P@Ferritin groups, respectively. (L) HE stain of the lung in control, L/P, and L/P@Ferritin groups, respectively; scale bars represent 2 mm. ** p < 0.01. “Reprinted/adapted with permission from Ref. [171]. 2022, Xinghan Wu.”
Figure 5
Figure 5
(1) Illustration indicating the mechanism of Rapamycin and paclitaxel nanoparticles in synergistically targeting the PI3K/Akt/mTOR pathway via the suppression of Akt phosphorylation. (2) In vivo anticancer activity of Rapamycin and paclitaxel nanoparticles by targeting the PI3K/Akt/mTOR signaling pathway: (a) Inhibition of tumor growth after the administration of rapamycin nanoparticles (nRAP), paclitaxel nanoparticles (nPTX) and rapamycin-paclitaxel combination nanoparticles (nR/P) to MDA-MB-468 tumors-induced mice (mean ± SEM, n = 5). * Denotes that the results obtained are statistically significant as compared to what was found in the control group (* p < 0.05; ** p < 0.01; ***, p < 0.001). (b) Relative expression of proteins involved in the PI3K/Akt/mTOR pathway as determined by the reverse-phase protein array analysis of tumors excised 24 h after treatment (mean ± SEM; n = 5). * Indicated statistical significance in comparison to control (* q < 0.1; ** q < 0.05; *** q < 0.005). (c) pS6 S235/236 immunohistochemical staining of excised tumors 24 h after administration of nanoparticles. The scale bar represents 20 µm. “Reprinted/adapted with permission from Ref. [175]. 2014, Elvin Blanco.”
Figure 6
Figure 6
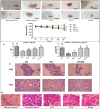
(I) Tumor regression analysis in xenograft model over treatment duration. * Significantly different from normal control (p < 0.05), # Significantly different from disease control (p < 0.05). Scale bar represents 10 mm. (II) (A) Determination of β-interferon release in various treatment groups in a xenograft model in blood and (B) mammary glands; (C) Immunohistochemistry studies for ER, PR, and HER2 in mammary gland sections; (D) Histopathological studies of nanoformulation-treated mammary gland in the xenograft model. * Significantly different from normal control (p < 0.05), # Significantly different from disease control (p < 0.05). Magnification ×100. NC: normal control, DC: disease control, DT-P: disease treated with paclitaxel nanoparticles, DT-D: disease treated with DEAE–Dextran, DT-PD: disease treated with DEAE–Dextran-coated paclitaxel nanoparticles, ER: estrogen, PR: progesterone and HER2 receptors. “Reprinted/adapted with permission from Ref. [177]. 2018, Anita K. Bakrania.”
Figure 7
Figure 7
(I) Schematic illustration depicting the molecular mechanisms of HA-TQ-Np mediated anticancer effect on TNBC cells. (II) Elucidation of the anti-migratory effect of HA-TQ-Nps on TNBC cell lines. (A) The graphical representations of the percent cell migrations of MDA-MB-231 (left panel), MDA-MB-468 (middle panel), and 4T1 (right panel) cells upon treatment with different doses of free TQ and MP-TQ-Nps at 0 and 24 h of incubation. (B) The pictorial (upper panels) along with graphical (lower panel) representations of the bidirectional wound-healing assay, illustrating the rate of migration of MDA-MB-231 (left panel), MDA-MB-468 (middle panel) and 4T1 (right panel) cells upon treatment with different doses of HA-TQ-Nps at 0 and 24 h of incubation. Magnification: 20×. (C) The phase-contrast images (upper panel) and graphical depictions of percentage cell migration (lower panel) evaluated through transwell migration assay for the untreated (control), free TQ-, MP-TQ-Np- and HA-TQ-Np-treated three aforementioned TNBC cell lines at their respective migratory doses for each treatment modality for 24 h. Magnification: 20×. (D) The micrographs of the cellular morphology of untreated and HA-TQ-Np-treated MDA-MB-231 cells were visualized under SEM. The yellow arrows on the control cells point at the multiple lamellipodia seen on the cellular surface. The scale bar is 10 μm. (E) The schematic drawing of the mesenchymal morphology of a migratory cell where the organization of all the actin stress fibers is pointed out. (F) The fluorescent micrographs of both the untreated and HA-TQ-Np-treated MDA-MB-231 cells. The green fluorescence of Alexa Flour 488 (AF488)-conjugated Phalloidin represents actin filaments. The blue fluorescence of DAPI represents viable nuclei. Magnification: 40× and the scale bar is 100 μm. (G) The graphical illustration of the differential percentage of MDA-MB-231 cells with multiple lamellipodia in both the untreated and HA-TQ-Np-treated conditions. Each value is depicted as Mean ± SD; n = 3. ** p < 0.01, and *** p < 0.001. “Reprinted/adapted with permission from Ref. [180]. 2020, Saurav Bhattacharya”.
Figure 8
Figure 8
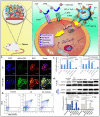
A blockade of CD73 using siRNA-loaded CL NPs functionalized with TAT-HA and loaded with DOX can effectively prevent tumor growth. CL-TAT-HA NPs can deliver DOX and anti-CD73 siRNA to cancer cells and significantly suppress the survival, invasion, proliferation, and migration of cancer cells (Top). The cellular uptakes of TAT-HA-conjugated NPs and non-targeted NPs were examined by confocal microscopy (a) and flow cytometry (b). The impact of siCD73 and DOX-loaded CL-TAT-HA NPs on the CD73 expression in cancer cells was investigated by using qPCR (c) and the western blot (d) (Bottom). * p < 0.1, and ** p < 0.01. “Reprinted/adapted with permission from Ref. [183]. 2021, Armin Mahmoud Salehi Khesht.”
Figure 9
Figure 9
Human endothelial cell ((a) HMVEC and (c) HUVEC) tube formation in conditioned media harvested from MDA-MB-231 cells treated with immunoliposomes. The number of branches was quantified for (b) HMVEC and (d) HUVEC. All scale bars are 200 µm (* p < 0.05, ** p < 0.01, *** p < 0.001). “Reprinted/adapted with permission from Ref. [190]. 2016, Peng Guo.”

References

    1. Marra A., Trapani D., Viale G., Criscitiello C., Curigliano G. Practical classification of triple-negative breast cancer: Intratumoral heterogeneity, mechanisms of drug resistance, and novel therapies. NPJ Breast Cancer. 2020;6:54. doi: 10.1038/s41523-020-00197-2. - DOI - PMC - PubMed
    1. Shohdy K.S., Almeldin D.S., Fekry M.A., Ismail M.A., AboElmaaref N.A., ElSadany E.G., Hamza B.M., El-Shorbagy F.H., Ali A.S., Attia H., et al. Pathological responses and survival outcomes in patients with locally advanced breast cancer after neoadjuvant chemotherapy: A single-institute experience. J. Egypt. Natl. Cancer Inst. 2021;33:39. doi: 10.1186/s43046-021-00096-y. - DOI - PMC - PubMed
    1. Al-Mahmood S., Sapiezynski J., Garbuzenko O.B., Minko T. Metastatic and triple-negative breast cancer: Challenges and treatment options. Drug Deliv. Transl. Res. 2018;8:1483–1507. doi: 10.1007/s13346-018-0551-3. - DOI - PMC - PubMed
    1. Wahba H.A., El-Hadaad H.A. Current approaches in treatment of triple-negative breast cancer. Cancer Biol. Med. 2015;12:106–116. doi: 10.7497/j.issn.2095-3941.2015.0030. - DOI - PMC - PubMed
    1. Won K., Spruck C. Triple-negative breast cancer therapy: Current and future perspectives (Review) Int. J. Oncol. 2020;57:1245–1261. doi: 10.3892/ijo.2020.5135. - DOI - PMC - PubMed