

Sulfated Chinese Yam Polysaccharides Alleviate LPS-Induced Acute Inflammation in Mice through Modulating Intestinal Microbiota
- PMID: 37174310
- PMCID: PMC10178587
- DOI: 10.3390/foods12091772
Sulfated Chinese Yam Polysaccharides Alleviate LPS-Induced Acute Inflammation in Mice through Modulating Intestinal Microbiota
Abstract
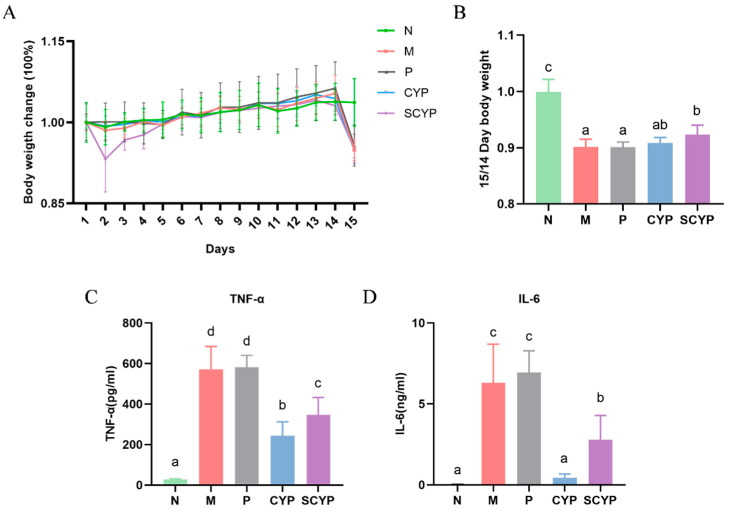
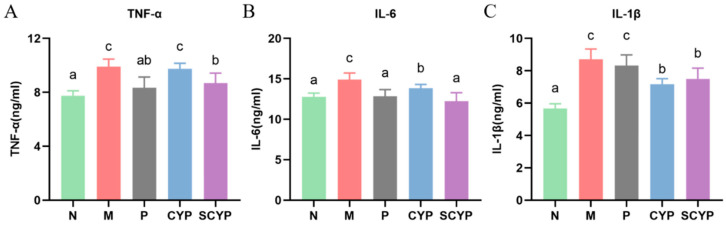
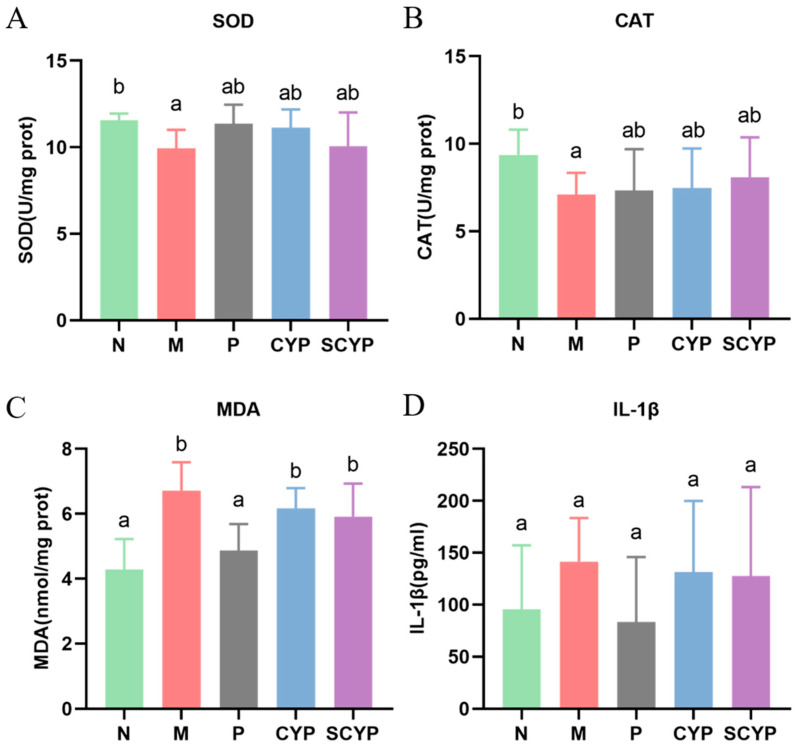
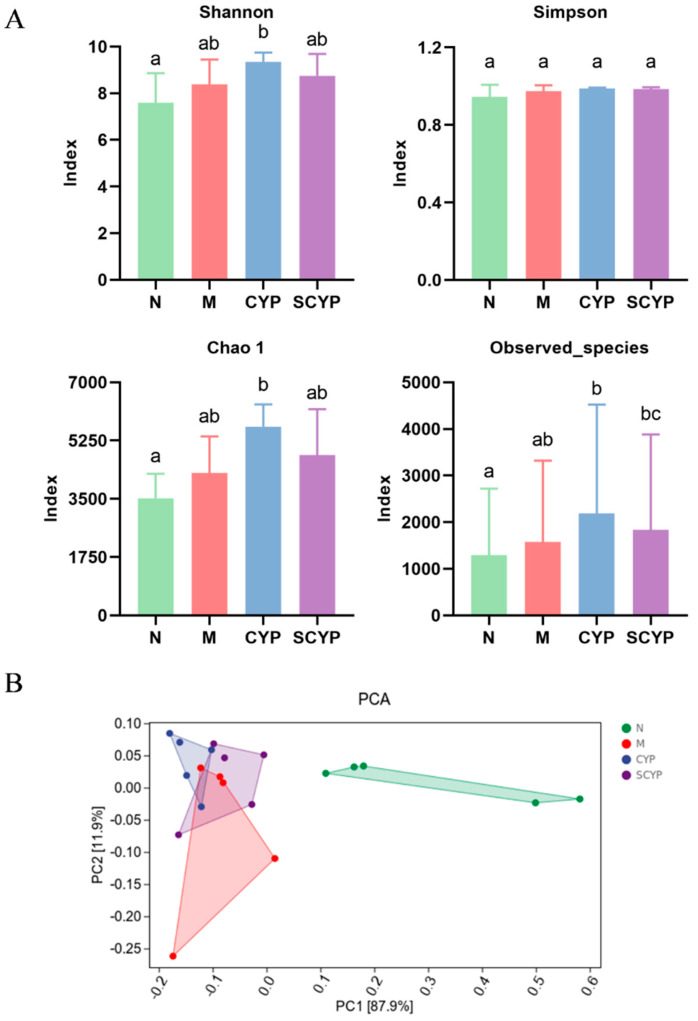
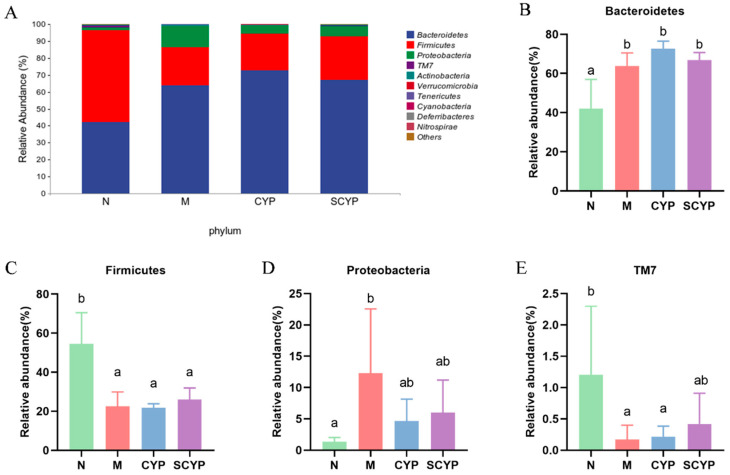
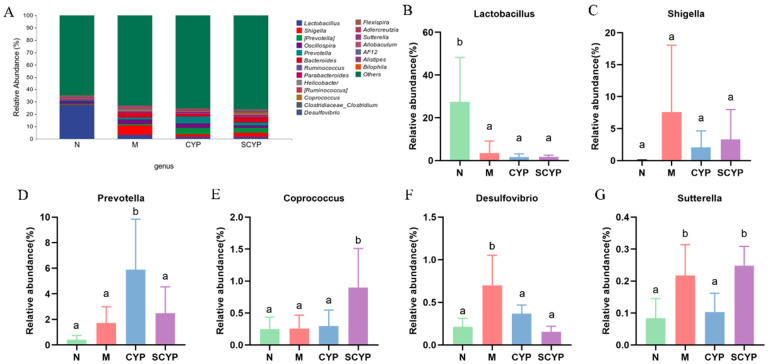
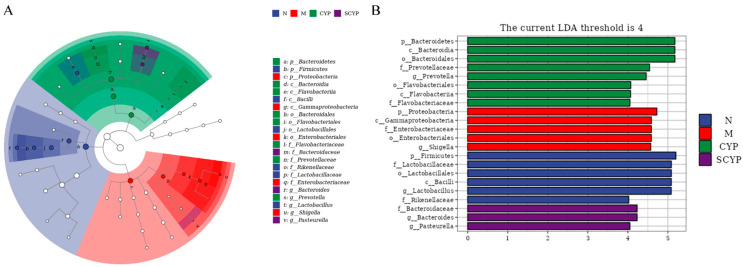
This study aimed to test the preventive anti-inflammatory properties of Chinese yam polysaccharides (CYP) and sulfated Chinese yam polysaccharides (SCYP) on LPS-induced systemic acute inflammation in mice and investigate their mechanisms of action. The results showed that SCYP can efficiently reduce plasma TNF-α and IL-6 levels, exhibiting an obvious anti-inflammation ability. Moreover, SCYP reduced hepatic TNF-α, IL-6, and IL-1β secretion more effectively than CYP, and significantly altered intestinal oxidative stress levels. In addition, a 16S rRNA gene sequencing analysis showed that CYP regulated the gut microbiota by decreasing Desulfovibrio and Sutterella and increasing Prevotella. SCYP changed the gut microbiota by decreasing Desulfovibrio and increasing Coprococcus, which reversed the microbiota dysbiosis caused by LPS. Linear discriminant analysis (LDA) effect size (LEfSe) revealed that treatment with CYP and SCYP can produce more biomarkers of the gut microbiome that can promote the proliferation of polysaccharide-degrading bacteria and facilitate the intestinal de-utilization of polysaccharides. These results suggest that SCYP can differentially regulate intestinal flora, and that they exhibit anti-inflammatory effects, thus providing a new reference to rationalize the exploitation of sulfated yam polysaccharides.
Keywords: LPS; anti-inflammation; gut microbiota; sulfation; yam polysaccharide.
Conflict of interest statement
The authors declare no conflict of interest.
Figures
Similar articles
-
Sulfated modification enhances the modulatory effect of yam polysaccharide on gut microbiota in cyclophosphamide-treated mice.Food Res Int. 2021 Jul;145:110393. doi: 10.1016/j.foodres.2021.110393. Epub 2021 May 14. Food Res Int. 2021. PMID: 34112396
-
Sulfated Chinese yam polysaccharide exert anti-inflammatory potential via MAPK/NF-κB signaling pathways in a co-culture system and LPS-induced acute inflammatory mice model.J Food Sci. 2024 Oct;89(10):6720-6732. doi: 10.1111/1750-3841.17319. Epub 2024 Sep 13. J Food Sci. 2024. PMID: 39269279
-
Preventive effect of quinoa polysaccharides on lipopolysaccharide-induced inflammation in mice through gut microbiota regulation.Int J Biol Macromol. 2025 May;307(Pt 1):141899. doi: 10.1016/j.ijbiomac.2025.141899. Epub 2025 Mar 9. Int J Biol Macromol. 2025. PMID: 40068754
-
Structural characteristics of a mannoglucan isolated from Chinese yam and its treatment effects against gut microbiota dysbiosis and DSS-induced colitis in mice.Carbohydr Polym. 2020 Dec 15;250:116958. doi: 10.1016/j.carbpol.2020.116958. Epub 2020 Aug 20. Carbohydr Polym. 2020. PMID: 33049862
-
Regulatory effects of marine polysaccharides on gut microbiota dysbiosis: A review.Food Chem X. 2022 Sep 9;15:100444. doi: 10.1016/j.fochx.2022.100444. eCollection 2022 Oct 30. Food Chem X. 2022. PMID: 36211733 Free PMC article. Review.
Cited by
-
Distinct Gut Microbiota Profiles in Normal Weight Obesity and Their Association With Cardiometabolic Diseases: Results From Two Independent Cohort Studies.J Cachexia Sarcopenia Muscle. 2025 Feb;16(1):e13644. doi: 10.1002/jcsm.13644. J Cachexia Sarcopenia Muscle. 2025. PMID: 39723699 Free PMC article.
-
Bioactive Polysaccharides Prevent Lipopolysaccharide-Induced Intestinal Inflammation via Immunomodulation, Antioxidant Activity, and Microbiota Regulation.Foods. 2025 Jul 23;14(15):2575. doi: 10.3390/foods14152575. Foods. 2025. PMID: 40807512 Free PMC article.
-
Molecular mechanisms and therapeutic strategies of gut microbiota modulation in Sarcopenia (Review).Oncol Lett. 2024 Dec 17;29(3):104. doi: 10.3892/ol.2024.14850. eCollection 2025 Mar. Oncol Lett. 2024. PMID: 39736924 Free PMC article. Review.
-
Chinese Yam and Its Active Components Regulate the Structure of Gut Microbiota and Indole-like Metabolites in Anaerobic Fermentation In Vitro.Nutrients. 2023 Dec 14;15(24):5112. doi: 10.3390/nu15245112. Nutrients. 2023. PMID: 38140371 Free PMC article.
References
LinkOut - more resources
Full Text Sources
