. 2023 Apr 25;12(9):1249.
doi: 10.3390/cells12091249.

Glycyrrhizic Acid Prevents Paclitaxel-Induced Neuropathy via Inhibition of OATP-Mediated Neuronal Uptake

Affiliations

Glycyrrhizic Acid Prevents Paclitaxel-Induced Neuropathy via Inhibition of OATP-Mediated Neuronal Uptake

Ines Klein et al. Cells. .

Abstract

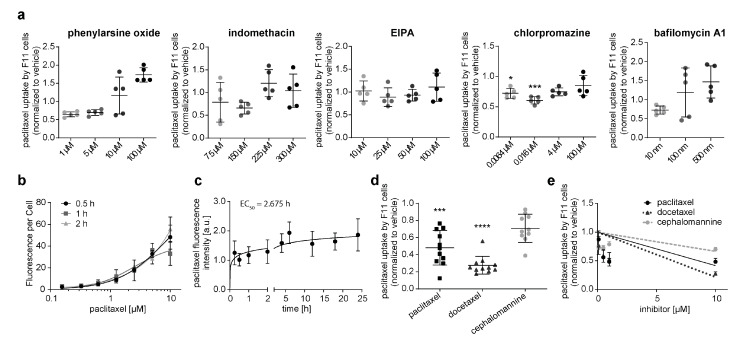
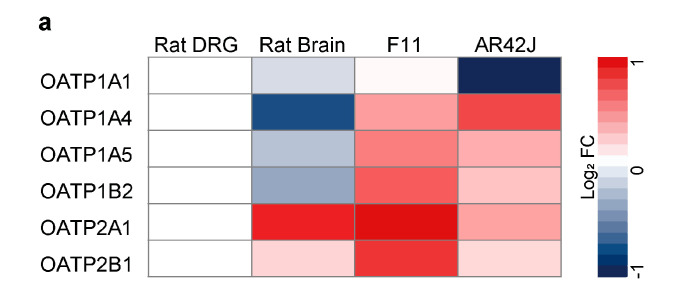
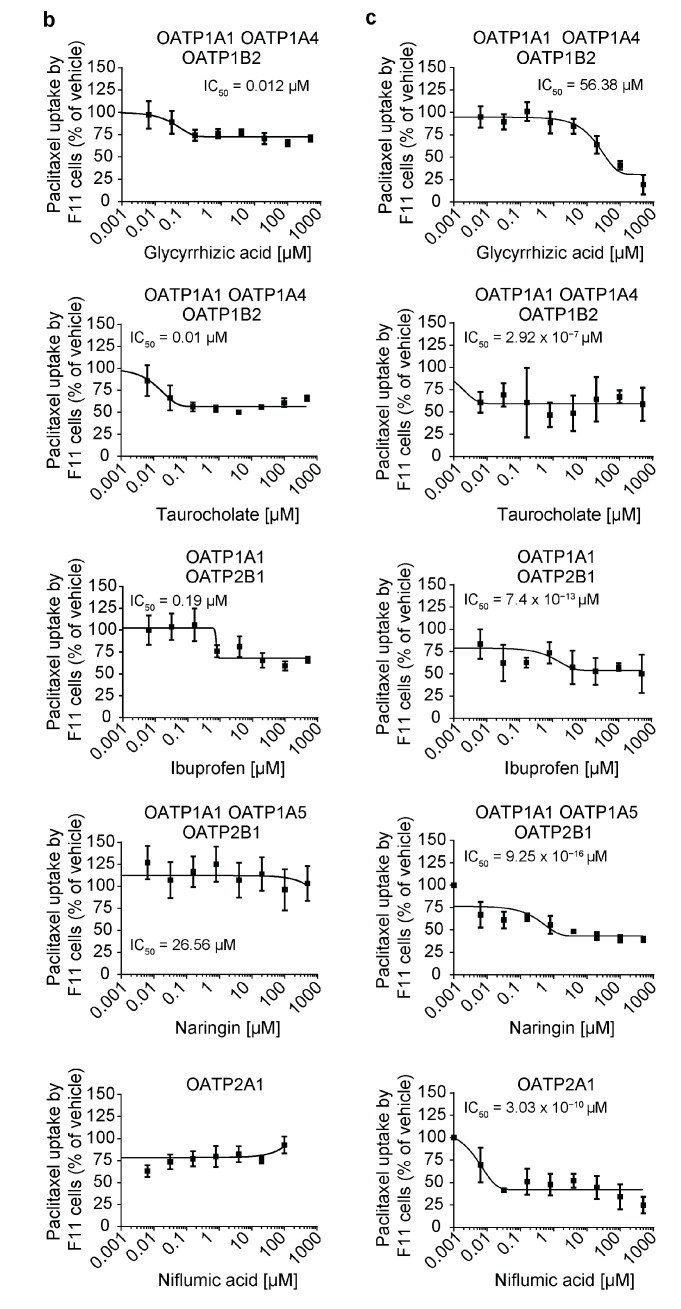
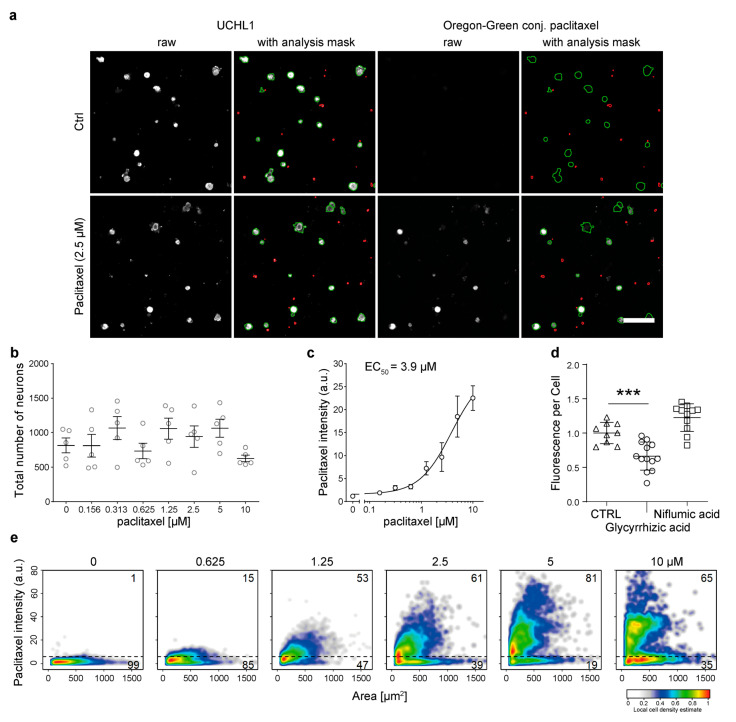
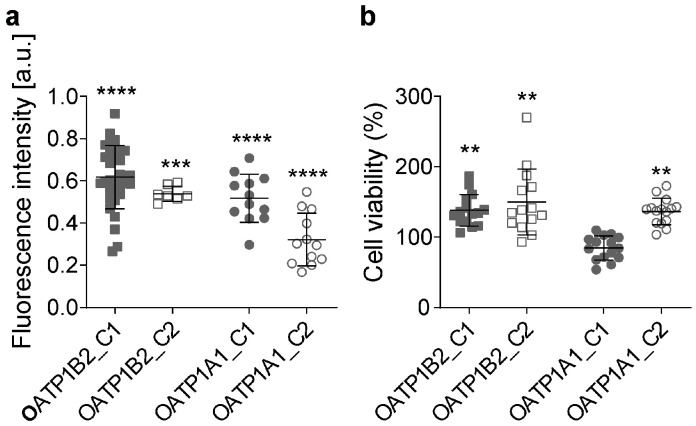
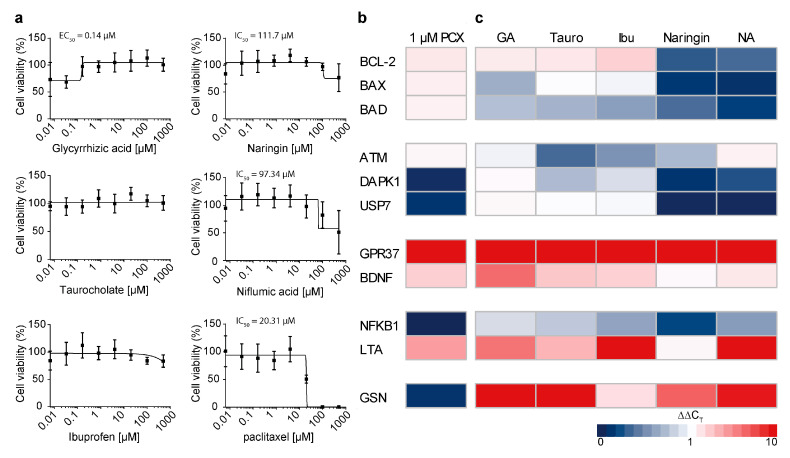
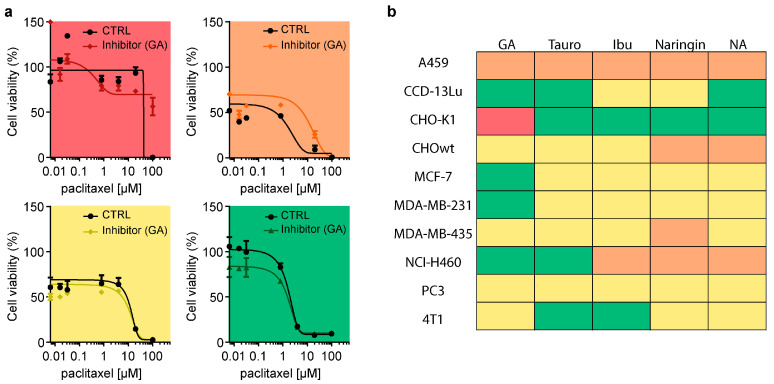
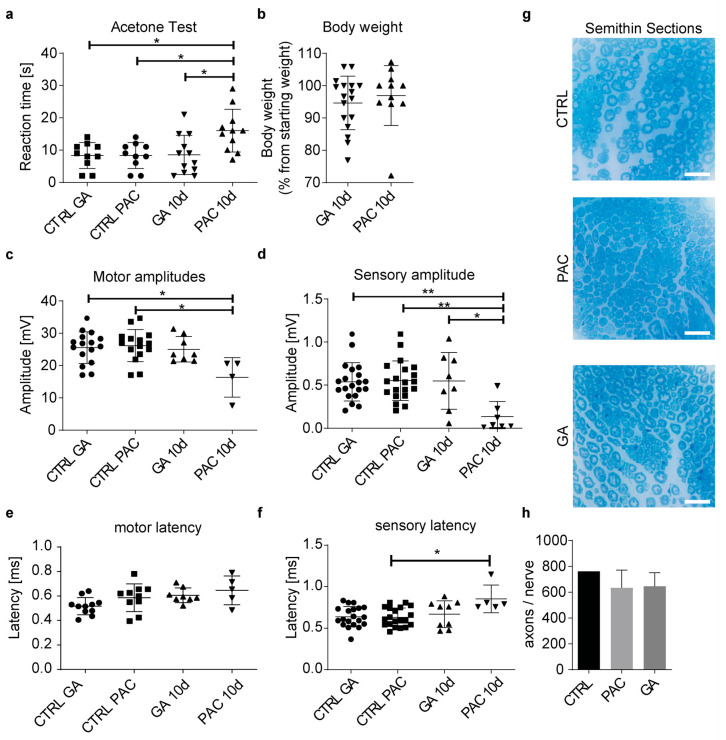
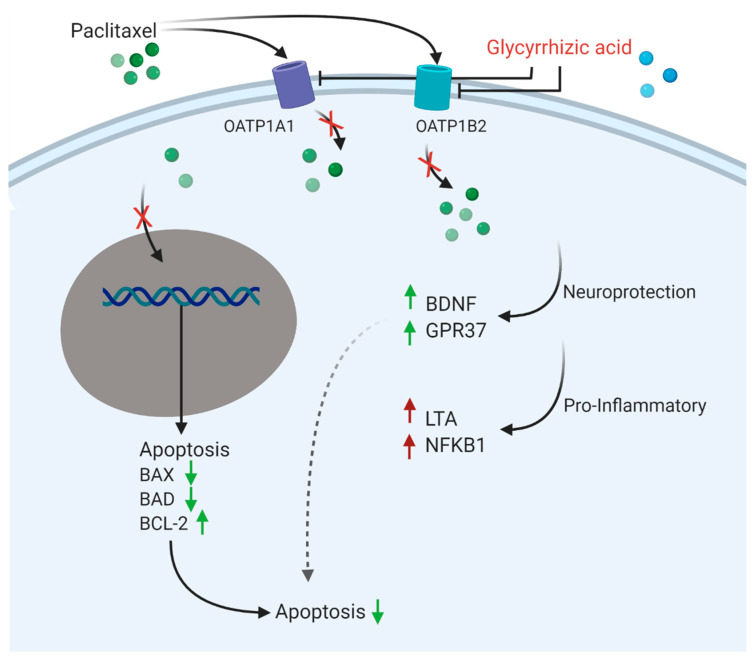
Peripheral neuropathy is a common side effect of cancer treatment with paclitaxel. The mechanisms by which paclitaxel is transported into neurons, which are essential for preventing neuropathy, are not well understood. We studied the uptake mechanisms of paclitaxel into neurons using inhibitors for endocytosis, autophagy, organic anion-transporting polypeptide (OATP) drug transporters, and derivatives of paclitaxel. RT-qPCR was used to investigate the expression levels of OATPs in different neuronal tissues and cell lines. OATP transporters were pharmacologically inhibited or modulated by overexpression and CRISPR/Cas9-knock-out to investigate paclitaxel transport in neurons. Through these experiments, we identified OATP1A1 and OATP1B2 as the primary neuronal transporters for paclitaxel. In vitro inhibition of OATP1A1 and OAT1B2 by glycyrrhizic acid attenuated neurotoxicity, while paclitaxel's antineoplastic effects were sustained in cancer cell lines. In vivo, glycyrrhizic acid prevented paclitaxel-induced toxicity and improved behavioral and electrophysiological measures. This study indicates that a set of OATPs are involved in paclitaxel transport into neurons. The inhibition of OATP1A1 and OATP1B2 holds a promising strategy to prevent paclitaxel-induced peripheral neuropathy.

Keywords: CIPN; OATP; OATP1A1; OATP1B2; drug transport; glycyrrhizic acid; paclitaxel; taxol.


Conflict of interest statement

The authors declare no conflict of interest.

Figures

Figure 1
Figure 1
Kinetics and uptake mechanisms of paclitaxel and its derivatives (docetaxel and cephalomannine) in neuronal F11 cells. (a) F11 neuronal cells were treated for inhibitors of clathrin-mediated endocytosis via chlorpromazine, caveolae-mediated endocytosis via indomethacin, macropinocytosis via ethyl isopropyl amiloride (EIPA), and phagocytosis via bafilomycin A1. Subsequently, cells were treated with fluorescent paclitaxel and fluorescence measured via plate reader. (b) F11 cells were exposed to different concentrations of fluorescent paclitaxel (0.15 µM, 0.3 µM, 0.6 µM, 1.25 µM, 2.5 µM, 5 µM, and 10 µM), and fluorescence was measured via plate reader after 0.5 h, 1.0 h, or 2.0 h (n = 3). (c) Depicted is the uptake of 1 µM of fluorescent paclitaxel into F11 cells over 24 h (n = 12). (d) The neuronal cell line was preincubated for 24 h with paclitaxel, docetaxel, and cephalomannine before exposure to 1 µM of fluorescent paclitaxel (n = 10). (e) An increased concentration of paclitaxel and its derivatives leads to a linear decrease in paclitaxel uptake in F11 cells (n = 6). Graphs depict mean ± SD; n = independent cell culture preparations. Statistical comparison was performed between all groups (Kruskal–Wallis test, Dunn’s multiple comparison test); * p < 0.05, *** p < 0.001, **** p < 0.0001.
Figure 2
Figure 2
Inhibitors of OATP1A1, OATP1B2, and OATP2A1 prevent the transport of paclitaxel in F11 cells. (a) Heatmap depicts expression of different OATPs in rat brain, neuronal cell line F11, and pancreatic cancer cell line AR42J compared with rat DRG (n = 3). (b) F11 cells were treated with glycyrrhizic acid, taurocholate, ibuprofen, naringin, and niflumic acid for 2 h before treating them with 1 µM of fluorescent paclitaxel for 30 min. Cellular fluorescence intensity was measured and compared with vehicle-treated cells via plate reader (n = 8). (c) F11 cells were treated with glycyrrhizic acid, taurocholate, ibuprofen, naringin, and niflumic acid for 1 h before treatment with 3 µM of paclitaxel for 15 min. The paclitaxel amount in the sample was measured by LC-MS/MS, set in ratio with the amount of cell protein in the sample, and compared with vehicle-treated cells (n = 3). n = independent cell culture preparations.
Figure 2
Figure 2
Inhibitors of OATP1A1, OATP1B2, and OATP2A1 prevent the transport of paclitaxel in F11 cells. (a) Heatmap depicts expression of different OATPs in rat brain, neuronal cell line F11, and pancreatic cancer cell line AR42J compared with rat DRG (n = 3). (b) F11 cells were treated with glycyrrhizic acid, taurocholate, ibuprofen, naringin, and niflumic acid for 2 h before treating them with 1 µM of fluorescent paclitaxel for 30 min. Cellular fluorescence intensity was measured and compared with vehicle-treated cells via plate reader (n = 8). (c) F11 cells were treated with glycyrrhizic acid, taurocholate, ibuprofen, naringin, and niflumic acid for 1 h before treatment with 3 µM of paclitaxel for 15 min. The paclitaxel amount in the sample was measured by LC-MS/MS, set in ratio with the amount of cell protein in the sample, and compared with vehicle-treated cells (n = 3). n = independent cell culture preparations.
Figure 3
Figure 3
Overexpression of OATPs increases paclitaxel uptake in transfected F11 cells. Overview of F11 cell line and overexpressing cell lines exposed to 0.78 µM, 3.125 µM, and 12.5 µM of paclitaxel (x-axis) for 30 min. Graphs show paclitaxel amount in ng per µg cell. (a) OATP1A1 overexpressing cell line, (b) OATP1A2 overexpressing cell line, (c) OATP1B1 overexpressing cell line, (d) OATP1B2 overexpressing cell line, and (e) OATP2A1 overexpressing cell line paclitaxel uptake in comparison with F11 cell line paclitaxel uptake. n = 3 independent cell culture preparations. Graphs depict mean ± SD. Statistical comparison was performed between all groups (Kruskal–Wallis test, Dunn’s multiple comparison test); * p < 0.05.
Figure 4
Figure 4
Paclitaxel kinetics in primary sensory neurons and impact of active transport inhibition on paclitaxel uptake. (a) Micrographs of primary sensory neurons in culture were stained for UCHL1 (red) and fluorescence in green thanks to paclitaxel uptake. Masking of cells indicates UCHL1-positive neuron that is paclitaxel negative. (b) Graph depicts mean cell number per well after paclitaxel treatment with increasing concentrations. (c) Graph displays mean paclitaxel intensity after paclitaxel treatment with increasing concentrations. (d) Primary sensory neurons were treated with glycyrrhizic acid and niflumic acid for 2 h before treatment with 1 µM of fluorescent paclitaxel for 30 min. Fluorescence intensity of cells was measured via plate reader and compared with vehicle-treated cells (n = 12). (e) Graphs depict the correlations between paclitaxel-positive cells and UCHL1-positive cells at increasing amounts of paclitaxel concentration. Graphs depict mean ± SD; n = independent cell culture preparations. Statistical comparison was performed between all groups (Kruskal–Wallis test, Dunn’s multiple comparison test); *** p < 0.001.
Figure 5
Figure 5
Influence of OATP1A1 and OATP1B2 knock-out on paclitaxel uptake into F11 cells. (a) OATP1A1-clone1 cell line (OATP1A1_C1), OATP1A1-clone2 cell line (OATP1A1_C2), OATP1B2-clone1 cell line (OATP1B2_C1), and OATP1B2-clone2 cell line (OATP1B2_C2) were treated with 1 µM of fluorescent paclitaxel for 30 min. Fluorescence intensity of cells was measured and compared with vehicle-treated cells (n = 8). (b) Knock-out cells were treated with 1 μM of paclitaxel for 72 h. Cell viability was assessed via MTT assay and compared with vehicle-treated cells (n = 15). Graphs depict mean ± SD; n = independent cell culture preparations. Statistical comparison was performed between all groups (Kruskal–Wallis test, Dunn’s multiple comparison test); ** p < 0.01, *** p < 0.001, **** p < 0.0001.
Figure 6
Figure 6
Prevention of neurotoxicity by OATP inhibition. (a) F11 cells were treated with glycyrrhizic acid, naringin, taurocholate, niflumic acid, and ibuprofen and with 1 µM of paclitaxel for 24 h. Control F11 cells were treated with increasing concentrations of paclitaxel for 24 h. Cell viability was assessed via MTT assay by comparing treated cells with vehicle-treated cells (n = 4). Graphs depict mean ± SD. (b) F11 cells were treated with 1 µM of paclitaxel for 48 h, and the expression of markers was compared with vehicle-treated F11 cells. (c) F11 cells were treated with 1 µM of paclitaxel and drug-transport inhibitors for 48 h, and the expression of markers was compared with F11 cells treated with only 1 µM of paclitaxel (n = 3). Graphs depict mean ± SD; n = independent cell culture preparations.
Figure 7
Figure 7
Viability changes of cancer cells after treatment with OATP inhibitors and paclitaxel. (a) Representative results of MTT cell viability assay. Red (represented with CHO-K1 cell line with glycyrrhizic acid (GA)) indicates complete loss, and orange (A459 cell line with GA) indicates significant loss of antineoplastic properties with inhibitor plus paclitaxel treatment compared with paclitaxel treatment alone. Yellow (MDA-MB-435 cell line with GA) indicates no changes between treatments. Green (MDA-MB-231 cell line with GA) indicates enhanced toxicity to cancer cells with inhibitor plus paclitaxel treatment compared with paclitaxel treatment alone. (b) Cancer cell lines A459, CCD-13Lu, CHO-K1, CHOwt MCF-7, MDA-MB-231, MDA-MB-435, NCI-H460, PC3, and 4T1 were treated with inhibitors, namely glycyrrhizic acid (GA), taurocholate (Tauro), ibuprofen (Ibu), naringin, and niflumic acid (NA), plus increasing concentrations of paclitaxel for 72 h. Cell viability was compared with paclitaxel-treated cells, and the results were indicated as described in (a) in the corresponding color (n = 3). Graphs depict mean ± SD; n = independent cell culture preparations.
Figure 8
Figure 8
Influence of glycyrrhizic acid on paclitaxel-induced peripheral neuropathy in vivo. Animals were treated with paclitaxel (PAC) or glycyrrhizic acid plus paclitaxel (GA) two times, on d0 and d7. Tests were performed on d0 and d11. Control (CTRL) values are d0 values. (a) Behavioral acetone test reveals significantly reduced reaction time in paclitaxel-treated group compared with the GA-plus-paclitaxel-treated group (CTRL GA: n= 10, CTRL PAC: n = 10, GA: n = 12, PAC: n = 12). (b) Animals were weighed daily, and weight was compared to d0. No changes were observed (GA: n = 17, PAC: n = 10). (c) Motor amplitudes conducted at the sciatic nerve show decreased amplitude in the paclitaxel-treated animals compared to control animals (CTRL GA: n= 16, CTRL PAC: n = 15, GA: n = 8, PAC: n = 5). (d) Sensory nerve action potentials were performed at the caudal nerve of the mice. Reaction time amplitudes were significantly reduced in the paclitaxel-treated group compared with the GA-plus-paclitaxel-treated group (CTRL GA: n= 20, CTRL PAC: n = 20, GA: n = 8, PAC: n = 7). (e) Motor latencies between the groups showed no differences (CTRL GA: n= 11, CTRL PAC: n = 10, GA: n = 8, PAC: n = 5). (f) Sensory latency is significantly increased in the paclitaxel treatment group at d10 when compared with the CTRL group (CTRL GA: n= 20, CTRL PAC: n = 20, GA: n = 9, PAC: n = 5). (g) Micrographs depict semithin sections of different treatment groups: CTRL, paclitaxel treatment group, GA treatment group. (h) Axons were counted per examined nerve. Graphs depict mean ± SD; scale bar = 100 µm; n = number of animals. Statistical comparison was performed between all groups (Kruskal–Wallis test, Dunn’s multiple comparison test); * p < 0.05, ** p < 0.01.
Figure 9
Figure 9
Diagram of possible effects of glycyrrhizic acid.

Similar articles

Cited by

References

    1. Park S.B., Kwok J.B., Loy C.T., Friedlander M.L., Lin C.S.-Y., Krishnan A.V., Lewis C.R., Kiernan M.C. Paclitaxel-induced neuropathy: Potential association of MAPT and GSK3B genotypes. BMC Cancer. 2014;14:993. doi: 10.1186/1471-2407-14-993. - DOI - PMC - PubMed
    1. Scripture C.D., Figg W., Sparreboom A. Peripheral Neuropathy Induced by Paclitaxel: Recent Insights and Future Perspectives. Curr. Neuropharmacol. 2006;4:165–172. doi: 10.2174/157015906776359568. - DOI - PMC - PubMed
    1. Ferlini C., Gallo D., Scambia G. New taxanes in development. Expert Opin. Investig. Drugs. 2008;17:335–347. doi: 10.1517/13543784.17.3.335. - DOI - PubMed
    1. Jordan M.A., Wilson L. Microtubules as a target for anticancer drugs. Nat. Rev. Cancer. 2004;4:253–265. doi: 10.1038/nrc1317. - DOI - PubMed
    1. Schiff P.B., Fant J., Horwitz S.B. Promotion of microtubule assembly in vitro by taxol. Nature. 1979;277:665–667. doi: 10.1038/277665a0. - DOI - PubMed

MeSH terms