. 2023 May 5;12(9):1320.
doi: 10.3390/cells12091320.

Poly-L-Lactic Acid Fillers Improved Dermal Collagen Synthesis by Modulating M2 Macrophage Polarization in Aged Animal Skin

Affiliations

Poly-L-Lactic Acid Fillers Improved Dermal Collagen Synthesis by Modulating M2 Macrophage Polarization in Aged Animal Skin

Seyeon Oh et al. Cells. .

Abstract

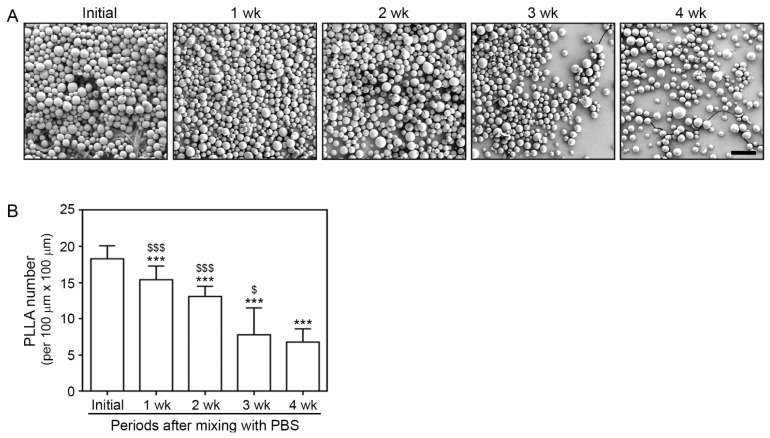
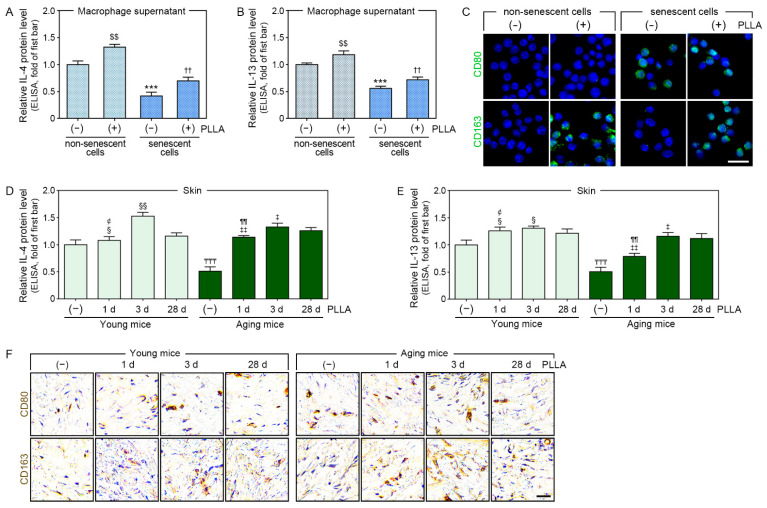
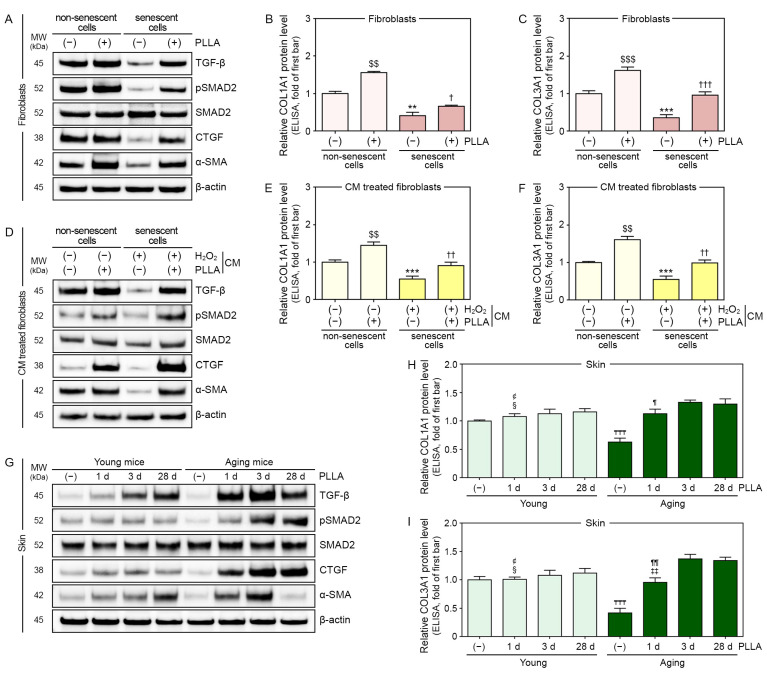
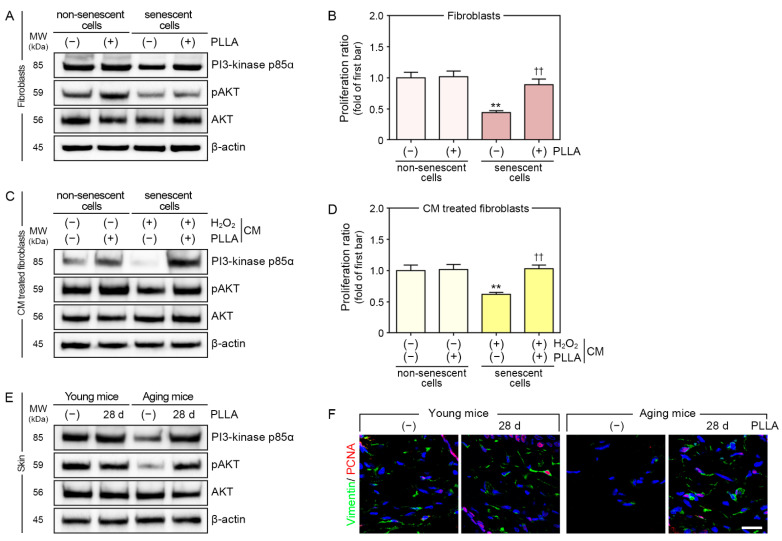
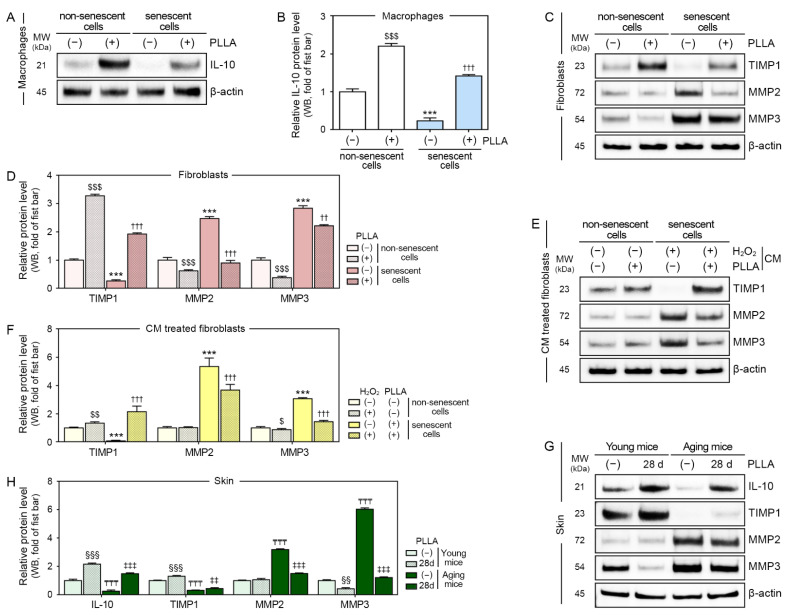
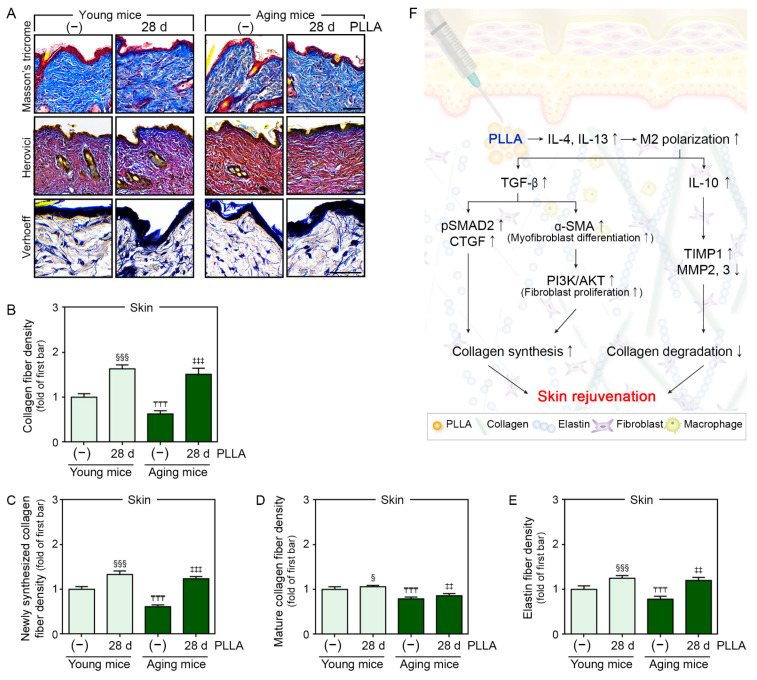
Poly-L-lactic acid (PLLA) fillers correct cutaneous volume loss by stimulating fibroblasts to synthesize collagen and by augmenting the volume. PLLA triggers the macrophage-induced activation of fibroblasts that secrete transforming growth factor-β (TGF-β). However, whether M2 macrophage polarization is involved in PLLA-induced collagen synthesis via fibroblast activation in aged skin is not known. Therefore, we evaluated the effect of PLLA on dermal collagen synthesis via M2 polarization in an H2O2-induced cellular senescence model and aged animal skin. H2O2-treated macrophages had increased expression levels of the M1 marker CD80 and decreased expression levels of the M2 marker CD163, which were reversed by PLLA. The expression levels of interleukin (IL)-4 and IL-13, which mediate M2 polarization, were decreased in H2O2-treated macrophages and increased upon the PLLA treatment. CD163, IL-4, and IL-13 expression levels were decreased in aged skin, but increased after the PLLA treatment. The expression levels of TGF-β, pSMAD2/SMAD2, connective tissue growth factor (CTGF), alpha-smooth muscle actin (α-SMA), collagen type 1A1 (COL1A1), and COL3A1 were also decreased in aged skin, but increased after the PLLA treatment. Moreover, PLLA upregulated phosphatidylinositol 3-kinase p85α (PI3-kinase p85α)/protein kinase B (AKT) signaling, leading to fibroblast proliferation. PLLA decreased the expression of matrix metalloproteinase (MMP) 2 and MMP3, which destroy collagen and elastin fibers in aged skin. The amount of collagen and elastin fibers in aged skin increased following the PLLA treatment. In conclusion, PLLA causes M2 polarization by increasing IL-4 and IL-13 levels and upregulating TGF-β expression and collagen synthesis in aged skin.

Keywords: M2 polarization; collagen and elastin synthesis; poly-L-lactic acid; senescence.


Conflict of interest statement

Kyunghee Byun has received research grants from SACCI Bio Co.

Figures

Figure 1
Figure 1
The number of PLLA decreased over time, whereas its spherical shape was maintained. (A) PLLA morphology was confirmed via SEM. PLLA particles maintained their round shape for four weeks and gradually decreased in number (scale bar = 100 μm). (B) Graph quantifying the number of PLLA per 100 μm × 100 μm area counted from randomly selected areas. Data are presented as the mean ± SD. A different alphabet indicates differences in statistical significance between groups. ***, p < 0.001, first bar vs. the others bar; $ and $$$, p < 0.05 and p < 0.001, fifth bar vs. second, third, and fourth bar. PLLA, poly-L-lactic acid; SD, standard deviation; SEM, scanning electron microscopy; wk, weeks.
Figure 2
Figure 2
PLLA increased IL-4 and IL-13 secretion, leading to M2 polarization. H2O2-induced senescent or non-senescent macrophages were treated with PBS (first or third bar) or PLLA (second or fourth bar). (A,B) IL-4 and IL-13 levels in supernatant (CM) from non-senescent and H2O2-induced senescent macrophages were measured via ELISA. (C) CD80 (M1 marker) and CD163 (M2 marker) levels in H2O2-induced senescent and non-senescent macrophages were analyzed by immunocytochemistry (green: positive signals, blue: nuclei; scale bar = 20 μm). Young or aging mice were injected saline or PLLA and skin samples were collected after 1 (2nd or 6th bar), 3 (3rd or 7th bar), and 28 days (1st, 4th, 5th, or 8th bar). (D,E) IL-4 and IL-13 levels in young and aged skin were measured via ELISA. (F) CD80 and CD163 expression levels in young and aged skin were analyzed via DAB staining (scale bar = 50 μm). Data are presented as the mean ± SD (n = 3/group). $$, p < 0.01, first bar vs. second bar in (A,B); ***, p < 0.001, first bar vs. third bar in (A,B); ††, p < 0.01, third bar vs. fourth bar in (A,B); ₸₸₸, p < 0.001, first bar vs. fifth bar in (D,E); ¢, p < 0.05, third bar vs. second bar in (D,E); § and §§, p < 0.05 and p < 0.01, fourth bar vs. second or third bar in (D,E); ¶¶, p < 0.01, seventh bar vs. sixth bar in (D,E); ‡ and ‡‡, p < 0.05 and p < 0.01, eighth bar vs. sixth or seventh bar in (D,E). CD80, cluster of differentiation 80; CD163, cluster of differentiation 163; CM, conditioned medium; d, days; DAB, 3,3′-diaminobenzidine; ELISA, enzyme-linked immunosorbent assay; H2O2, hydrogen peroxide; IL-4, interleukin-4; IL-13, interleukin-13; PBS, phosphate-buffered saline; PLLA, poly-L-lactic acid; SD, standard deviation.
Figure 3
Figure 3
PLLA induced collagen synthesis in fibroblasts and aged animal skin. H2O2-induced senescent or non-senescent fibroblasts were treated with PBS (first or third bar) or PLLA (second or fourth bar). (A) TGF-β, SMAD2, pSMAD2, CTGF, and α-SMA levels in H2O2-induced senescent and non-senescent fibroblasts were analyzed via Western blotting. (B,C) COL1A1 and COL3A1 levels in H2O2-induced senescent and non-senescent fibroblasts were measured via ELISA. Senescent or non-senescent fibroblasts were treated with CM from macrophages treated with PBS (first bar), PBS/PLLA (second bar), H2O2/PBS (third bar), or H2O2/PLLA (fourth bar). (D) TGF-β, SMAD2, pSMAD2, CTGF, and α-SMA levels in H2O2-induced senescent and non-senescent fibroblasts were analyzed via Western blotting. (E,F) COL1A1 and COL3A1 levels in H2O2-induced senescent and non-senescent fibroblasts were measured via ELISA. Young or aging mice were injected saline or PLLA and skin samples were collected after 1 (2nd or 6th bar), 3 (3rd or 7th bar), and 28 days (1st, 4th, 5th, or 8th bar). (G) TGF-β, SMAD2, pSMAD2, CTGF, and α-SMA levels in young and aged skin were analyzed via Western blotting. (H,I) COL1A1 and COL3A1 levels in young and aged skin were measured via ELISA. Data are presented as the mean ± SD (n = 3/group). $$ and $$$, p < 0.01 and p < 0.001, first bar vs. second bar in (B,C,E,F); ** and ***, p < 0.01 and p < 0.001, first bar vs. third bar in (B,C,E,F); †, †† and †††, p < 0.05, p < 0.01 and p < 0.001, third bar vs. fourth bar in (B,C,E,F); ₸₸₸, p < 0.001, first bar vs. fifth bar in (H,I); ¢, p < 0.05 and p < 0.01, third bar vs. second bar in (H,I); §, p < 0.05, fourth bar vs. second or third bar in (H,I); ¶ and ¶¶, p < 0.05 and p < 0.01, seventh bar vs. sixth bar in (H,I). α-SMA, alpha-smooth muscle actin; β-actin, beta-actin; CM, conditioned medium; COLA1A, collagen type 1A1; COLA3A1, collagen type 3A1; CTGF, connective tissue growth factor; d, days; ELISA, enzyme-linked immunosorbent assay; H2O2, hydrogen peroxide; kDa, kilodalton; MW, molecular weight; PBS, phosphate-buffered saline; PLLA, poly-L-lactic acid; pSMAD2, phosphorylated SMAD2; SD, standard deviation; TGF-β, transforming growth factor-beta.
Figure 4
Figure 4
PLLA induced proliferation in fibroblasts and aged animal skin. H2O2-induced senescent or non-senescent fibroblasts were treated with PBS (first or third bar) or PLLA (second or fourth bar). (A) PI3-kinase p85α, pAKT/AKT levels in H2O2-induced senescent and non-senescent fibroblasts were analyzed via Western blotting. (B) The proliferation ratio for H2O2-induced senescent and non-senescent fibroblasts were measured using the proliferation assay. Senescent or non-senescent fibroblasts were treated with CM from macrophages treated with PBS (first bar), PBS/PLLA (second bar), H2O2/PBS (third bar), or H2O2/PLLA (fourth bar). (C) PI3-kinase p85α, pAKT/AKT levels in H2O2-induced senescent and non-senescent fibroblasts were analyzed via Western blotting. (D) The proliferation ratio for H2O2-induced senescent and non-senescent fibroblasts was measured using the proliferation assay. Young or aging mice were injected saline or PLLA and skin samples were collected after 1 and 28 days. (E) PI3-kinase p85α, pAKT/AKT levels in young and aged skin were analyzed via Western blotting. (F) The expression of vimentin (fibroblast marker, green) and PCNA (proliferation marker, red) in young and aged skin was analyzed using immunofluorescence (nuclei, blue) (scale bar = 50 μm). Data are presented as the mean ± SD (n = 3/group). **, p < 0.01, first bar vs. third bar in (B,D); ††, p < 0.01, third bar vs. fourth bar in (B,D). β-actin, beta-actin; CM, conditioned medium; H2O2, hydrogen peroxide; kDa, kilodalton; MW, molecular weight; pAKT, phosphorylated AKT; PBS, phosphate-buffered saline; PCNA, proliferating cell nuclear antigen; PLLA, poly-L-lactic acid; SD, standard deviation.
Figure 5
Figure 5
PLLA inhibited collagen degradation in senescent fibroblasts and aged animal skin. H2O2-induced senescent or non-senescent macrophages were treated with PBS (first or third bar) or PLLA (second or fourth bar). (A) IL-10 expression in H2O2-induced senescent and non-senescent macrophages were analyzed via Western blotting. (B) Graph quantifying the data in (A). H2O2-induced senescent or non-senescent fibroblasts were treated with PBS (first or third bar) or PLLA (second or fourth bar). (C) TIMP1, MMP2, and MMP3 levels in H2O2-induced senescent and non-senescent fibroblasts were analyzed via Western blotting. (D) Graph quantifying the data in (C). Senescent or non-senescent fibroblasts were treated with CM from macrophages treated with PBS (first bar), PBS/PLLA (second bar), H2O2/PBS (third bar), or H2O2/PLLA (fourth bar). (E) TIMP1, MMP2, and MMP3 levels in H2O2-induced senescent and non-senescent fibroblasts were analyzed via Western blotting. (F) Graph quantifying the data in (E). Young or aging mice were injected saline or PLLA and skin samples were collected after 1 (first or third bar) and 28 days (second or fourth bar). (G) IL-10, TIMP1, MMP2, and MMP3 levels in young and aged skin were analyzed via Western blotting. (H) Graph quantifying the data in (G). Data are presented as the mean ± SD (n = 3/group). $, $$ and $$$, p < 0.05, p < 0.01 and p < 0.001, first bar vs. second bar in (B,D,F); ***, p < 0.001, first bar vs. third bar in (B,D,F); †† and †††, p < 0.01 and p < 0.001, third bar vs. fourth bar in (B,D,F); §§ and §§§, p < 0.01 and p < 0.001, first bar vs. second bar in (H); ₸₸₸, p < 0.001, first bar vs. third bar in (H); ‡‡, ‡‡‡, p < 0.01, and p < 0.001 third bar vs. fourth bar in (H). β-actin, beta-actin; CM, conditioned medium; H2O2, hydrogen peroxide; IL-10, interleukin-10; kDa, kilodalton; MMP2, matrix metalloproteinase 2; MMP3, matrix metalloproteinase 3; MW, molecular weight; PBS, phosphate-buffered saline; PLLA, poly-L-lactic acid; SD, standard deviation; TIMP1, tissue inhibitor of metalloproteinase 1; WB, Western blotting.
Figure 6
Figure 6
PLLA increased new collagen and elastin fibers. Young or aging mice were injected with saline or PLLA, and skin samples were collected after 1 (first or third bar) and 28 days (second or fourth bar). (A) Masson’s trichrome, Herovici’s, and Verhoeff’s staining of young and aged skin (scale bar = 50 µm). (BE) Quantification of the data shown in (A). The densities of collagen fibers (B), newly synthesized collagen fibers (C), mature collagen fibers (D), and elastic fibers (E) decreased in aged skin compared to those in young skin and increased in both skin types following PLLA treatment. Data are presented as the mean ± SD (n = 3/group). § and §§§, p < 0.05 and p < 0.001, first bar vs. second bar; ₸₸₸, p < 0.001, first bar vs. third bar; ‡‡, ‡‡‡, p < 0.01, and p < 0.001 third bar vs. fourth bar. (F) Summary of the study. PLLA, poly-L-lactic acid; SD, standard deviation.

References

    1. Sadick N.S., Manhas-Bhutani S., Krueger N. A novel approach to structural facial volume replacement. Aesthetic Plast. Surg. 2013;37:266–276. doi: 10.1007/s00266-012-0052-6. - DOI - PubMed
    1. Johl S.S., Burgett R.A. Dermal filler agents: A practical review. Curr. Opin. Ophthalmol. 2006;7:471–479. doi: 10.1097/01.icu.0000243021.20499.4b. - DOI - PubMed
    1. Sánchez-Carpintero I., Candelas D., Ruiz-Rodríguez R. Dermal fillers: Types, indications, and complications. Actas Dermosifiliogr. 2010;101:381–393. doi: 10.1016/j.ad.2010.01.004. - DOI - PubMed
    1. Kruglikov I.L., Wollina U. Soft tissue fillers as non-specific modulators of adipogenesis: Change of the paradigm? Exp. Dermatol. 2015;24:912–915. doi: 10.1111/exd.12852. - DOI - PubMed
    1. Wise J.B., Greco T. Injectable treatments for the aging face. Facial Plast. Surg. 2006;22:140–146. doi: 10.1055/s-2006-947720. - DOI - PubMed

Publication types

MeSH terms