. 2023 May 7;12(9):1336.
doi: 10.3390/cells12091336.

The Pesticide Chlordecone Promotes Parkinsonism-like Neurodegeneration with Tau Lesions in Midbrain Cultures and C. elegans Worms

Affiliations

The Pesticide Chlordecone Promotes Parkinsonism-like Neurodegeneration with Tau Lesions in Midbrain Cultures and C. elegans Worms

Valeria Parrales-Macias et al. Cells. .

Abstract

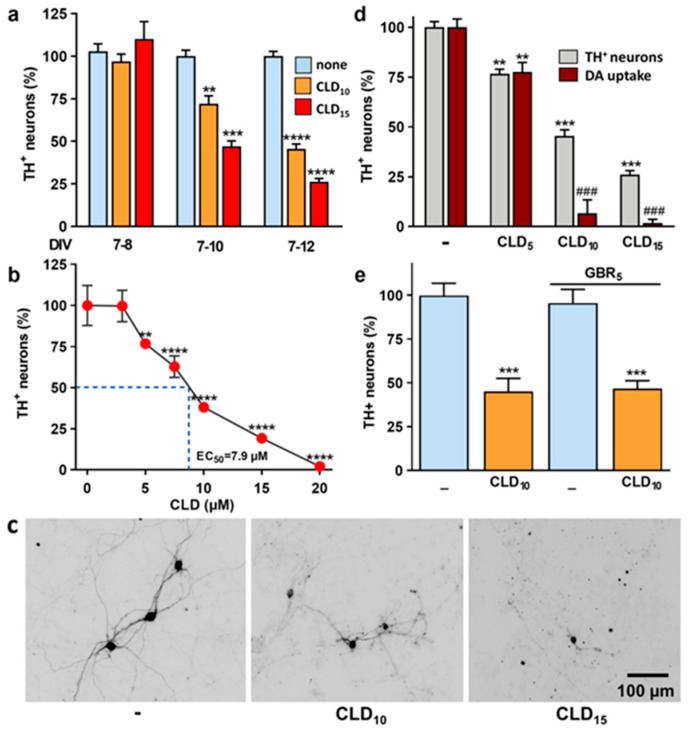
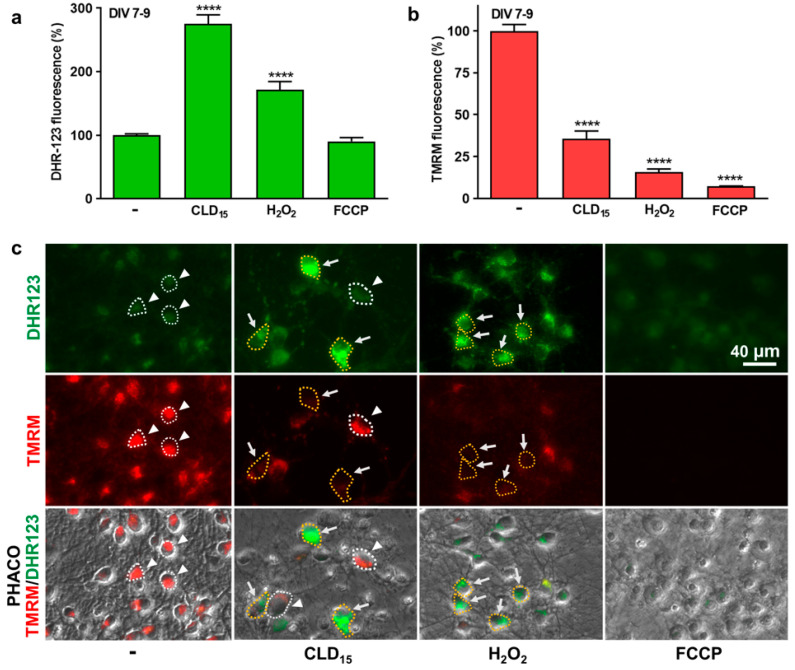
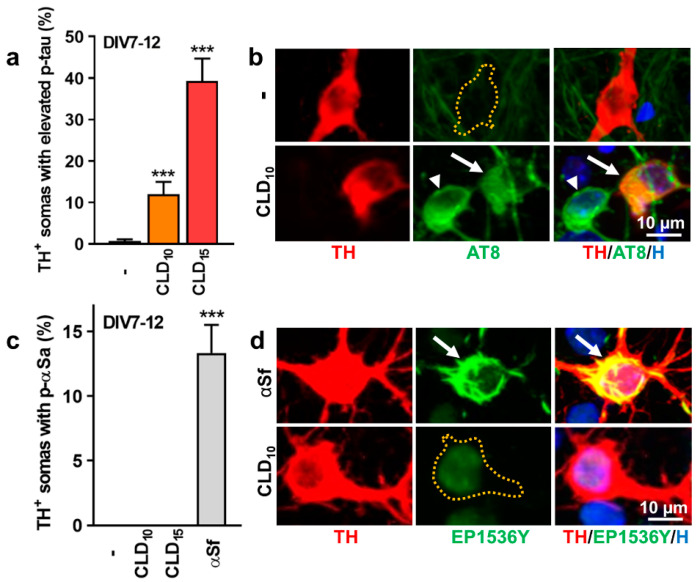
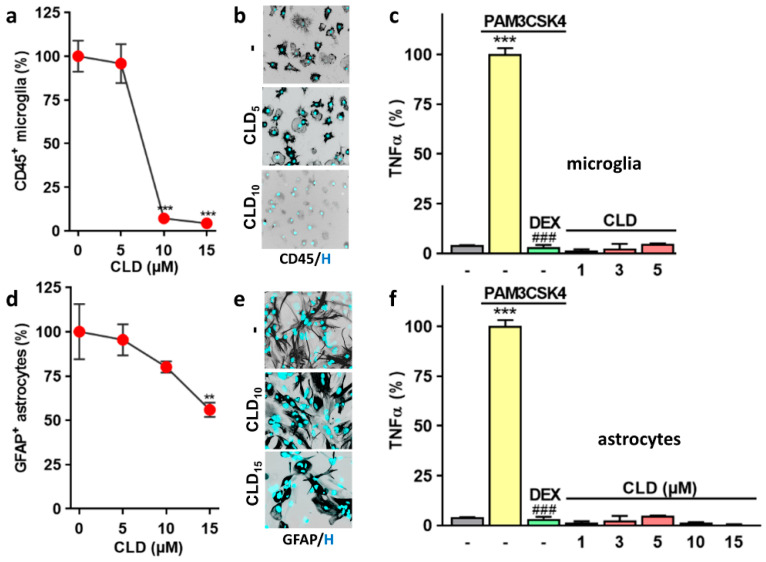
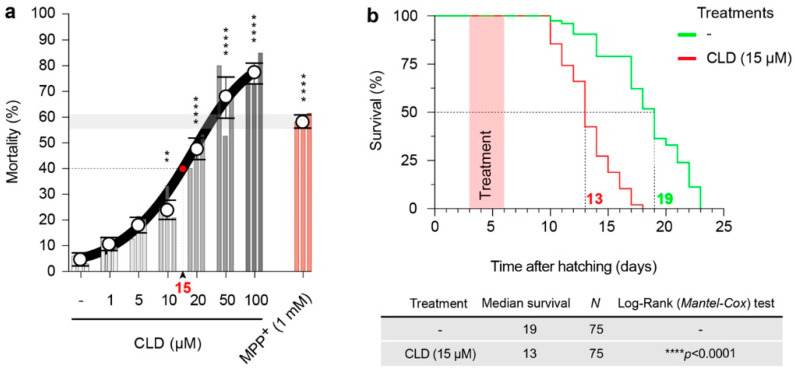
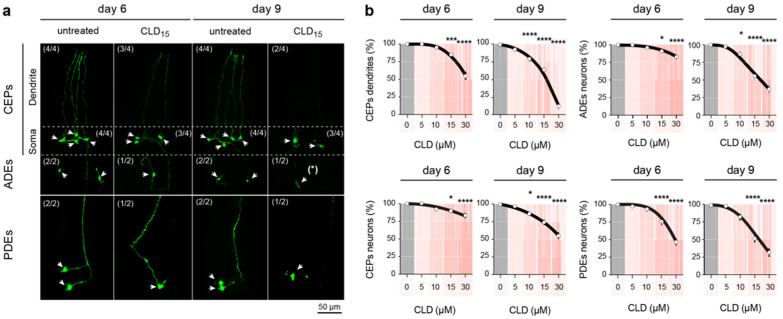
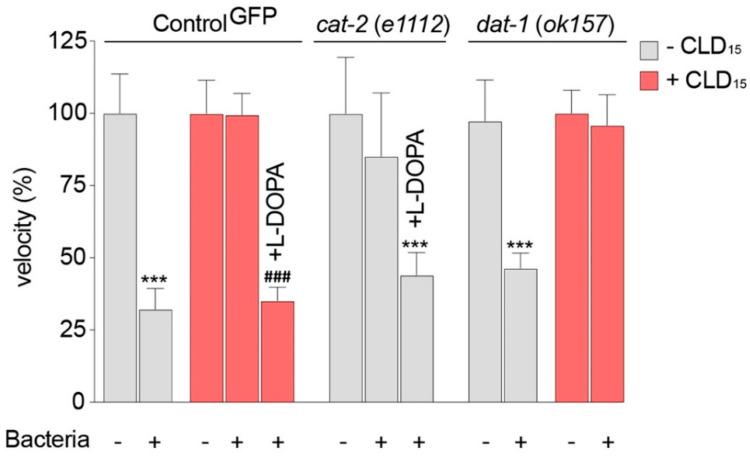
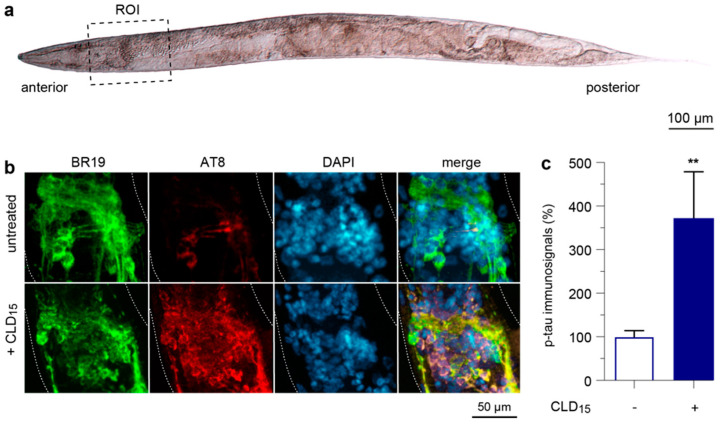
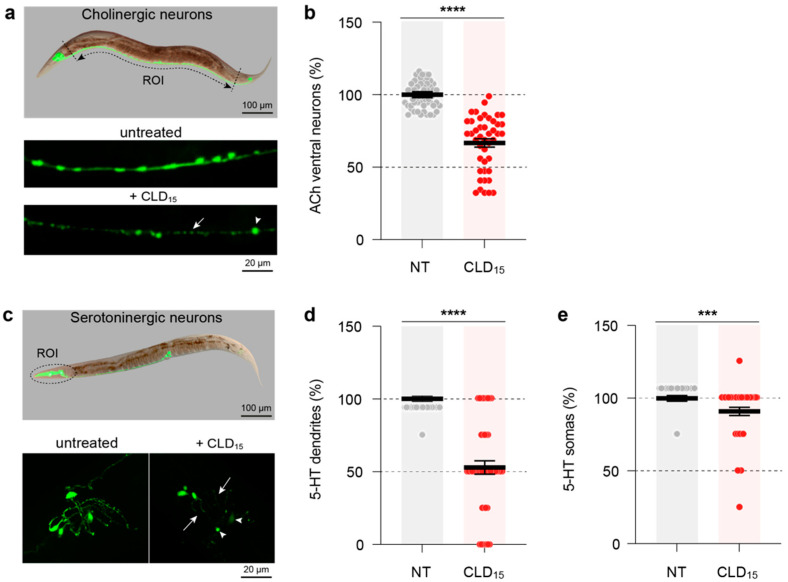
Chlordecone (CLD) is an organochlorine pesticide (OCP) that is currently banned but still contaminates ecosystems in the French Caribbean. Because OCPs are known to increase the risk of Parkinson's disease (PD), we tested whether chronic low-level intoxication with CLD could reproduce certain key characteristics of Parkinsonism-like neurodegeneration. For that, we used culture systems of mouse midbrain dopamine (DA) neurons and glial cells, together with the nematode C. elegans as an in vivo model organism. We established that CLD kills cultured DA neurons in a concentration- and time-dependent manner while exerting no direct proinflammatory effects on glial cells. DA cell loss was not impacted by the degree of maturation of the culture. The use of fluorogenic probes revealed that CLD neurotoxicity was the consequence of oxidative stress-mediated insults and mitochondrial disturbances. In C. elegans worms, CLD exposure caused a progressive loss of DA neurons associated with locomotor deficits secondary to alterations in food perception. L-DOPA, a molecule used for PD treatment, corrected these deficits. Cholinergic and serotoninergic neuronal cells were also affected by CLD in C. elegans, although to a lesser extent than DA neurons. Noticeably, CLD also promoted the phosphorylation of the aggregation-prone protein tau (but not of α-synuclein) both in midbrain cell cultures and in a transgenic C. elegans strain expressing a human form of tau in neurons. In summary, our data suggest that CLD is more likely to promote atypical forms of Parkinsonism characterized by tau pathology than classical synucleinopathy-associated PD.

Keywords: Parkinsonism; cell culture model; chlordecone; dopamine neurons; neurodegeneration; tauopathy.


Conflict of interest statement

The authors declare no conflict of interest.

Figures

Figure 1
Figure 1
Characterization of CLD neurotoxic effects on midbrain-cultured DA neurons. (a) Counts of TH+ neurons in midbrain cultures exposed to 10 and 15 µM of CLD for 1, 3 and 5 days. Data are means ± SEMs (n = 6). ** p < 0.01, *** p < 0.001, **** p < 0.0001 vs. untreated corresponding controls. One-way ANOVA followed by Dunnett’s test. (b) Counts of TH+ neurons in midbrain cultures exposed to increasing concentrations of CLD (3–20 µM) for 5 consecutive days. Data are means ± SEMs (n = 6). ** p < 0.01, **** p < 0.0001 vs. untreated controls. One-way ANOVA followed by Dunnett’s test. (c) Illustration of the effects of a 5-day treatment with 10 and 15 µM of CLD on the number of TH+ cells and their morphology. (d) Comparison of the impact of CLD (5, 10, 15 µM) treatment on TH+ cell numbers and DA uptake. Data are means ± SEMs (n = 6). ** p < 0.01, *** p < 0.001 vs. corresponding controls. ### p < 0.001 vs. TH+ cell numbers at the same concentration of CLD. One-way ANOVA followed by SNK test. (e) Impact of the DA uptake inhibitor GBR12909 (5 µM) on TH+ cell numbers in cultures treated or not treated with 10 µM of CLD. Data are means ± SEMs (n = 6). *** p < 0.001 vs. untreated control cultures. One-way ANOVA followed by Dunnett’s test.
Figure 2
Figure 2
CLD-mediated ROS production correlates with a drop in ΔΨm in cultured midbrain neurons. (a) Midbrain cultures exposed or not exposed to 15 µM of CLD between DIV 7 and 9 and then processed for ROS measurement with the fluorescent probe DHR-123. ROS measurements were also performed in sister cultures acutely exposed to 250 µM of H2O2 or 1 µM of FCCP. Data are means ± SEMs (n = 3). **** p < 0.0001 vs. untreated control cultures. One-way ANOVA followed by Dunnett’s test. (b) Cultures exposed or not to 10 µM of CLD between DIV 7-9 and then processed for ΔΨm measurements using TMRM. Changes in mitochondrial membrane potential were also evaluated in sister cultures acutely exposed to 250 µM of H2O2 or 1 µM of FCCP. Data are means ± SEMs (n = 3). **** p < 0.0001 vs. untreated control cultures. One-way ANOVA followed by Dunnett’s test. (c) Concomitant changes in ROS production (green; upper panel) and ΔΨm (red; middle panel) within the same visual fields. The lower panel provides a combined illustration of the two fluorescent signals merged with the corresponding phase contrast (PHACO) image. White arrows point to some neuronal cells in which the elevation of ROS levels correlates with a drop in ΔΨm. Corresponding cell bodies are surrounded by a yellow dotted line. White arrowheads point to some neuronal cells in which ROS production remains low when ΔΨm is at control levels. Corresponding cell bodies are surrounded by a white dotted line.
Figure 3
Figure 3
Impact of CLD exposure on p-tau or p-αS expression in midbrain DA neurons. (a) Percentage of TH+ somas with increased expression of p-tau (AT8 immunosignal) in midbrain cultures treated from DIV 7 to 12 with 10 or 15 µM of CLD. Data are means ± SEMs (n = 6). *** p < 0.001 vs. untreated control cultures. One-way ANOVA followed by Dunnett’s test. (b) Representative illustration showing an increase in the p-tau immunosignal in a TH+ neuron (white arrow) of a midbrain culture exposed between DIV 7 and 12 to 10 µM of CLD. Note that the AT8 immunosignal is also elevated in another neuron (white arrowhead) that does not express TH. (c) Percentage of TH+ somas with increased expression of p-αS (EP1536Y immunosignal) in midbrain cultures treated between DIV 7 and 12 with 10 or 15 µM of CLD. Positive controls were exposed to 7 µg/mL of αSf during the same time period. Data are means ± SEM (n = 6). *** p < 0.001 vs. untreated control cultures. One-way ANOVA followed by Dunnett’s test. (d) Representative illustration showing that the p-αS immunosignal is not increased in an individual TH+ neuron exposed to 10 µM of CLD between DIV 7 and 12, whereas a strong increase in the signal is observed in a TH+ neuron from a sister culture exposed to 7 µg/mL of αSf during the same time period. In (b,d), yellow dotted lines represent virtual boundaries of TH+ somas without p-tau or p-αS immunosignals, respectively.
Figure 4
Figure 4
Response of glial cells to CLD intoxication. (a) Survival of cultured CD45+ microglial cells exposed to CLD (5–15 µM) for 24 h. Data are means ± SEMs (n = 6). *** p < 0.01 vs. control cultures. One-way ANOVA followed by Dunnett’s test. (b) Illustration showing the impact of 24 h of treatment with 5 and 10 µM of CLD on CD45+ microglial cells. (c) TNFα secretion in cultured microglial cells exposed for 24 h to CLD (1–5 µM) or the reference inflammogen PAMCSK4 (0.1 µg/mL) in the presence or absence of the immunosuppressive drug DEX (2.5 µM). Data are means ± SEMs (n = 6). *** p < 0.01 vs. untreated control cultures. ### p < 0.001 vs. PAM3CSK4-treated cultures. One-way ANOVA followed by SNK test. (d) Survival of cultured GFAP+ astrocytes exposed to CLD (5–15 µM) for 24 h. Data are means ± SEMs (n = 6). ** p < 0.01 vs. control cultures. One-way ANOVA followed by Dunnett’s test. (e) Illustration showing the impact of 24 h of treatment with 10 and 15 µM of CLD on cultured GFAP+ astrocytes. (f) TNFα secretion in cultured astrocytes exposed for 24 h to CLD (1–15 µM) or to the reference inflammogen PAMCSK4 (0.1 µg/mL) with or without the immunosuppressive drug DEX (2.5 µM). Data are means ± SEMs (n = 6). *** p < 0.01 vs. untreated control cultures. ### p < 0.001 vs. PAM3CSK4-treated cultures. One-way ANOVA followed by SNK test. In (b,e), the nuclei are counterstained with Hoechst 33,342 (H; blue).
Figure 5
Figure 5
General toxicity of CLD toward C. elegans worms. (a) Synchronized young adult worms (controlGFP) were chronically treated with CLD at various concentrations (0, 1, 5, 10, 20, 50 and 100 µM) for 3 days at 20 °C. The proportion of live worms was assessed using a stereomicroscope to manually quantify the worms in good health that responded to a mechanical stimulus. Data are means ± SEM (n = 50 worms per condition and per experiment with three independent experiments). ** p < 0.01 and **** p < 0.001 vs. untreated worms. One-way ANOVA followed by Dunnett’s test. A working concentration of 15 µM, inducing a mortality of approximately 40%, was most commonly used for the neurotoxicity studies. In comparison, a concentration of 1 mM of MPP+ used to model DA cell loss in C. elegans worms produced a mortality rate of 60% under the present conditions. (b) Lifespan assays were carried out with L1 larvae-stage transgenic worms cultured at 20 °C on NGM Petri dishes containing E. coli OP50, and CLD treatment was performed between day 3 and day 6 after the beginning of the assay. Upper panel: Kaplan-Meier curves showing the longevity of worms treated transiently or not treated with CLD (15 µM) for 3 days as described before and then maintained under control conditions until the indicated time. Median survival times are indicated for groups treated (red) or not treated (green) with CLD. Lower panel: Table indicating the median survival time for each experimental condition with statistical analysis. Data are means ± SEM (n = 25 worms per experiment with three independent experiments performed by an investigator blind to the treatment conditions).
Figure 6
Figure 6
CLD-induced neurodegeneration of DA neurons in C. elegans worms. (a) Synchronized young adult C. elegans expressing the GFP reporter protein in DA neurons (controlGFP) were incubated with or without CLD for 3 (day 6) or 6 days (day 9), and living worms were recovered, fixed and mounted for analysis by fluorescence microscopy (x63 objective). Representative images showing the impact of treatment with 15 µM of CLD on the three classes of DA neurons (white arrowheads) located in the head region (CEPs, n = 4 and ADEs, n = 2) and in the tail region (PDEs, n = 2). (b) Quantification of the number of CEP, ADE and PDE DA neurons and CEP dendrites after exposure to various concentrations of CLD (5, 10, 15 and 30 µM). Data are means ± SEMs (n = 50 worms per experiment with three independent experiments performed by an investigator blind to the treatment conditions). * p < 0.05, *** p < 0.001, **** p < 0.01 vs. untreated worms. One-way ANOVA followed by Dunnett’s test.
Figure 7
Figure 7
Basal slowing response of C. elegans worms exposed to CLD. Synchronized young adult worms from the controlGFP and dat1 (ok157) mutant strains were exposed for 3 days to 15 µM of CLD and then placed on a solid medium supplemented or not with food (bacteria) to evaluate the changes in velocity between these two conditions. When specified, L-DOPA (1 mM) was also added to the plates 3 h before assessment. Velocity was also evaluated in cat2 (e1112) mutant animals exposed or not exposed to L-DOPA (1 mM). Data values are expressed as means ± SEMs (n = 30 worms per condition and experiment, with three independent experiments performed by an investigator blind to the experimental conditions). *** p < 0.001, vs. corresponding line, off food. ### p < 0.001, vs. the corresponding line, off food treated with CLD. One-way ANOVA followed by Dunnett’s test.
Figure 8
Figure 8
Chronic CLD exposure promotes p-tau expression in transgenic C. elegans worms. (a) Young adult C. elegans worm imaged with Nomarski optics. The black dashed rectangle defines the region of interest (ROI). (b) Synchronized young adult worms were treated or not treated with CLD for 3 days, and the living worms were recovered for fixation before being processed for the immunodetection of total tau (green) or p-tau (red) using BR19 and AT8 antibodies, respectively. Samples were then mounted for fluorescence imaging by confocal microscopy (x63 objective). Note that the immunosignal of p-tau (but not total tau) was dramatically increased by CLD within the anterior nerve ring. (c) Quantitative analysis of the p-tau immunosignal within the ROI. Data are means ± SEM (n = 50 worms per experiment, with three independent experiments performed by an investigator blind to the experimental conditions). ** p < 0.01 vs. untreated worms. Unpaired t-test.
Figure 9
Figure 9
C. elegans worms chronically exposed to CLD develop lesions in nondopaminergic neurotransmitter systems. Synchronized young adult worms expressing the GFP reporter protein in cholinergic or serotoninergic neurons were exposed for 3 days to 15 µM of CLD, and living worms were recovered for fixation before being processed for imaging by fluorescence microscopy. (a) Upper panel: Whole-body Nomarski/fluorescence image of a young adult C. elegans showing the entire cholinergic neurotransmitter system of the worm. Lower panel: Fluorescence images showing cholinergic neurons from the median ventral cord of C. elegans worms treated or not with CLD. Note the substantial loss of cholinergic cell bodies (white arrowhead points to a surviving neuron) within the same segment of the ventral cord (white arrow). (b) Number of ventral cord cholinergic neurons in C. elegans worms treated or not treated with 15 µM of CLD. (c) Upper panel: Whole-body Nomarski/fluorescence image of a young adult C. elegans showing the entire serotoninergic neurotransmitter system of the worm. The ROI points to head serotoninergic neurons. Lower panel: High magnification fluorescence images showing serotoninergic neurons (white arrowheads) in the head of C. elegans worms treated or not treated with 15 µM of CLD. Note that there is a substantial loss of serotoninergic dendrites (white arrows) in the ROI. (d) Number of serotoninergic dendrites in the head of C. elegans worms treated or not with 15 µM of CLD. (e) Number of serotoninergic neurons in the head of C. elegans worms treated or not treated with 15 µM of CLD. Data are means ± SEM (n = 50 worms per experiment with three independent experiments performed by an investigator blind to the treatment conditions). *** p < 0.001 and **** p < 0.0001 vs. untreated worms. Unpaired t-test.

References

    1. Multigner L., Kadhel P., Rouget F., Blanchet P., Cordier S. Chlordecone Exposure and Adverse Effects in French West Indies Populations. Environ. Sci. Pollut. Res. Int. 2016;23:3–8. doi: 10.1007/s11356-015-4621-5. - DOI - PMC - PubMed
    1. Dereumeaux C., Saoudi A., Guldner L., Pecheux M., Chesneau J., Thomé J.-P., Ledrans M., Tertre A.L., Denys S., Fillol C. Chlordecone and Organochlorine Compound Levels in the French West Indies Population in 2013–2014. Environ. Sci. Pollut. Res. Int. 2020;27:41033–41045. doi: 10.1007/s11356-019-07181-9. - DOI - PubMed
    1. Boucher O., Simard M.-N., Muckle G., Rouget F., Kadhel P., Bataille H., Chajès V., Dallaire R., Monfort C., Thomé J.-P., et al. Exposure to an Organochlorine Pesticide (Chlordecone) and Development of 18-Month-Old Infants. Neurotoxicology. 2013;35:162–168. doi: 10.1016/j.neuro.2013.01.007. - DOI - PubMed
    1. Dallaire R., Muckle G., Rouget F., Kadhel P., Bataille H., Guldner L., Seurin S., Chajès V., Monfort C., Boucher O., et al. Cognitive, Visual, and Motor Development of 7-Month-Old Guadeloupean Infants Exposed to Chlordecone. Environ. Res. 2012;118:79–85. doi: 10.1016/j.envres.2012.07.006. - DOI - PubMed
    1. Taylor J.R. Neurological Manifestations in Humans Exposed to Chlordecone and Follow-up Results. Neurotoxicology. 1982;3:9–16. - PubMed

Publication types