Review
. 2023 Apr 26;13(9):1549.
doi: 10.3390/diagnostics13091549.

A Systematic Review and Meta-Analysis Comparing the Diagnostic Accuracy Tests of COVID-19

Affiliations
Review

A Systematic Review and Meta-Analysis Comparing the Diagnostic Accuracy Tests of COVID-19

Juan Jeferson Vilca-Alosilla et al. Diagnostics (Basel). .

Abstract

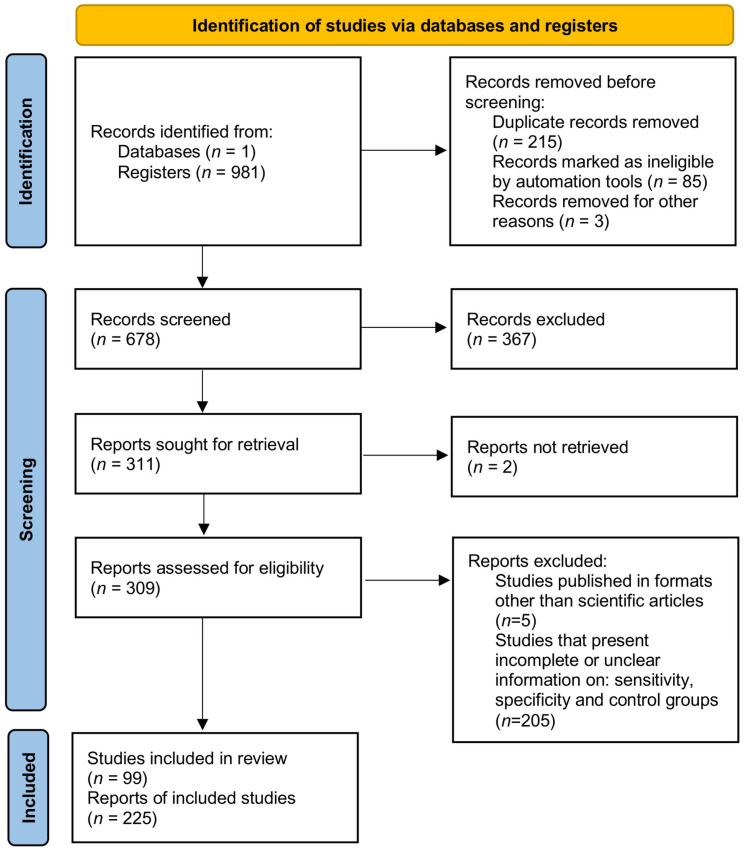
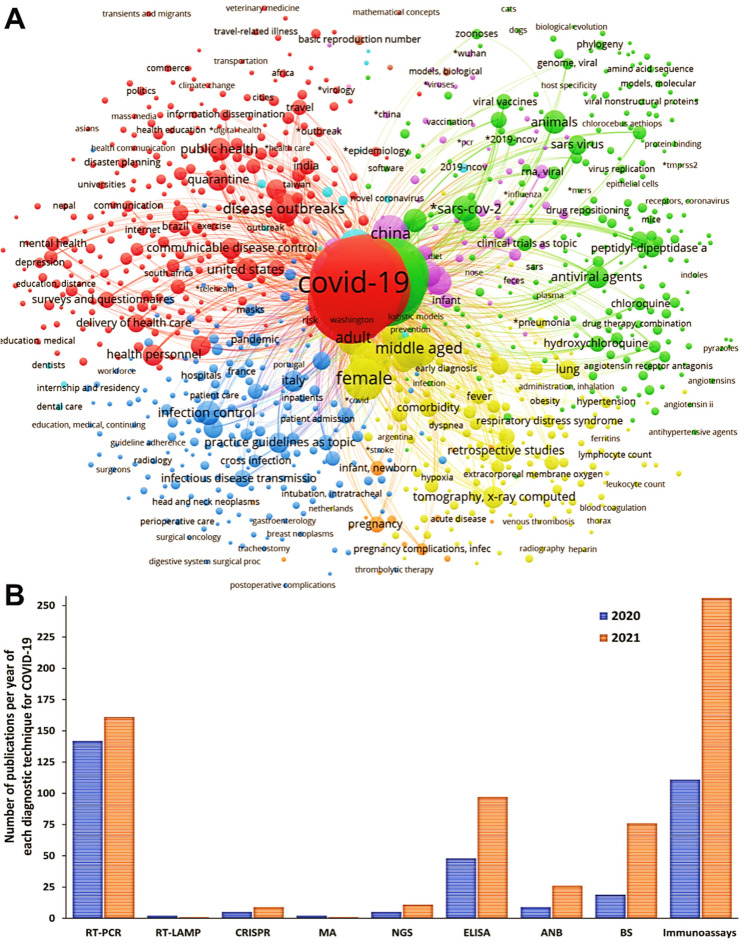
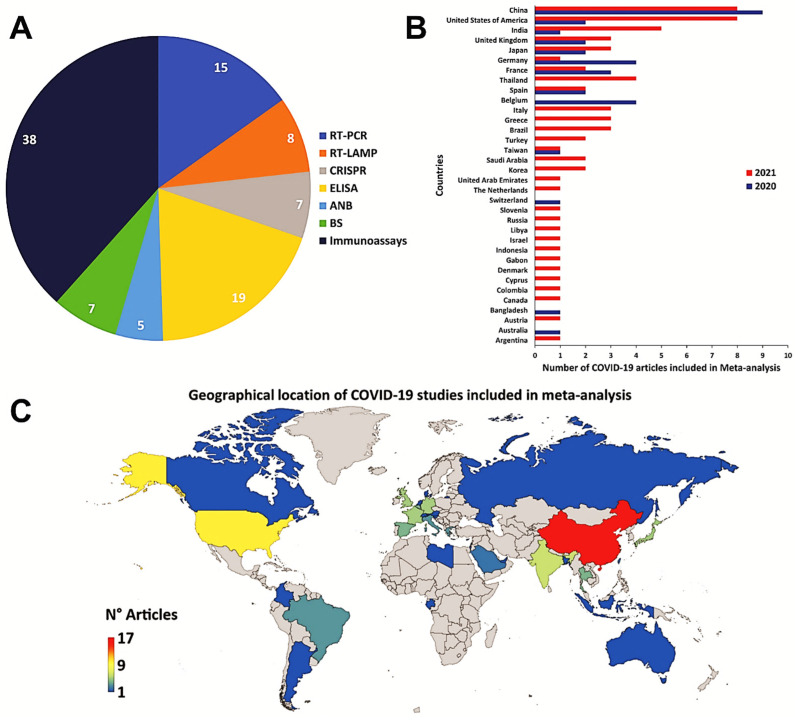
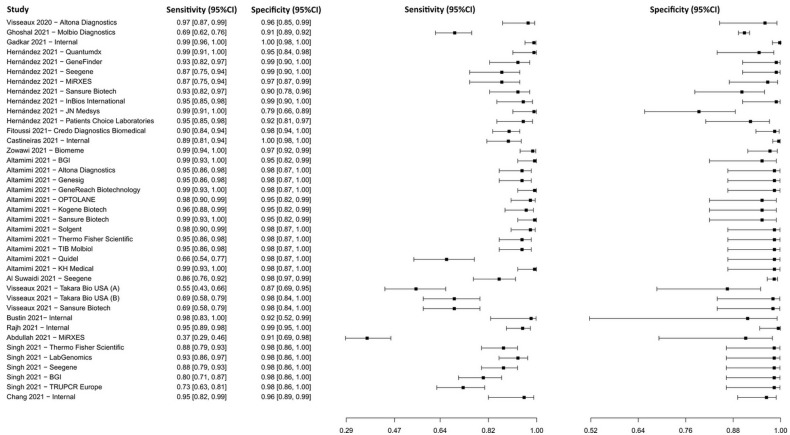
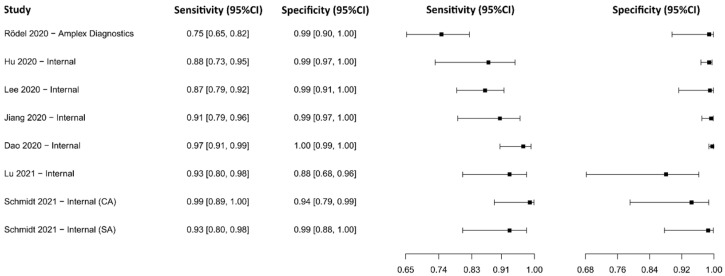
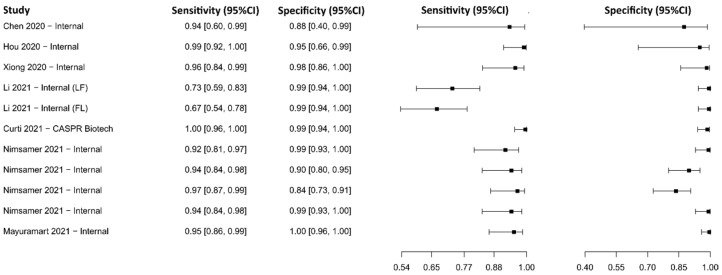
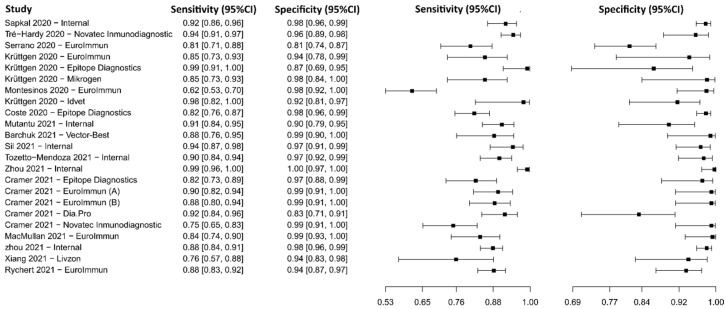
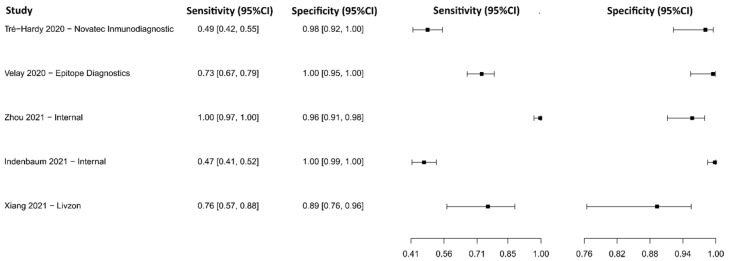
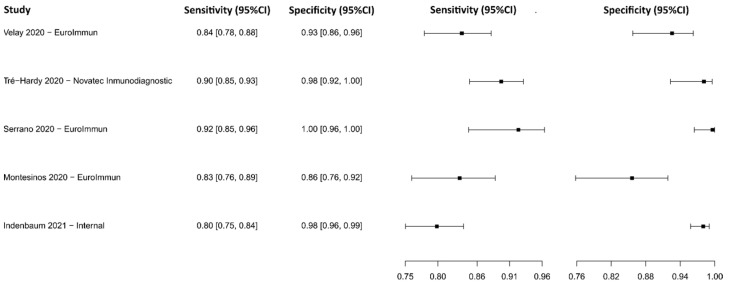
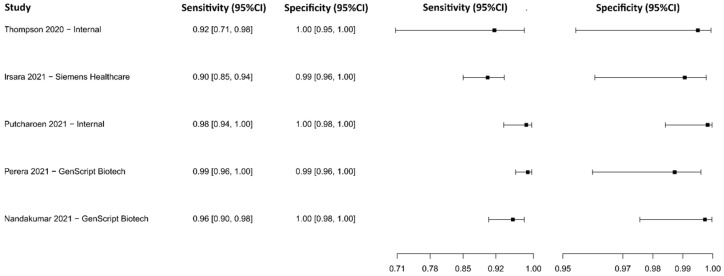
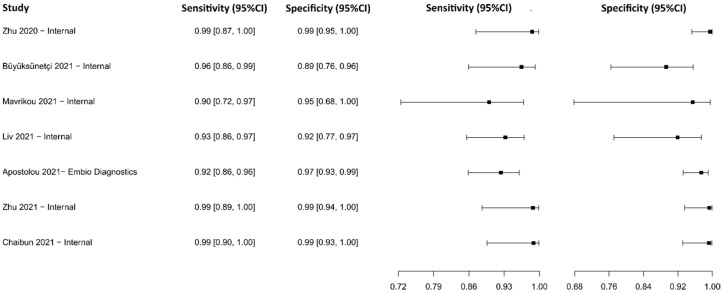
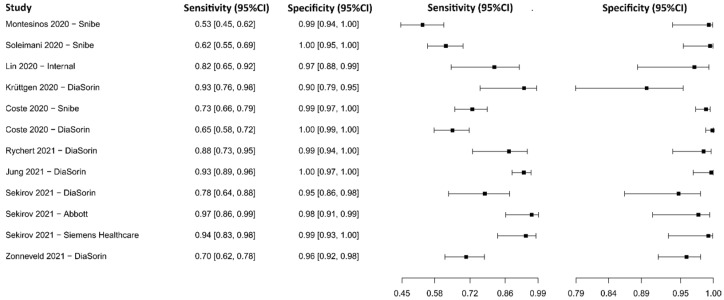
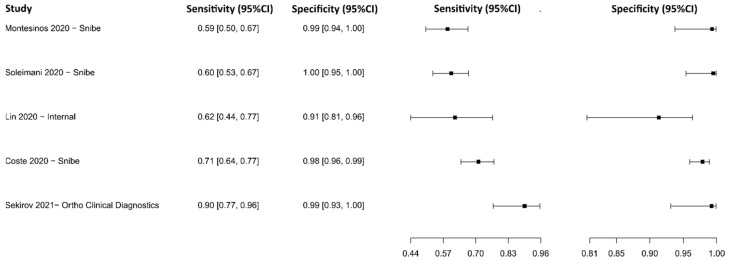
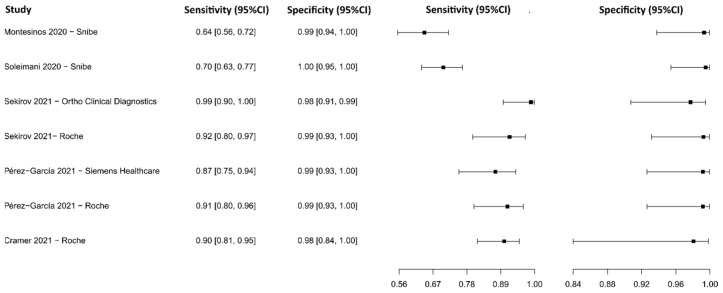
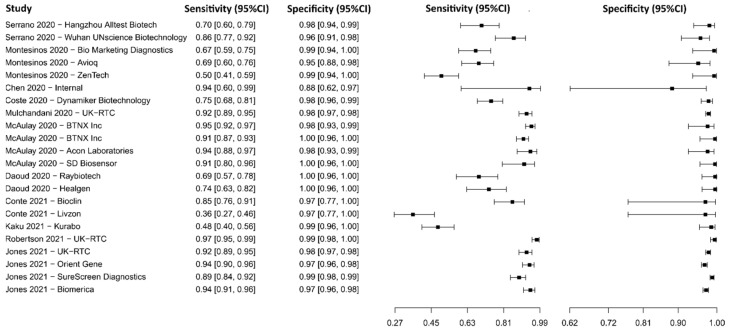
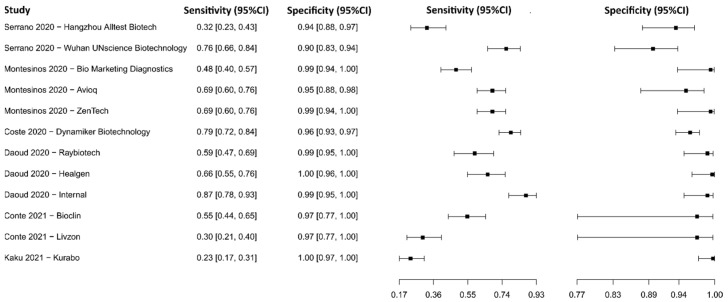
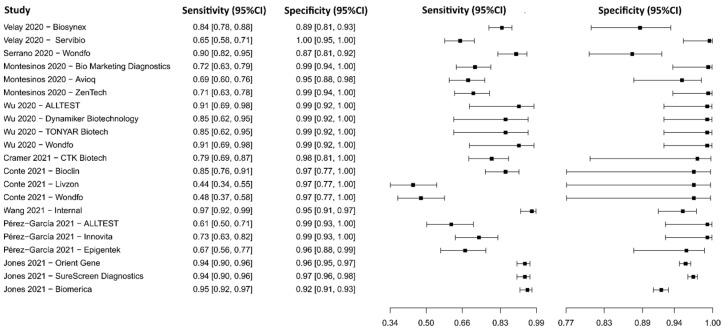
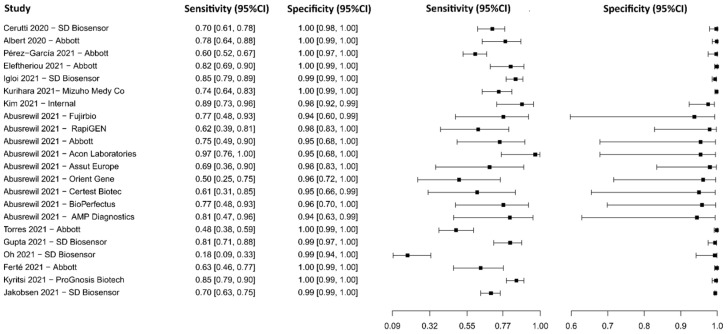
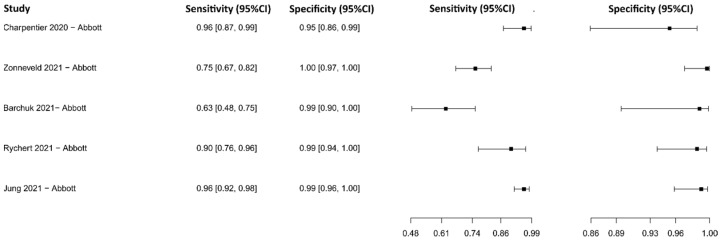
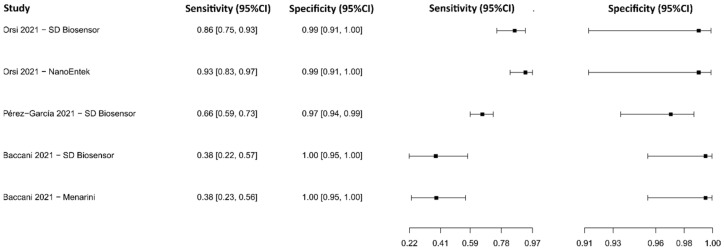
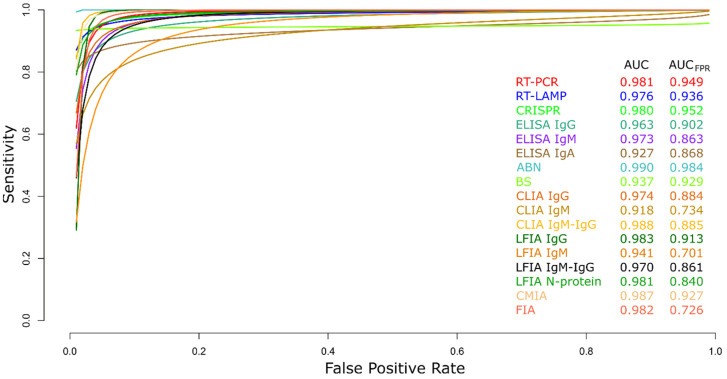
In this paper, we present a systematic review and meta-analysis that aims to evaluate the reliability of coronavirus disease diagnostic tests in 2019 (COVID-19). This article seeks to describe the scientific discoveries made because of diagnostic tests conducted in recent years during the severe acute respiratory syndrome coronavirus 2 (SARS-CoV-2) pandemic. Between 2020 and 2021, searches for published papers on the COVID-19 diagnostic were made in the PubMed database. Ninety-nine scientific articles that satisfied the requirements were analyzed and included in the meta-analysis, and the specificity and sensitivity of the diagnostic accuracy were assessed. When compared to serological tests such as the enzyme-linked immunosorbent assay (ELISA), chemiluminescence immunoassay (CLIA), lateral flow immunoassay (LFIA), and chemiluminescent microparticle immunoassay (CMIA), molecular tests such as reverse transcription polymerase chain reaction (RT-PCR), reverse transcription loop-mediated isothermal amplification (RT-LAMP), and clustered regularly interspaced short palindromic repeats (CRISPR) performed better in terms of sensitivity and specificity. Additionally, the area under the curve restricted to the false-positive rates (AUCFPR) of 0.984 obtained by the antiviral neutralization bioassay (ANB) diagnostic test revealed significant potential for the identification of COVID-19. It has been established that the various diagnostic tests have been effectively adapted for the detection of SARS-CoV-2; nevertheless, their performance still must be enhanced to contain potential COVID-19 outbreaks, which will also help contain potential infectious agent outbreaks in the future.

Keywords: SARS-CoV-2; diagnostic tests; meta-analysis; sensitivity; specificity; systematic review.


Conflict of interest statement

The authors declare no conflict of interest.

Figures

Figure 1
Figure 1
A systematic review and meta-analysis flow diagram of the study selection process.
Figure 2
Figure 2
Selected articles using the PubMed database for the different diagnostic techniques using MeSH terms. (A) Network map built by VOSviewer based on the co-occurrence of MeSH terms. (B) Number of articles found with the search for each diagnostic test, considered from cluster analysis.
Figure 3
Figure 3
The geographical location of COVID-19 studies. (A) The pie chart shows the type of diagnostic tests used in the COVID-19 studies for the meta-analysis. (B) The bar graph shows the number of COVID-19 studies, included in the meta-analysis, carried out by different countries. (C) Demographic representation of COVID-19 studies, included in the meta-analysis, worldwide (lower-blue to upper-red numbers).
Figure 4
Figure 4
Data analysis and paired forest plot of the sensitivity and specificity of the reverse transcription–polymerase chain reaction (RT-PCR) in the diagnosis of COVID-19. Sensitivity and specificity are reported as mean (95% confidence limits). The forest plot represents the estimated sensitivity and specificity (black squares) and their 95% confidence limits (horizontal black line) [44,45,46,47,48,49,50,51,52,53,54,55,56,57,58].
Figure 5
Figure 5
Data analysis and paired forest plot of the sensitivity and specificity of the reverse transcriptase loop-mediated isothermal amplification (RT-LAMP) in the diagnosis of COVID-19. Sensitivity and specificity are reported as mean (95% confidence limits). The forest plot represents the estimated sensitivity and specificity (black squares) and their 95% confidence limits (horizontal black line) [59,60,61,62,63,64,65].
Figure 6
Figure 6
Data analysis and paired forest plot of the sensitivity and specificity of the clustered regularly interspaced short palindromic repeats (CRISPR) in the diagnosis of COVID-19. Sensitivity and specificity are reported as mean (95% confidence limits). The forest plot represents the estimated sensitivity and specificity (black squares) and their 95% confidence limits (horizontal black line) [66,67,68,69,70,71,72].
Figure 7
Figure 7
Data analysis and paired forest plot of the sensitivity and specificity of the enzyme-linked immunosorbent assay (ELISA) for IgG in the diagnosis of COVID-19. Sensitivity and specificity are reported as mean (95% confidence limits). The forest plot represents the estimated sensitivity and specificity (black squares) and their 95% confidence limits (horizontal black line) [73,74,75,76,77,78,79,80,81,82,83,84,85,86,87,88].
Figure 8
Figure 8
Data analysis and paired forest plot of the sensitivity and specificity of the enzyme-linked immunosorbent assay (ELISA) for IgM in the diagnosis of COVID-19. Sensitivity and specificity are reported as mean (95% confidence limits). The forest plot represents the estimated sensitivity and specificity (black squares) and their 95% confidence limits (horizontal black line) [74,84,87,89,90].
Figure 9
Figure 9
Data analysis and paired forest plot of the sensitivity and specificity of the enzyme-linked immunosorbent assay (ELISA) for IgA in the diagnosis of COVID-19. Sensitivity and specificity are reported as mean (95% confidence limits). The forest plot represents the estimated sensitivity and specificity (black squares) and their 95% confidence limits (horizontal black line) [74,75,77,89,90].
Figure 10
Figure 10
Data analysis and paired forest plot of the sensitivity and specificity of the antiviral neutralization bioassay (ANB) in the diagnosis of COVID-19. Sensitivity and specificity are reported as mean (95% confidence limits). The forest plot represents the estimated sensitivity and specificity (black squares) and their 95% confidence limits (horizontal black line) [91,92,93,94,95].
Figure 11
Figure 11
Data analysis and paired forest plot of the sensitivity and specificity of the biosensors (BS) in the diagnosis of COVID-19. Sensitivity and specificity are reported as mean (95% confidence limits). The forest plot represents the estimated sensitivity and specificity (black squares) and their 95% confidence limits (horizontal black line) [96,97,98,99,100,101,102].
Figure 12
Figure 12
Data analysis and paired forest plot of the sensitivity and specificity of the chemiluminescence immunoassay (CLIA) for IgG in the diagnosis of COVID-19. Sensitivity and specificity are reported as mean (95% confidence limits). The forest plot represents the estimated sensitivity and specificity (black squares) and their 95% confidence limits (horizontal black line) [76,77,79,88,103,104,105,106,107].
Figure 13
Figure 13
Data analysis and paired forest plot of the sensitivity and specificity of the chemiluminescence immunoassay (CLIA) for IgM in the diagnosis of COVID-19. Sensitivity and specificity are reported as mean (95% confidence limits). The forest plot represents the estimated sensitivity and specificity (black squares) and their 95% confidence limits (horizontal black line) [77,79,103,104,106].
Figure 14
Figure 14
Data analysis and paired forest plot of the sensitivity and specificity of the chemiluminescence immunoassay (CLIA) for IgM-IgG in the diagnosis of COVID-19. Sensitivity and specificity are reported as mean (95% confidence limits). The forest plot represents the estimated sensitivity and specificity (black squares) and their 95% confidence limits (horizontal black line) [77,85,103,106,108].
Figure 15
Figure 15
Data analysis and paired forest plot of the sensitivity and specificity of the lateral flow immunoassay (LFIA) for IgG in the diagnosis of COVID-19. Sensitivity and specificity are reported as mean (95% confidence limits). The forest plot represents the estimated sensitivity and specificity (black squares) and their 95% confidence limits (horizontal black line) [75,77,79,109,110,111,112,113,114,115,116].
Figure 16
Figure 16
Data analysis and paired forest plot of the sensitivity and specificity of the lateral flow immunoassay (LFIA) for IgM in the diagnosis of COVID-19. Sensitivity and specificity are reported as mean (95% confidence limits). The forest plot represents the estimated sensitivity and specificity (black squares) and their 95% confidence limits (horizontal black line) [75,77,79,111,112,115].
Figure 17
Figure 17
Data analysis and paired forest plot of the sensitivity and specificity of the lateral flow immunoassay (LFIA) for IgM-IgG in the diagnosis of COVID-19. Sensitivity and specificity are reported as mean (95% confidence limits). The forest plot represents the estimated sensitivity and specificity (black squares) and their 95% confidence limits (horizontal black line) [75,77,85,90,108,109,115,117,118].
Figure 18
Figure 18
Data analysis and paired forest plot of the sensitivity and specificity of the lateral flow immunoassay (LFIA) for N-protein in the diagnosis of COVID-19. Sensitivity and specificity are reported as mean (95% confidence limits). The forest plot represents the estimated sensitivity and specificity (black squares) and their 95% confidence limits (horizontal black line) [119,120,121,122,123,124,125,126,127,128,129,130,131,132].
Figure 19
Figure 19
Data analysis and paired forest plot of the sensitivity and specificity of the chemiluminescent microparticle immunoassay (CMIA) in the diagnosis of COVID-19. Sensitivity and specificity are reported as mean (95% confidence limits). The forest plot represents the estimated sensitivity and specificity (black squares) and their 95% confidence limits (horizontal black line) [81,88,105,107,133].
Figure 20
Figure 20
Data analysis and paired forest plot of the sensitivity and specificity of the fluorescence immunoassay (FIA) in the diagnosis of COVID-19. Sensitivity and specificity are reported as mean (95% confidence limits). The forest plot represents the estimated sensitivity and specificity (black squares) and their 95% confidence limits (horizontal black line) [121,134,135].
Figure 21
Figure 21
Meta-analysis of diagnostic test accuracy analysis. Summary receiver operating curve (sROC) plot of false positive rate and sensitivity. Comparison between RT-PCR, RT-LAMP, CRISPR, ELISA IgG, ELISA IgM, ELISA IgA, ABN, BS, CLIA IgG, CLIA IgM, CLIA IgM-IgG, LFIA IgG, LFIA IgM, LFIA IgM-IgG, LFIA N protein, CMIA, and FIA methods in the diagnosis of COVID-19.

Similar articles

Cited by

References

    1. Goh G.K.-M., Dunker A.K., Foster J.A., Uversky V.N. Computational, Experimental, and Clinical Evidence of a Specific but Peculiar Evolutionary Nature of (COVID-19) SARS-CoV-2. J. Proteome Res. 2022;21:874–890. doi: 10.1021/acs.jproteome.2c00001. - DOI - PubMed
    1. Labib S.M., Browning M.H.E.M., Rigolon A., Helbich M., James P. Nature’s Contributions in Coping with a Pandemic in the 21st Century: A Narrative Review of Evidence during COVID-19. Sci. Total Environ. 2022;833:155095. doi: 10.1016/j.scitotenv.2022.155095. - DOI - PMC - PubMed
    1. Stiti M., Castanet G., Corber A., Alden M., Berrocal E. Transition from Saliva Droplets to Solid Aerosols in the Context of COVID-19 Spreading. Environ. Res. 2022;204:112072. doi: 10.1016/j.envres.2021.112072. - DOI - PMC - PubMed
    1. Lin Y., Sun J., Cao X., Wang X., Chen X., Xu H., Zhao J., Fu Y.-X., Peng H. Non-Adjuvanted Interferon-Armed RBD Protein Nasal Drops Protect Airway Infection from SARS-CoV-2. Cell Discov. 2022;8:43. doi: 10.1038/s41421-022-00411-4. - DOI - PMC - PubMed
    1. World Health Organization WHO Coronavirus (COVID-19) Dashboard. [(accessed on 13 February 2023)]. Available online: https://covid19.who.int/

LinkOut - more resources