. 2023 Apr 29;28(9):3810.
doi: 10.3390/molecules28093810.

Anticonvulsant Profile of Selected Medium-Chain Fatty Acids (MCFAs) Co-Administered with Metformin in Mice in Acute and Chronic Treatment

Affiliations

Anticonvulsant Profile of Selected Medium-Chain Fatty Acids (MCFAs) Co-Administered with Metformin in Mice in Acute and Chronic Treatment

Mateusz Pieróg et al. Molecules. .

Abstract

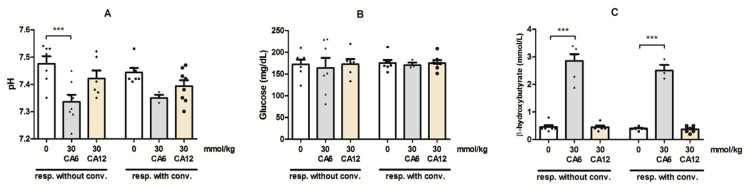
In contrast to the other components of the medium-chain triglycerides ketogenic diet (MCT KD), i.e., caprylic acid (CA8), a comprehensive evaluation of caproic (CA6) and lauric acids' (CA12) properties in standard chemical and electrical seizure tests in mice has not yet been performed. We investigated their effects in maximal electroshock seizure threshold (MEST), 6 Hz seizure threshold and intravenous (i.v.) pentylenetetrazole (PTZ) seizure tests. Since ketone body production can be regulated by the activation of 5'AMP-activated protein kinase (AMPK), we hypothesized that metformin (an AMPK activator) enhance ketogenesis and would act synergistically with the fatty acids to inhibit convulsions. We assessed the effects of acute and chronic co-treatment with metformin and CA6/CA8 on seizures. CA6 and CA12 (p.o.) increased seizure threshold in the 6 Hz seizure test. CA6 at the highest tested dose (30 mmol/kg) developed toxicity in several mice, impaired motor performance and induced ketoacidosis. Acute and chronic co-treatment with metformin and CA6/CA8 did not affect seizure thresholds. Moreover, we observed the pro-convulsive effect of the acute co-administration of CA8 (5 mmol/kg) and metformin (100 mg/kg). Since this co-treatment was pro-convulsive, the safety profile and risk/benefit ratio of MCT KD and metformin concomitant therapy in epileptic patients should be further evaluated.

Keywords: 6 Hz seizure test; MEST; caproic acid; caprylic acid; lauric acid; metformin; mice; pentylenetetrazole; seizure threshold; seizures.


Conflict of interest statement

The authors declare no conflict of interest.

Figures

Figure 1
Figure 1
Effects of caproic acid (CA6) and lauric acid (CA12) on the seizure threshold in the maximal electroshock seizure threshold (MEST) (A) and 6 Hz-induced seizure threshold (B) tests in mice. Both CA6 and CA12 (doses on abscissa) were injected orally (p.o.), 30 min before the tests. Control animals received 0.5% methylcellulose. Data are expressed as CS50 (in mA) values with 95% confidence limits (n = 12–15 mice/dose). Each CS50 value represents the current intensity predicted to produce convulsions in 50% of mice tested. Statistical analysis was performed using one-way ANOVA followed by Tukey’s multiple comparison test. ** p < 0.01, *** p < 0.001 as compared to the control group.
Figure 2
Figure 2
Effects of CA6 (AC) and CA12 (DF) on the seizure thresholds in the i.v. PTZ seizure test in mice. CA6 and CA12 (doses on abscissa) were administered 30 min prior to seizure testing; control animals received 0.5% methylcellulose. Each bar represents the mean dose (with individual measurements as symbols) and the standard error of the mean (SEM) of the PTZ (in mg/kg) necessary to produce myoclonic twitch (A,D), clonus (B,E) or tonus (C,F). Experimental groups consisted of 8–11 mice. Statistical analysis was performed using one-way ANOVA followed by Tukey’s multiple comparison test.
Figure 3
Figure 3
Changes in blood pH (A), blood glucose concentration (B) and β-hydroxybutyrate concentration (C) in mice after treatment with CA6 and CA12. The effects of CA6 (30 mmol/kg) and CA12 (30 mmol/kg) administration (p.o.) on blood biochemical parameters were investigated immediately after the 6 Hz seizure test. The doses are shown on the abscissa. Experimental groups consisted of 3–8 animals. Data are presented as means (with individual measurements as symbols) and SEM for groups that did or did not respond with post-stimulus convulsions. Statistical analysis was performed using two-way ANOVA followed by Bonferroni multiple comparison test. *** p < 0.001 as compared to the control group.
Figure 4
Figure 4
Effect of metformin on the seizure threshold in the MEST (A) and 6 Hz-induced seizure (B) tests in mice. Metformin (doses on abscissa) was injected p.o. 60 min before the tests. Control animals received saline. Data are expressed as CS50 (in mA) values with 95% confidence limits (n = 20 mice/group). Each CS50 value represents the current intensity predicted to produce convulsions in 50% of mice tested. Statistical analysis was performed using one-way ANOVA followed by Tukey’s multiple comparison test.
Figure 5
Figure 5
Effect of metformin on seizure thresholds in the i.v. PTZ seizure test. Metformin (doses on abscissa) was administered 60 min (p.o.) prior to seizure test; control animals received saline injections. Each bar represents the mean dose (with individual measurements as symbols) and SEM of the PTZ (in mg/kg) necessary to produce myoclonic twitch (A), clonus (B), or tonus (C). Experimental groups consisted of 8–13 mice. Statistical analysis was performed using one-way ANOVA followed by Tukey’s multiple comparison test.
Figure 6
Figure 6
Effects of acute and chronic (14 days) treatment with VPA (150 mg/kg) and co-treatment with metformin (100 mg/kg) and CA6 (5 mmol/kg)/CA8 (5 mmol/kg) on the 6 Hz-induced seizure thresholds. Metformin was administered 60 min (p.o.), CA6, CA8 (p.o.) and VPA (intraperitoneally, i.p.) 30 min before the seizure test. The doses are shown on the abscissa. Each experimental group consisted of 15–20 animals. The unequal group sizes result from post-administration complications and mortality during chronic treatment. Data are presented as CS50 (in mA) values with upper 95% confidence limits. Each CS50 value represents the current intensity predicted to produce convulsions in 50% of mice tested. Statistical analysis was performed using one-way ANOVA followed by Tukey’s multiple comparison test. *** p < 0.001 as compared to the acute-treated control group; ### p < 0.001 as compared to the chronic-treated control group.
Figure 7
Figure 7
Effects of chronic treatment with metformin (100 mg/kg), CA6 (5 mmol/kg), CA8 (5 mmol/kg) and their combination as well as VPA (150 mg/kg) on the body weight in mice. Substances/vehicles were injected p.o. or i.p. (only VPA) once daily on every day. Data are presented as means and SEM of weight (in g), n = 22–30. The unequal group sizes result from post-administration complications and mortality during chronic treatment. Statistical analysis was performed using two-way ANOVA followed by Tukey’s multiple comparison test. * p < 0.05 when comparing the metformin-treated group to the control group. ^ p < 0.05 when comparing the metformin-treated group to the CA6-treated group; # p < 0.05 when comparing the metformin-treated group to the metformin + CA6-treated group.
Figure 8
Figure 8
Changes in trunk blood pH (A), glucose concentration (B) and β-hydroxybutyrate concentration (C) in non-stimulated (sham) mice after chronic treatment with metformin (100 mg/kg), CA6 (5 mmol/kg)/CA8 (5mmol/kg) or their combinations, as well as VPA (150 mg/kg). The blood biochemical parameters were investigated 60 min after the last treatment with metformin and 30 min after the last CA6, CA8 and VPA injection. The doses are shown on the abscissa. Experimental groups consisted of 7–10 animals. Unequal group sizes result from post-administration complications and mortality during chronic treatment. Data are presented as means (with individual measurements as symbols) and SEM of trunk blood pH, glucose concentration (in mg/dL) or β-hydroxybutyrate concentration (in mmol/L). Statistical analysis was performed using one-way ANOVA followed by Tukey’s multiple comparison test. * p < 0.05, ** p < 0.01 as compared to the control group.

Similar articles

Cited by

References

    1. Billakota S., Devinsky O., Kim K.W. Why we urgently need improved epilepsy therapies for adult patients. Neuropharmacology. 2020;170:107855. doi: 10.1016/j.neuropharm.2019.107855. - DOI - PubMed
    1. Moshe S.L., Perucca E., Ryvlin P., Tomson T. Epilepsy: New advances. Lancet. 2015;385:884–898. doi: 10.1016/S0140-6736(14)60456-6. - DOI - PubMed
    1. Freeman J.M., Kossoff E.H., Hartman A.L. The ketogenic diet: One decade later. Pediatrics. 2007;119:535–543. doi: 10.1542/peds.2006-2447. - DOI - PubMed
    1. Wilder R.M. The effects of ketonemia on the course of epilepsy. Mayo Clin. Bull. 1921;2:307–308.
    1. Huttenlocher P.R., Wilbourn A.J., Signore J.M. Medium-chain triglycerides as a therapy for intractable childhood epilepsy. Neurology. 1971;21:1097–1103. doi: 10.1212/WNL.21.11.1097. - DOI - PubMed