. 2023 May 5;28(9):3910.
doi: 10.3390/molecules28093910.

Non-Phenomenological Description of the Time-Resolved Emission in Solution with Quantum-Classical Vibronic Approaches-Application to Coumarin C153 in Methanol

Affiliations

Non-Phenomenological Description of the Time-Resolved Emission in Solution with Quantum-Classical Vibronic Approaches-Application to Coumarin C153 in Methanol

Javier Cerezo et al. Molecules. .

Abstract

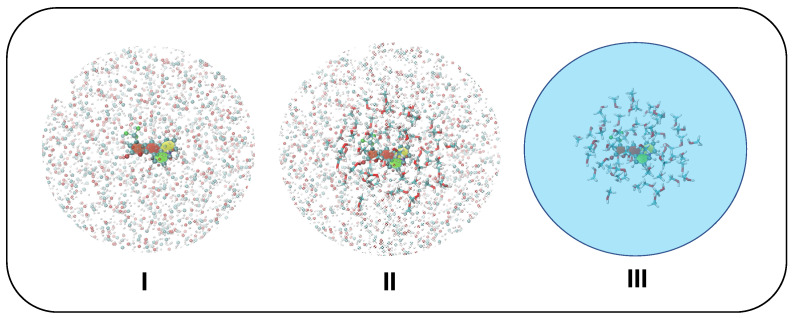
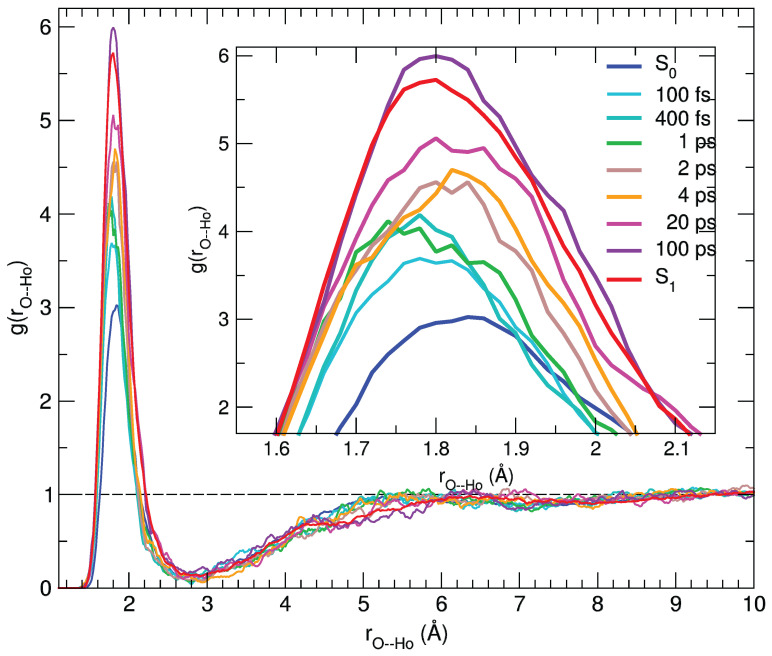
We report a joint experimental and theoretical work on the steady-state spectroscopy and time-resolved emission of the coumarin C153 dye in methanol. The lowest energy excited state of this molecule is characterized by an intramolecular charge transfer thus leading to remarkable shifts of the time-resolved emission spectra, dictated by the methanol reorganization dynamics. We selected this system as a prototypical test case for the first application of a novel computational protocol aimed at the prediction of transient emission spectral shapes, including both vibronic and solvent effects, without applying any phenomenological broadening. It combines a recently developed quantum-classical approach, the adiabatic molecular dynamics generalized vertical Hessian method (Ad-MD|gVH), with nonequilibrium molecular dynamics simulations. For the steady-state spectra we show that the Ad-MD|gVH approach is able to reproduce quite accurately the spectral shapes and the Stokes shift, while a ∼0.15 eV error is found on the prediction of the solvent shift going from gas phase to methanol. The spectral shape of the time-resolved emission signals is, overall, well reproduced, although the simulated spectra are slightly too broad and asymmetric at low energies with respect to experiments. As far as the spectral shift is concerned, the calculated spectra from 4 ps to 100 ps are in excellent agreement with experiments, correctly predicting the end of the solvent reorganization after about 20 ps. On the other hand, before 4 ps solvent dynamics is predicted to be too fast in the simulations and, in the sub-ps timescale, the uncertainty due to the experimental time resolution (300 fs) makes the comparison less straightforward. Finally, analysis of the reorganization of the first solvation shell surrounding the excited solute, based on atomic radial distribution functions and orientational correlations, indicates a fast solvent response (≈100 fs) characterized by the strengthening of the carbonyl-methanol hydrogen bond interactions, followed by the solvent reorientation, occurring on the ps timescale, to maximize local dipolar interactions.

Keywords: force field parameterization; mixed quantum chemical approaches; molecular dynamics; organic dyes; time-dependent density functional theory; time-resolved emission spectroscopy; vibronic approaches.


Conflict of interest statement

The authors declare no conflict of interest.

Figures

Figure 1
Figure 1
Absorption (black line: left axis) and emission spectrum (right axis, λexc=380 nm) of C153 in methanol at 298 K (red line). In the inset, the emission spectrum at 77 K (green line) and the phosphorescence spectrum in 1:1 methanol-C2H5I solution at 77 K (blue line) are also included.
Figure 2
Figure 2
Transient absorption spectra of C153 in methanol at the end of pulse and at different delays. Excitation at 350 nm (A350 = 0.2, 0.2 cm optical path, 6 μJ/pulse).
Figure 3
Figure 3
Absorption (abs, right) and emission (emi, left) spectra of C153 in vacuo (dashed lines) or methanol (solid lines) at 300 K, experimentally measured (blue and red lines) or computed (cyan and orange lines) by CEA-VE (top panels) and Ad-MD|gVH (bottom panels). To ease the comparison of the spectral shapes with the experimental signals measured in solution, all computed absorption and emission spectra were shifted by −0.23 eV, accounting for the solvent through model II.
Figure 4
Figure 4
Solvation schemes adopted in CEA-VE and Ad-MD|gVH protocols: model I, all solvent atoms within a 18 Å radius from C153 geometrical center are accounted for as point charges (shown with shaded spheres); model II, all solvent molecules within a 6 Å radius from C153 geometrical center are accounted for at full QM level (displayed with sticks), while all solvent atoms lying in between 6 and 18Å are still included as point charges; model III, all solvent molecules within 6 Å are included at full QM level, whereas the rest of the solvent is accounted for with PCM.
Figure 5
Figure 5
Comparison between lineshapes of the experimental transient absorption spectra (exp, top panel) and the computed time-resolved emission spectra (comp, bottom panel). All signals refer to the C153 dye at 1 atm and 300 K, in methanol solution, which in the computed spectra is accounted for through model II. Note that, to ease the comparison, all experimental signals were turned to positive and, in line with steady-state emission, all computed spectra were shifted by −0.23 eV.
Figure 6
Figure 6
Pair correlation functions between the (C=)O atom and the hydroxyl proton (Ho) of the solvent, computed for C153 at different time intervals and averaged over 100 snapshots.
Figure 7
Figure 7
Orientational correlations describing dipolar solute–solvent interactions computed at different times, and averaged over the nonequilibrium trajectories and for the two equilibrium trajectories (solute in its ground and in its excited state).
Figure 8
Figure 8
Pictorial sketch of the computational protocols applied in this work to simulate (a) steady-state (blue, top) and emission spectra (red, bottom) and (b) time-resolved emission spectra, exploiting nonequilibrium MD.
Figure 9
Figure 9
Top and side views of the chemical structure of coumarin C153. (a) Optimized QM structure (S0, PBE0/6-31G*): silver, red, blue, white and green spheres are employed for C, O, N, H and F atoms, respectively, whereas red and green shaded surfaces indicate aromatic or aliphatic rings. (b) Definition of flexible coordinates: δF (brown) governing the CH3 rotation and χ1(2) (blue), ruling the CH2 out-of-plane motion highlighted with the dashed lines.

Similar articles

Cited by

References

    1. He Y., Tang L., Wu X., Hou X., Lee Y.I. Spectroscopy: The best way toward green analytical chemistry? Appl. Spectrosc. Rev. 2007;42:119–138. doi: 10.1080/05704920601184259. - DOI
    1. Laane J. Frontiers of Molecular Spectroscopy. Elsevier; Amsterdam, The Netherlands: 2011.
    1. Drummen G.P. Fluorescent probes and fluorescence (microscopy) techniques—illuminating biological and biomedical research. Molecules. 2012;17:14067–14090. doi: 10.3390/molecules171214067. - DOI - PMC - PubMed
    1. Sasaki S., Drummen G.P., Konishi G.i. Recent advances in twisted intramolecular charge transfer (TICT) fluorescence and related phenomena in materials chemistry. J. Mater. Chem. C. 2016;4:2731–2743. doi: 10.1039/C5TC03933A. - DOI
    1. Suzuki S., Sasaki S., Sairi A.S., Iwai R., Tang B.Z., Konishi G.I. Principles of aggregation-induced emission: Design of deactivation pathways for advanced AIEgens and applications. Angew. Chem. 2020;132:9940–9951. doi: 10.1002/ange.202000940. - DOI - PMC - PubMed