. 2023 Apr 25;24(9):7805.
doi: 10.3390/ijms24097805.

An Evaluation of the Cytotoxic and Genotoxic Effects of the Marine Toxin C17-SAMT in Human TK6 and HepaRG Cell Lines

Affiliations

An Evaluation of the Cytotoxic and Genotoxic Effects of the Marine Toxin C17-SAMT in Human TK6 and HepaRG Cell Lines

Zeineb Marzougui et al. Int J Mol Sci. .

Abstract

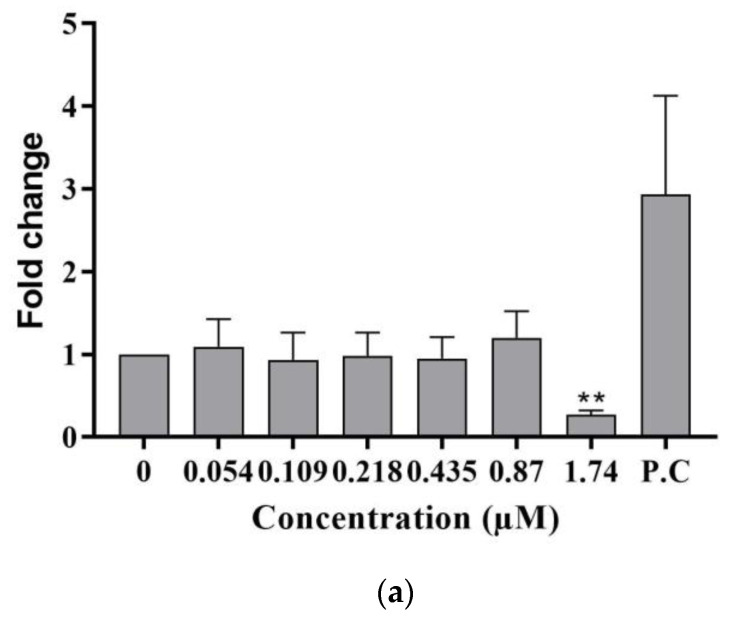
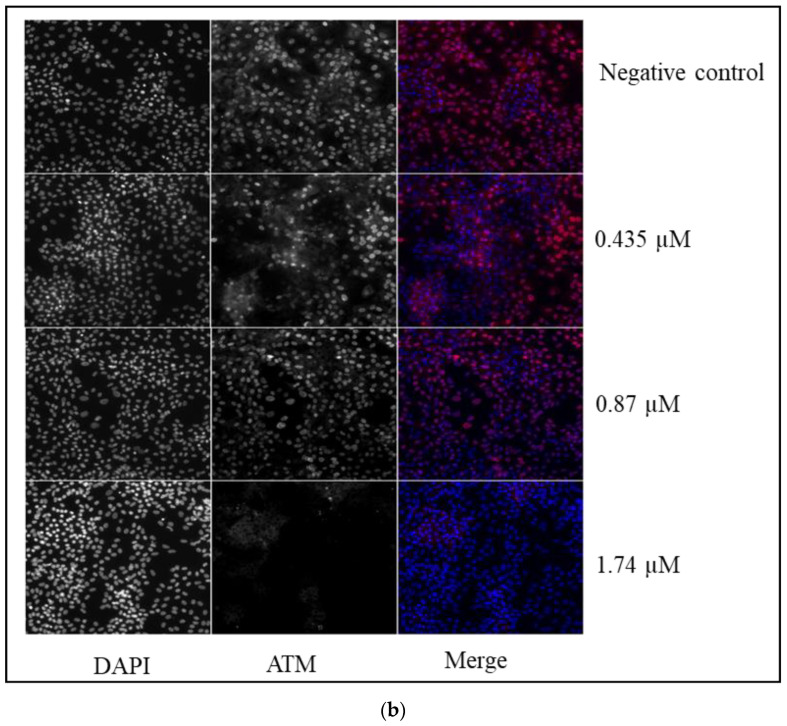
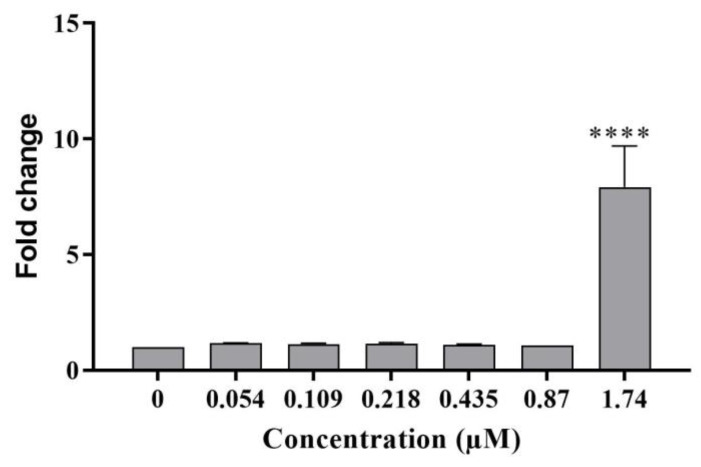
This study investigates the genotoxicity and cytotoxicity of C17-sphinganine analog mycotoxin (C17-SAMT) using in vitro assays. C17-SAMT was previously identified as the cause of unusual toxicity in cultured mussels from the Bizerte Lagoon in northern Tunisia. While a previous in vivo genotoxicity study was inconclusive, in vitro results demonstrated that C17-SAMT induced an increase in micronucleus formation in human lymphoblastoid TK6 cells at concentrations of 0.87 µM and 1.74 µM. In addition, multiparametric cytotoxicity assays were performed in the human hepatoma HepaRG cell line, which showed that C17-SAMT induced mitochondrial dysfunction, decreased cellular ATP levels, and altered the expression of various proteins, including superoxide dismutase SOD2, heme oxygenase HO-1, and NF-κB. These results suggest that C17-SAMT is mutagenic in vitro and can induce mitochondrial dysfunction in HepaRG cells. However, the exact mode of action of this toxin requires further investigation. Overall, this study highlights the potential toxicity of C17-SAMT and the need for further research to better understand its effects.

Keywords: C17-SAMT; in vitro; marine toxins; micronucleus assay; mitochondrial dysfunction; oxidative stress; pH3 phospho S10; γH2AX.


Conflict of interest statement

The authors declare no conflict of interest. The funders had no role in the design of the study; in the collection, analyses, or interpretation of data; in the writing of the manuscript; or in the decision to publish the results.

Figures

Figure 1
Figure 1
Micronucleus test with C17-SAMT in TK6 cells following a 24 h treatment ((A) exp. 1, and (B) exp. 2). Graphs represent the frequency of micronucleated TK6 cells. The cytotoxicity is indicated by RICC and relative population doubling (RPD). * p < 0.05 and **** p < 0.0001.
Figure 2
Figure 2
(a) γH2AX and phospho-H3 levels in proliferative HepaRG cells exposed to C17-SAMT for 24 h. (A) Experiment 1 and (B) experiment 2. All results are expressed as fold change compared to the negative controls. Two independent experiments are presented. * p < 0.05; *** p < 0.001; **** p < 0.0001. (b) γH2AX and phospho-H3 levels in differentiated HepaRG cells exposed to C17-SAMT for 48 h. (A) Experiment 1 and (B) experiment 2. All results are expressed as fold change compared to the negative controls. Two independent experiments are presented. * p < 0.05; ** p < 0.01; *** p < 0.001.
Figure 2
Figure 2
(a) γH2AX and phospho-H3 levels in proliferative HepaRG cells exposed to C17-SAMT for 24 h. (A) Experiment 1 and (B) experiment 2. All results are expressed as fold change compared to the negative controls. Two independent experiments are presented. * p < 0.05; *** p < 0.001; **** p < 0.0001. (b) γH2AX and phospho-H3 levels in differentiated HepaRG cells exposed to C17-SAMT for 48 h. (A) Experiment 1 and (B) experiment 2. All results are expressed as fold change compared to the negative controls. Two independent experiments are presented. * p < 0.05; ** p < 0.01; *** p < 0.001.
Figure 3
Figure 3
(a) Phospho ATM S1981 levels in differentiated HepaRG cells following a 24 h treatment with C17-SAMT. Amiodarone is used as a positive control at 100 µM. The presented results are the combination of three independent experiments with three technical replicates. ** p < 0.01. (b) Representative images representing phospho ATM immunostaining in differentiated HepaRG cells exposed to C17-SAMT for 24 h.
Figure 3
Figure 3
(a) Phospho ATM S1981 levels in differentiated HepaRG cells following a 24 h treatment with C17-SAMT. Amiodarone is used as a positive control at 100 µM. The presented results are the combination of three independent experiments with three technical replicates. ** p < 0.01. (b) Representative images representing phospho ATM immunostaining in differentiated HepaRG cells exposed to C17-SAMT for 24 h.
Figure 4
Figure 4
(a) Mitochondrial transmembrane potential in differentiated HepaRG cells after 1, 2, 4, and 24 h treatments with C17-SAMT. Amiodarone (100 µM) was used as a positive control. * p < 0.05; ** p < 0.01; *** p < 0.001; **** p < 0.0001. (b) Representative images of TMRE intensity in differentiated HepaRG cells following different exposure times to C17-SAMT.
Figure 5
Figure 5
Relative ATP levels in differentiated HepaRG cells after exposure to C17-SAMT from 1 h to 24 h. Amiodarone 100 µM was used as a positive control. * p < 0.5, *** p < 0.001, **** p < 0.0001.
Figure 6
Figure 6
(a) NF-κB fold change in the cytoplasm (A) and nuclei (B) of HepaRG cells after exposure to C17-SAMT for 1 to 24 h. * p < 0.05; ** p < 0.01. (b) Representative images of NF-κB immunostaining intensity in HepaRG cells after 24 h of exposure to C17-SAMT. (c) NF-κB translocation (nucleus/cytoplasm ratio) in differentiated HepaRG cells following treatment with C17-SAMT for 1 h to 24 h. (*) p < 0.05.
Figure 6
Figure 6
(a) NF-κB fold change in the cytoplasm (A) and nuclei (B) of HepaRG cells after exposure to C17-SAMT for 1 to 24 h. * p < 0.05; ** p < 0.01. (b) Representative images of NF-κB immunostaining intensity in HepaRG cells after 24 h of exposure to C17-SAMT. (c) NF-κB translocation (nucleus/cytoplasm ratio) in differentiated HepaRG cells following treatment with C17-SAMT for 1 h to 24 h. (*) p < 0.05.
Figure 7
Figure 7
IL-8 secretion in differentiated HepaRG cells exposed for 24 h to C17-SAMT. TNF α (100 ng/mL) was used as a positive control. Mean concentrations ± SD are shown. * p < 0.05; **** p < 0.0001).
Figure 8
Figure 8
Mitochondrial superoxide dismutase SOD2 in differentiated HepaRG cells after 24 h exposure to C17-SAMT, with representative images of SOD2 immunostaining in HepaRG cells after 24 h exposure to C17-SAMT. **** p < 0.0001.
Figure 8
Figure 8
Mitochondrial superoxide dismutase SOD2 in differentiated HepaRG cells after 24 h exposure to C17-SAMT, with representative images of SOD2 immunostaining in HepaRG cells after 24 h exposure to C17-SAMT. **** p < 0.0001.
Figure 9
Figure 9
Heme oxygenase-1 levels in differentiated HepaRG cells exposed to C17-SAMT for 24 h. * p < 0.05.

Similar articles

References

    1. Amend A., Burgaud G., Cunliffe M., Edgcomb V.P., Ettinger C.L., Gutiérrez M.H., Heitman J., Hom E.F.Y., Ianiri G., Jones A.C., et al. Fungi in the Marine Environment: Open Questions and Unsolved Problems. mBio. 2019;10:e01189-18. doi: 10.1128/mBio.01189-18. - DOI - PMC - PubMed
    1. Gürbüzel M., Uysal H., Kızılet H. Assessment of Genotoxic Potential of Two Mycotoxins in the Wing Spot Test of Drosophila Melanogaster. Toxicol. Ind. Health. 2015;31:261–267. doi: 10.1177/0748233712472528. - DOI - PubMed
    1. Bensassi F., Gallerne C., Sharaf el dein O., Hajlaoui M.R., Lemaire C., Bacha H. In Vitro Investigation of Toxicological Interactions between the Fusariotoxins Deoxynivalenol and Zearalenone. Toxicon. 2014;84:1–6. doi: 10.1016/j.toxicon.2014.03.005. - DOI - PubMed
    1. Ülger T.G., Uçar A., Çakıroğlu F.P., Yilmaz S. Genotoxic Effects of Mycotoxins. Toxicon. 2020;185:104–113. doi: 10.1016/j.toxicon.2020.07.004. - DOI - PubMed
    1. Wen J., Mu P., Deng Y. Mycotoxins: Cytotoxicity and Biotransformation in Animal Cells. Toxicol. Res. 2016;5:377–387. doi: 10.1039/c5tx00293a. - DOI - PMC - PubMed

LinkOut - more resources